


Floating Power Plant Market Synopsis:
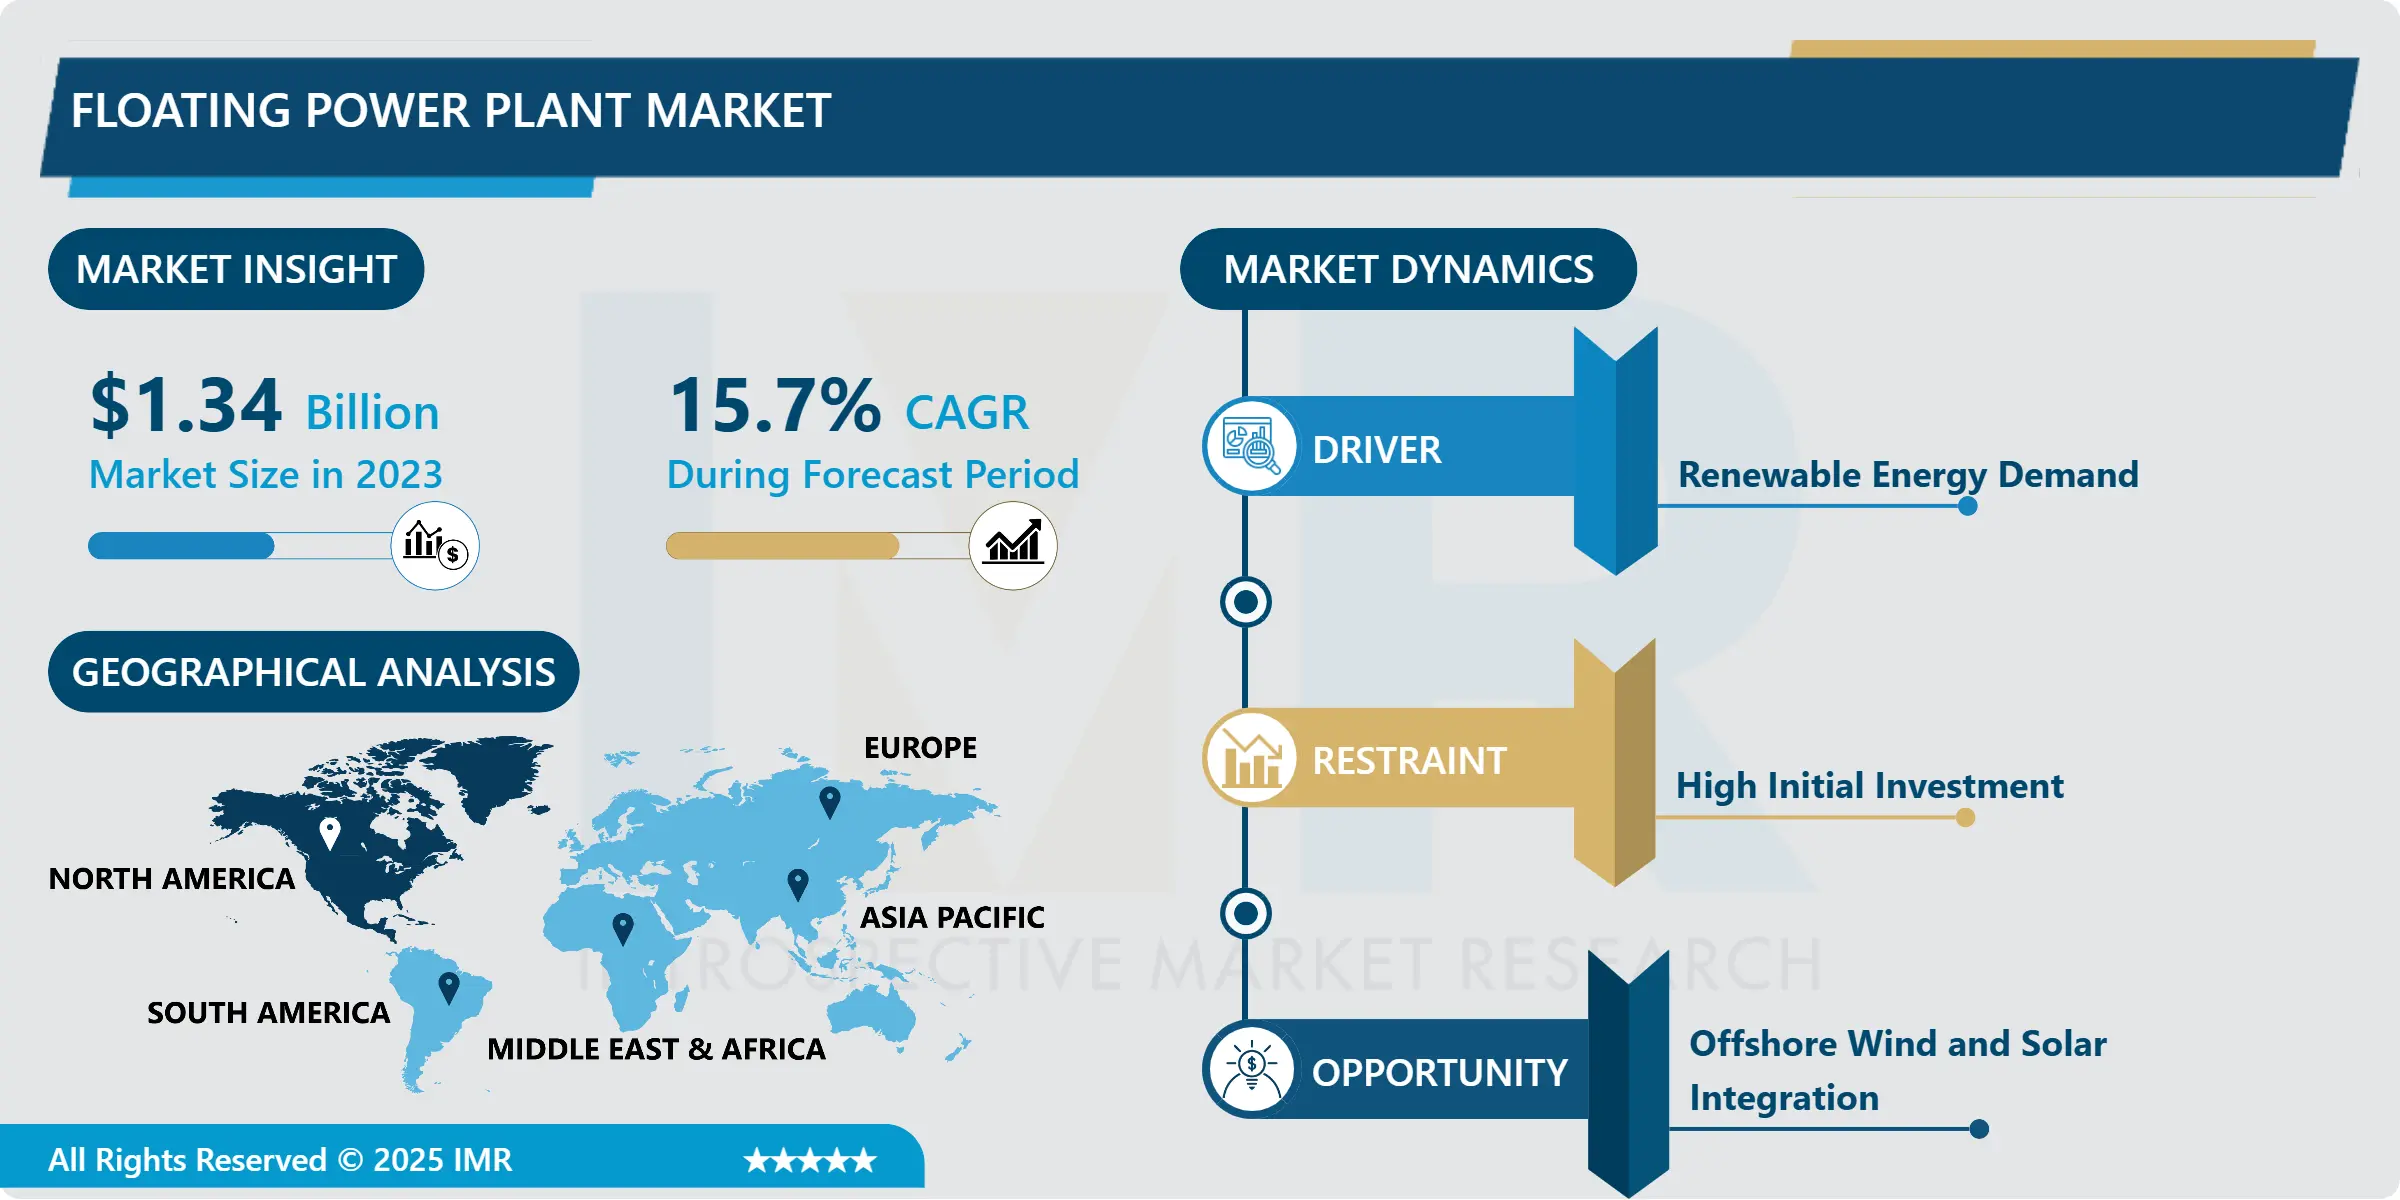
Floating Power Plant Market Size Was Valued at USD 1.34 Billion in 2023, and is Projected to Reach USD 4.98 Billion by 2032, Growing at a CAGR of 15.7% From 2024-2032
The global market for floating power plant in simple terms means the creation and utilization of power generation system involving installation on floating structure usually on water like ocean, sea or some big lake. Such plants harness renewable energy by utilizing wind, solar or wave power to generate electricity in offshore or hard to reach sites on land. Some of the benefits of float support power plants include; they take less space, it is easy to exploit offshore winds, boosted wave energy and moving from one place to another is easy. Global demand for renewable energy sources is increasing, as the paramount interest in clean and more flexible solutions for power generation increases.
There is a great opportunity for FPP market to grow due to the increasing necessity of sustainable energy sources utilization and tendency for using offshore renewable energy installations. FPPs are being designed to produce power from the renewable energy resources such as wind, solar and ocean currents to support electricity generation in geographical areas where it is difficult to put up conventional onshore power stations. One of the main drivers of their growth is that they can be installed in deep water and with high wind speeds where it is impossible to build conventional energy generation structures. Some of the benefits are that they can be easily located off shore therefore avoiding occupation of large areas of land affecting terrestrial ecosystems. Also, they can be sited wherever wanted increasing the efficiency of generation and providing energy to remote or island areas.
There is further amplified by the technological development of renewable energy generation and overall international drive towards de-carbonization. As public and private stakeholders continue to pour resources into offshore wind and solar power projects, floating power plants have become an important part of the renewable energy equation. These plants can be mobilized and deployed in a short span of time with minimal onshore structure and hence is lot cheaper and takes less time than the conventional energy generation techniques. Furthermore, the integration of several renewable resources like offshore wind and above solar, in a single FPP development increases the effectiveness and controllability of energy generation and distribution thereby, making FPPs a preferable solution for satisfying increasing electric power demands in sparsely inhabited areas with low land space. Nonetheless, issues of technology development, high capital intensity, and regulatory issues remain key factors that slow down the adoption of renewable energy sources, while ongoing enhancements in technology and supportive policies are likely to help reduce these impediments in future.
Floating Power Plant Market Trend Analysis:
Advantages and Growth Drivers of Floating Power Plants (FPPs)
- Floating power plants (FPPs) allow to combine renewable energy sources such as offshore wind, solar and other forms of floatable offshore renewable energy resources basically in deep sea area from the shore line. Such flexibility makes FPPs to obtain inexpensive and efficient renewable resources where onshore or nearshore plants cannot be achieved due to constrained space and structural development. The flexibility of obtaining energy from vast offshore resources without having to put up fixed installations on the ground is an advantage of using floating power plants in the development of clean electricity.
- In addition, as the global focus grows stronger on decarbonization and the containment of greenhouse gases, floating power plants are gaining more popularity as multipurpose power generation structures that are not based on the utilization of fossil fuels. The capability to produce utility scale clean, renewable power from offshore sites contributes to ensuring a sustainable energy future. FPPs are arguably the most important avenue of energy supply for the world’s country which want to supply high energy at lower environmental effects hence fuel the use of renewable energy systems in combating climate change.
Expanding Opportunities in Renewable Energy Deployment
- The largest of these opportunities, the continuation of new renewable energy applications, especially offshore wind and use of solar power, resides in the floating power plant market. Flexible structure like the floating platform is benefitting the industry in a way that many physical structures cannot be built in a particular area due to the deep water or lack of space for installation of devices for electricity production. Such platforms also result in competitive costs due to limited need for large tracts of land and the use of implementable structures. Float- ing wind farms are particularly useful for offshore wind power, as the sites have higher wind speeds and more stable conditions than onshore facilities. Solar power projects are also growing popular, and floating solar farms are becoming a concept of interest to countries that want to produce more energy but without consuming much land.
- Governments all around the world are coming up with policies that support renewable energy, subsidies and regulations to support the use of floating power plant investment. More countries than ever have sustained goals accompanying significant reliance on renewable resources, and floating power plants are recognized more and more as effective components of these goals. especially the emerging economics partner considers such plants as a viable way to solve the energy deficits and bring electricity to the remote areas that are not connected to the grid. These regions can achieve energy diversification and at the same time, decrease the use of fossil fuel apart from helping the global effort of decrease carbon emissions and provide energy security.
Floating Power Plant Market Segment Analysis:
Floating Power Plant Market Segmented on the basis of Source, Capacity, Type, and Region.
By Source, Renewable segment is expected to dominate the market during the forecast period
- Such forms of energy as solar, wind power is gaining popularity as world economy transforms to sustainable energy mark joined with dramatic innovations in clean energy forms. With reference to flexibility of installation options and decreasing costs of installation for large scale solar energy systems, its applicability in residential as well as industrial sectors, large scale solar energy systems has gained tremendous popularity. This is because the use of solar power is flexible thus can be applied anywhere hence both off grid and grid connected. Wind energy power generation, for its part, suited for large scale electric power generation especially in areas with favourable wind resource. That ability has made it a foundational component of renewable energy plans across the globe due to its ability to produce vast amounts of power while using little space.
- Subsidies, tax exemptions, and highly targeted low carbon emissions have encouraged development of solar farm, wind park and even hybrid systems. New technology in the form of better batteries for energy storage and the smart grid are also increasing the dependability and performance of renewable energy systems. That is why the renewable segment has become the most rapidly developing market in the power generation industry and offers significant contributions to global energy transition and climate change.
By Type, Ships segment expected to held the largest share
- Ships energy requirements are comprehensive structures categorized in power generation systems categorized depending on the application of energy used in ships. Conventional systems of such power plants have used internal combustion (IC) engines or gas turbines operating with fossil fuel like diesel and liquefied natural gas (LNG). These setups offer dependable and constant energy yield to support naval operations without disturbances even through long-distance trips. Hence the flexibility that LNG provides in terms of lower emissions than traditional marine fuels has placed LNG as the preferred choice by modern shipping fleets due to its affordability and efficiency.
- However, the global shipping industry is in the process of an enormous transition due to the greenhouse emission-control regulations set by the IMO. It has advanced the solution hybrid technologies that integrates traditional engines and renewable technologies as well as fully electric propulsion systems of highly advanced batteries. These innovations do not only decrease fuel consumption and emissions but also comply with the operative goals of the international sustainable development a new paradigm of clean maritime transportation. The tilt towards better and environmentally friendly technologies try to convey the message of long-term sustainability environmentally and economically.
Floating Power Plant Market Regional Insights:
North America is Expected to Dominate the Market Over the Forecast period
- The floating power plant market is moderately growing in North America most especially in the United States. These floating structures have received attention in the application of gas-fired power plants because they generate electricity quickly and flexibly in areas prone to natural disasters including hurricanes. These plants are very important in boosting power reliability by providing a backup source of power in dire cases. Furthermore, there is steady rising interest in renewable energy projects especially floating solar ones which could be caused by various factors that make it difficult to generate energy in areas populated by many people or habitats of sensitive species of animals. The above result is anchored on the dual process of building resilience and sustainability that is characterizing the market’s development in North America.
- However, Latin America and Africa are two regions that still remain fairly untapped markets for floating power plants. Lack of or limited connection to the grid and high dependence on hydro power pose special conditions favorable for floats in these locations. For instance, floating power plants help trim fluctuating hydroelectric generation due to droughts so that customers can always get power. They also offer a flexible way to extend access to electricity for populations not served by other means due to high costs of infrastructure development. Due to flexibility of operation, the floating power plants can easily fit various environments and geographical locations thus can be effective solution to the energy issues in these areas.
Active Key Players in the Floating Power Plant Market:
- Burmeister & Wain Scandinavian Contractor A/S;
- Caterpillar, Inc.;
- Ciel & Terre International;
- Floating Power Plant A/S;
- General Electric Company
- Ideol;
- Kyocera Corporation;
- MAN Diesel & Turbo SE;
- Mitsubishi Corporation; Siemens AG;
- Principle Power, Inc.;
- SeaTwirl AB;
- Upsolar;
- Vikram Solar Pvt., Ltd.;
- Wartsila;
- Yingli Solar;
- Other Active Players
|
Floating Power Plant Market |
|||
|
Base Year: |
2023 |
Forecast Period: |
2024-2032 |
|
Historical Data: |
2017 to 2023 |
Market Size in 2023: |
USD 1.34 Billion. |
|
Forecast Period 2024-32 CAGR: |
15.7% |
Market Size in 2032: |
USD 4.98 Billion |
|
Segments Covered: |
By Source |
|
|
|
By Capacity |
|
||
|
By Type |
|
||
|
By Region |
|
||
|
Key Market Drivers: |
|
||
|
Key Market Restraints: |
|
||
|
Key Opportunities: |
|
||
|
Companies Covered in the report: |
|
||
Chapter 1: Introduction
1.1 Scope and Coverage
Chapter 2:Executive Summary
Chapter 3: Market Landscape
3.1 Market Dynamics
3.1.1 Drivers
3.1.2 Restraints
3.1.3 Opportunities
3.1.4 Challenges
3.2 Market Trend Analysis
3.3 PESTLE Analysis
3.4 Porter's Five Forces Analysis
3.5 Industry Value Chain Analysis
3.6 Ecosystem
3.7 Regulatory Landscape
3.8 Price Trend Analysis
3.9 Patent Analysis
3.10 Technology Evolution
3.11 Investment Pockets
3.12 Import-Export Analysis
Chapter 4: Floating Power Plant Market by Source
4.1 Floating Power Plant Market Snapshot and Growth Engine
4.2 Floating Power Plant Market Overview
4.3 Non-renewable
4.3.1 Introduction and Market Overview
4.3.2 Historic and Forecasted Market Size in Value USD and Volume Units (2017-2032F)
4.3.3 Key Market Trends, Growth Factors and Opportunities
4.3.4 Non-renewable: Geographic Segmentation Analysis
4.4 Gas Turbines
4.4.1 Introduction and Market Overview
4.4.2 Historic and Forecasted Market Size in Value USD and Volume Units (2017-2032F)
4.4.3 Key Market Trends, Growth Factors and Opportunities
4.4.4 Gas Turbines: Geographic Segmentation Analysis
4.5 IC Engines
4.5.1 Introduction and Market Overview
4.5.2 Historic and Forecasted Market Size in Value USD and Volume Units (2017-2032F)
4.5.3 Key Market Trends, Growth Factors and Opportunities
4.5.4 IC Engines: Geographic Segmentation Analysis
4.6 Renewable
4.6.1 Introduction and Market Overview
4.6.2 Historic and Forecasted Market Size in Value USD and Volume Units (2017-2032F)
4.6.3 Key Market Trends, Growth Factors and Opportunities
4.6.4 Renewable: Geographic Segmentation Analysis
4.7 Solar and Wind
4.7.1 Introduction and Market Overview
4.7.2 Historic and Forecasted Market Size in Value USD and Volume Units (2017-2032F)
4.7.3 Key Market Trends, Growth Factors and Opportunities
4.7.4 Solar and Wind: Geographic Segmentation Analysis
Chapter 5: Floating Power Plant Market by Capacity,
5.1 Floating Power Plant Market Snapshot and Growth Engine
5.2 Floating Power Plant Market Overview
5.3 Below 5.0 MW
5.3.1 Introduction and Market Overview
5.3.2 Historic and Forecasted Market Size in Value USD and Volume Units (2017-2032F)
5.3.3 Key Market Trends, Growth Factors and Opportunities
5.3.4 Below 5.0 MW: Geographic Segmentation Analysis
5.4 0 MW–20 MW
5.4.1 Introduction and Market Overview
5.4.2 Historic and Forecasted Market Size in Value USD and Volume Units (2017-2032F)
5.4.3 Key Market Trends, Growth Factors and Opportunities
5.4.4 0 MW–20 MW: Geographic Segmentation Analysis
5.5 0 MW–100 MW
5.5.1 Introduction and Market Overview
5.5.2 Historic and Forecasted Market Size in Value USD and Volume Units (2017-2032F)
5.5.3 Key Market Trends, Growth Factors and Opportunities
5.5.4 0 MW–100 MW: Geographic Segmentation Analysis
5.6 0 MW–250 MW and Above 250 MW
5.6.1 Introduction and Market Overview
5.6.2 Historic and Forecasted Market Size in Value USD and Volume Units (2017-2032F)
5.6.3 Key Market Trends, Growth Factors and Opportunities
5.6.4 0 MW–250 MW and Above 250 MW: Geographic Segmentation Analysis
Chapter 6: Floating Power Plant Market by Type
6.1 Floating Power Plant Market Snapshot and Growth Engine
6.2 Floating Power Plant Market Overview
6.3 Ships
6.3.1 Introduction and Market Overview
6.3.2 Historic and Forecasted Market Size in Value USD and Volume Units (2017-2032F)
6.3.3 Key Market Trends, Growth Factors and Opportunities
6.3.4 Ships: Geographic Segmentation Analysis
6.4 Barges and Others (Platforms
6.4.1 Introduction and Market Overview
6.4.2 Historic and Forecasted Market Size in Value USD and Volume Units (2017-2032F)
6.4.3 Key Market Trends, Growth Factors and Opportunities
6.4.4 Barges and Others (Platforms: Geographic Segmentation Analysis
6.5 Etc.)
6.5.1 Introduction and Market Overview
6.5.2 Historic and Forecasted Market Size in Value USD and Volume Units (2017-2032F)
6.5.3 Key Market Trends, Growth Factors and Opportunities
6.5.4 Etc.): Geographic Segmentation Analysis
Chapter 7: Company Profiles and Competitive Analysis
7.1 Competitive Landscape
7.1.1 Competitive Benchmarking
7.1.2 Floating Power Plant Market Share by Manufacturer (2023)
7.1.3 Industry BCG Matrix
7.1.4 Heat Map Analysis
7.1.5 Mergers and Acquisitions
7.2 WARTSILA
7.2.1 Company Overview
7.2.2 Key Executives
7.2.3 Company Snapshot
7.2.4 Role of the Company in the Market
7.2.5 Sustainability and Social Responsibility
7.2.6 Operating Business Segments
7.2.7 Product Portfolio
7.2.8 Business Performance
7.2.9 Key Strategic Moves and Recent Developments
7.2.10 SWOT Analysis
7.3 MAN DIESEL & TURBO SE
7.4 UPSOLAR
7.5 BURMEISTER & WAIN SCANDINAVIAN CONTRACTOR A/S
7.6 MITSUBISHI CORPORATION
7.7 SIEMENS AG
7.8 IDEOL
7.9 FLOATING POWER PLANT A/S
7.10 KYOCERA CORPORATION
7.11 SEATWIRL AB
7.12 PRINCIPLE POWER INC.
7.13 CATERPILLAR INC.
7.14 VIKRAM SOLAR PVT.
7.15 LTD.
7.16 CIEL & TERRE INTERNATIONAL
7.17 YINGLI SOLAR
7.18 GENERAL ELECTRIC COMPANY
7.19 OTHER ACTIVE PLAYERS
Chapter 8: Global Floating Power Plant Market By Region
8.1 Overview
8.2. North America Floating Power Plant Market
8.2.1 Key Market Trends, Growth Factors and Opportunities
8.2.2 Top Key Companies
8.2.3 Historic and Forecasted Market Size by Segments
8.2.4 Historic and Forecasted Market Size By Source
8.2.4.1 Non-renewable
8.2.4.2 Gas Turbines
8.2.4.3 IC Engines
8.2.4.4 Renewable
8.2.4.5 Solar and Wind
8.2.5 Historic and Forecasted Market Size By Capacity,
8.2.5.1 Below 5.0 MW
8.2.5.2 0 MW–20 MW
8.2.5.3 0 MW–100 MW
8.2.5.4 0 MW–250 MW and Above 250 MW
8.2.6 Historic and Forecasted Market Size By Type
8.2.6.1 Ships
8.2.6.2 Barges and Others (Platforms
8.2.6.3 Etc.)
8.2.7 Historic and Forecast Market Size by Country
8.2.7.1 US
8.2.7.2 Canada
8.2.7.3 Mexico
8.3. Eastern Europe Floating Power Plant Market
8.3.1 Key Market Trends, Growth Factors and Opportunities
8.3.2 Top Key Companies
8.3.3 Historic and Forecasted Market Size by Segments
8.3.4 Historic and Forecasted Market Size By Source
8.3.4.1 Non-renewable
8.3.4.2 Gas Turbines
8.3.4.3 IC Engines
8.3.4.4 Renewable
8.3.4.5 Solar and Wind
8.3.5 Historic and Forecasted Market Size By Capacity,
8.3.5.1 Below 5.0 MW
8.3.5.2 0 MW–20 MW
8.3.5.3 0 MW–100 MW
8.3.5.4 0 MW–250 MW and Above 250 MW
8.3.6 Historic and Forecasted Market Size By Type
8.3.6.1 Ships
8.3.6.2 Barges and Others (Platforms
8.3.6.3 Etc.)
8.3.7 Historic and Forecast Market Size by Country
8.3.7.1 Russia
8.3.7.2 Bulgaria
8.3.7.3 The Czech Republic
8.3.7.4 Hungary
8.3.7.5 Poland
8.3.7.6 Romania
8.3.7.7 Rest of Eastern Europe
8.4. Western Europe Floating Power Plant Market
8.4.1 Key Market Trends, Growth Factors and Opportunities
8.4.2 Top Key Companies
8.4.3 Historic and Forecasted Market Size by Segments
8.4.4 Historic and Forecasted Market Size By Source
8.4.4.1 Non-renewable
8.4.4.2 Gas Turbines
8.4.4.3 IC Engines
8.4.4.4 Renewable
8.4.4.5 Solar and Wind
8.4.5 Historic and Forecasted Market Size By Capacity,
8.4.5.1 Below 5.0 MW
8.4.5.2 0 MW–20 MW
8.4.5.3 0 MW–100 MW
8.4.5.4 0 MW–250 MW and Above 250 MW
8.4.6 Historic and Forecasted Market Size By Type
8.4.6.1 Ships
8.4.6.2 Barges and Others (Platforms
8.4.6.3 Etc.)
8.4.7 Historic and Forecast Market Size by Country
8.4.7.1 Germany
8.4.7.2 UK
8.4.7.3 France
8.4.7.4 The Netherlands
8.4.7.5 Italy
8.4.7.6 Spain
8.4.7.7 Rest of Western Europe
8.5. Asia Pacific Floating Power Plant Market
8.5.1 Key Market Trends, Growth Factors and Opportunities
8.5.2 Top Key Companies
8.5.3 Historic and Forecasted Market Size by Segments
8.5.4 Historic and Forecasted Market Size By Source
8.5.4.1 Non-renewable
8.5.4.2 Gas Turbines
8.5.4.3 IC Engines
8.5.4.4 Renewable
8.5.4.5 Solar and Wind
8.5.5 Historic and Forecasted Market Size By Capacity,
8.5.5.1 Below 5.0 MW
8.5.5.2 0 MW–20 MW
8.5.5.3 0 MW–100 MW
8.5.5.4 0 MW–250 MW and Above 250 MW
8.5.6 Historic and Forecasted Market Size By Type
8.5.6.1 Ships
8.5.6.2 Barges and Others (Platforms
8.5.6.3 Etc.)
8.5.7 Historic and Forecast Market Size by Country
8.5.7.1 China
8.5.7.2 India
8.5.7.3 Japan
8.5.7.4 South Korea
8.5.7.5 Malaysia
8.5.7.6 Thailand
8.5.7.7 Vietnam
8.5.7.8 The Philippines
8.5.7.9 Australia
8.5.7.10 New Zealand
8.5.7.11 Rest of APAC
8.6. Middle East & Africa Floating Power Plant Market
8.6.1 Key Market Trends, Growth Factors and Opportunities
8.6.2 Top Key Companies
8.6.3 Historic and Forecasted Market Size by Segments
8.6.4 Historic and Forecasted Market Size By Source
8.6.4.1 Non-renewable
8.6.4.2 Gas Turbines
8.6.4.3 IC Engines
8.6.4.4 Renewable
8.6.4.5 Solar and Wind
8.6.5 Historic and Forecasted Market Size By Capacity,
8.6.5.1 Below 5.0 MW
8.6.5.2 0 MW–20 MW
8.6.5.3 0 MW–100 MW
8.6.5.4 0 MW–250 MW and Above 250 MW
8.6.6 Historic and Forecasted Market Size By Type
8.6.6.1 Ships
8.6.6.2 Barges and Others (Platforms
8.6.6.3 Etc.)
8.6.7 Historic and Forecast Market Size by Country
8.6.7.1 Turkiye
8.6.7.2 Bahrain
8.6.7.3 Kuwait
8.6.7.4 Saudi Arabia
8.6.7.5 Qatar
8.6.7.6 UAE
8.6.7.7 Israel
8.6.7.8 South Africa
8.7. South America Floating Power Plant Market
8.7.1 Key Market Trends, Growth Factors and Opportunities
8.7.2 Top Key Companies
8.7.3 Historic and Forecasted Market Size by Segments
8.7.4 Historic and Forecasted Market Size By Source
8.7.4.1 Non-renewable
8.7.4.2 Gas Turbines
8.7.4.3 IC Engines
8.7.4.4 Renewable
8.7.4.5 Solar and Wind
8.7.5 Historic and Forecasted Market Size By Capacity,
8.7.5.1 Below 5.0 MW
8.7.5.2 0 MW–20 MW
8.7.5.3 0 MW–100 MW
8.7.5.4 0 MW–250 MW and Above 250 MW
8.7.6 Historic and Forecasted Market Size By Type
8.7.6.1 Ships
8.7.6.2 Barges and Others (Platforms
8.7.6.3 Etc.)
8.7.7 Historic and Forecast Market Size by Country
8.7.7.1 Brazil
8.7.7.2 Argentina
8.7.7.3 Rest of SA
Chapter 9 Analyst Viewpoint and Conclusion
9.1 Recommendations and Concluding Analysis
9.2 Potential Market Strategies
Chapter 10 Research Methodology
10.1 Research Process
10.2 Primary Research
10.3 Secondary Research
|
Floating Power Plant Market |
|||
|
Base Year: |
2023 |
Forecast Period: |
2024-2032 |
|
Historical Data: |
2017 to 2023 |
Market Size in 2023: |
USD 1.34 Billion. |
|
Forecast Period 2024-32 CAGR: |
15.7% |
Market Size in 2032: |
USD 4.98 Billion |
|
Segments Covered: |
By Source |
|
|
|
By Capacity |
|
||
|
By Type |
|
||
|
By Region |
|
||
|
Key Market Drivers: |
|
||
|
Key Market Restraints: |
|
||
|
Key Opportunities: |
|
||
|
Companies Covered in the report: |
|
||


