


Controlled Environment Agriculture Market Synopsis
Controlled Environment Agriculture Market Size Was Valued at USD 99.8 Billion in 2024 and is Projected to Reach USD 221.83 Billion by 2032, Growing at a CAGR of 10.5% From 2025-2032.
Controlled Environment Agriculture (CEA) refers to an innovative and highly efficient approach to crop cultivation that takes place within enclosed, controlled environments such as greenhouses, vertical farms, or indoor facilities. The defining characteristic of CEA is the meticulous regulation and optimization of environmental factors like temperature, humidity, lighting, carbon dioxide levels, and nutrient delivery to create the ideal conditions for plant growth. This method contrasts with traditional open-field farming, where crops are subject to the unpredictable and often adverse effects of weather, pests, and other external variables.
CEA systems are designed to mimic and, in many cases, surpass the best possible natural growing conditions for plants, allowing for year-round production regardless of external climate conditions. This level of control enables growers to fine-tune the growth process, resulting in increased crop yields, faster growth rates, and higher-quality produce. Moreover, CEA techniques often require less water and fewer pesticides than conventional agriculture, making them more sustainable and environmentally friendly.
The CEA market has experienced remarkable growth in recent years due to several factors. First, the world's population is steadily increasing, leading to greater demands for fresh and nutritious food. Additionally, urbanization is on the rise, with more people living in cities and driving the need for locally sourced produce. CEA addresses both challenges by offering a means to cultivate crops in urban settings, reducing the carbon footprint associated with long-distance food transportation.

The Controlled Environment Agriculture Market Trend Analysis
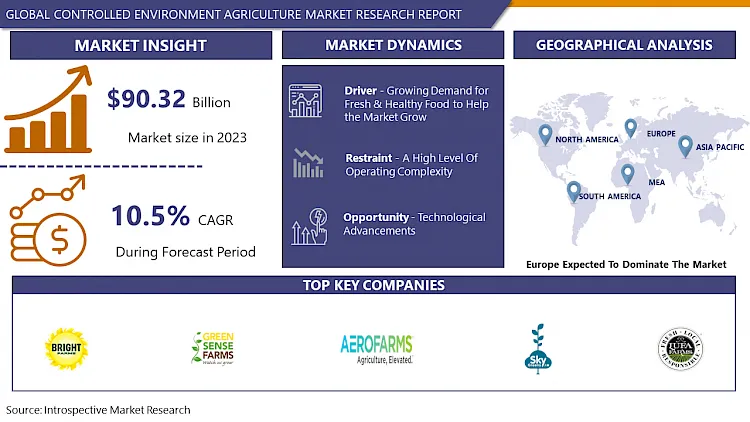
Growing Demand for Fresh & Healthy Food to Help the Market Grow
- The growing demand for fresh and healthy food is a significant driver of the Controlled Environment Agriculture (CEA) market. In recent years, consumers have become increasingly conscious of their dietary choices and are prioritizing fresh, nutritious produce in their diets. This shift in consumer preferences has created a strong market demand for crops that are free from pesticides, grown sustainably, and available year-round.
- CEA offers a compelling solution to meet this demand by providing a controlled and optimized environment for crop cultivation. It allows for the production of fruits, vegetables, and herbs that are not only free from harmful chemicals but also consistently high in quality and flavor. Moreover, CEA enables urban and local farming, reducing the time and distance between harvest and consumption, which further enhances the freshness of the produce.
- As health-conscious consumers seek out options that align with their well-being goals, the CEA market stands to benefit significantly. The ability to grow crops in a controlled environment not only ensures the absence of contaminants but also allows for the cultivation of specialty and exotic crops that might be challenging to grow in traditional open-field agriculture.
Technological Advancements
- Technological advancements represent a significant opportunity for the Controlled Environment Agriculture (CEA) market. Over the past few years, rapid progress in agricultural technology has transformed the way crops are grown within controlled environments such as greenhouses, vertical farms, and indoor facilities. These advancements are poised to drive the growth of the CEA sector in several crucial ways.
- Automation and precision technology have revolutionized crop management in controlled environments. Robotics and AI-driven systems can monitor and adjust factors like temperature, humidity, lighting, and nutrient levels with remarkable precision. This not only reduces the need for manual labor but also ensures optimal growing conditions, leading to higher crop yields and improved resource efficiency.
- Additionally, data analytics and sensor technologies are enabling data-driven decision-making in CEA. Real-time monitoring of plant health and environmental conditions allows growers to make proactive adjustments, resulting in better crop quality and reduced resource wastage. This data-driven approach also contributes to sustainable practices as it minimizes the use of water, energy, and nutrients.
Controlled Environment Agriculture Market Segment Analysis
Controlled Environment Agriculture Market segments cover the Crop Growing Method and Components. By hydroponics segment is Anticipated to Dominate the Market Over the Forecast period.
- The hydroponics growing method indeed holds a dominant position within the Controlled Environment Agriculture (CEA) market. Hydroponics is a soilless cultivation technique that involves growing plants in nutrient-rich water solutions, often with the support of inert mediums like perlite or coco coir. Several factors contribute to the prominence of hydroponics in the CEA landscape.
- Hydroponics offers unparalleled control over the growing environment. Growers can precisely manage nutrient levels, pH, temperature, and humidity, ensuring optimal conditions for plant growth. This level of control results in faster growth rates, increased crop yields, and the ability to grow crops year-round, irrespective of external weather conditions. Such advantages make hydroponics an attractive choice for CEA operations aiming to maximize productivity.
- Hydroponics is inherently resource-efficient. It typically uses less water than traditional soil-based agriculture, making it a sustainable choice in regions with water scarcity or where water conservation is a priority. Additionally, the controlled environment of hydroponic systems reduces the need for pesticides and herbicides, aligning with the growing consumer demand for chemical-free and organic produce.
Controlled Environment Agriculture Market Regional Analysis:
Europe is dominating the Market Over the Forecast Period.
- Europe region is expected to hold the largest market share with revenue growth. Rapid technological advancement, urbanization, and high demand for vegetables and fruits are some factors that made Europe the largest player. Moreover, the European commercial greenhouse is considered the most energy-intensive sector in agriculture. Europe was the first to enforce advanced practices in greenhouses, especially in countries like Spain, Italy, and Netherlands, where big areas are under greenhouse cultivation. Also, government initiatives for promoting greenhouse farming are boosting the growth of commercial greenhouses. Some of the leading greenhouse-producing areas in Europe are Spain with around 46,000 hectares, Italy with 25,000 hectares, France with 9,500 hectares, and Greece with 3,800 hectares.
Controlled Environment Agriculture Market Key Player
- Illumitex Inc. (United States)
- Agritecture (United States)
- Urban Crops (Belgium)
- AgroTech Farm (Singapore)
- Aero Farms
- Jingpeng
- Infinite Harvest
- Mirai
- Lufa Farms
- Green Sense Farms
- Metro Farms
- Plenty (Bright Farms)
- Greenland
- Scafil
- Sky Greens
- Idea Protected Horticulture
- Metropolis Farms
- Gotham Greens
- Garden Fresh Farms
Key Industry Developments in the Controlled Environment Agriculture Marke
- In May 2024, Saffron Tech introduced a cutting-edge facility incorporating Controlled Environment Agriculture methods and an autonomous cultivation system for efficient saffron farming. This innovation enables the integration of AI logic to enhance productivity and quality. The advancement is ideal for expanding saffron-related products in beauty, wellness, and nutraceutical industries due to the growing demand for high-quality saffron.
- In March 2024, Meister Media Worldwide, publisher of Greenhouse Grower, launched CEAg World, a new global brand dedicated to advancing food grown in controlled environments. This includes various industry segments such as greenhouses, hoop houses, high tunnels, vertical farms, etc. CEAg World's initial focus is on greenhouse-grown produce in the U.S. and Canada, under the brand CEAg World Greenhouse Produce.
|
Controlled Environment Agriculture Market |
|||
|
Base Year: |
2024 |
Forecast Period: |
2025-2032 |
|
Historical Data: |
2018 to 2024 |
Market Size in 2024: |
USD 99.8 Bn. |
|
Forecast Period 2025-32 CAGR: |
10.5% |
Market Size in 2032: |
USD 221.83 Bn. |
|
Segments Covered: |
By Crop |
|
|
|
By Growing Methods |
|
||
|
By Components |
|
||
|
By Region |
|
||
|
Key Market Drivers: |
|
||
|
Key Market Restraints: |
|
||
|
Key Opportunities: |
|
||
|
Companies Covered in the Report: |
|
||
Chapter 1: Introduction
1.1 Scope and Coverage
Chapter 2:Executive Summary
Chapter 3: Market Landscape
3.1 Market Dynamics
3.1.1 Drivers
3.1.2 Restraints
3.1.3 Opportunities
3.1.4 Challenges
3.2 Market Trend Analysis
3.3 PESTLE Analysis
3.4 Porter's Five Forces Analysis
3.5 Industry Value Chain Analysis
3.6 Ecosystem
3.7 Regulatory Landscape
3.8 Price Trend Analysis
3.9 Patent Analysis
3.10 Technology Evolution
3.11 Investment Pockets
3.12 Import-Export Analysis
Chapter 4: Controlled Environment Agriculture Market by Crop (2018-2032)
4.1 Controlled Environment Agriculture Market Snapshot and Growth Engine
4.2 Market Overview
4.3 Leafy Greens
4.3.1 Introduction and Market Overview
4.3.2 Historic and Forecasted Market Size in Value USD and Volume Units
4.3.3 Key Market Trends, Growth Factors, and Opportunities
4.3.4 Geographic Segmentation Analysis
4.4 Tomato
4.5 Strawberries
4.6 Cucumber
4.7 Cannabis
4.8 Others
Chapter 5: Controlled Environment Agriculture Market by Growing Methods (2018-2032)
5.1 Controlled Environment Agriculture Market Snapshot and Growth Engine
5.2 Market Overview
5.3 Hydroponics
5.3.1 Introduction and Market Overview
5.3.2 Historic and Forecasted Market Size in Value USD and Volume Units
5.3.3 Key Market Trends, Growth Factors, and Opportunities
5.3.4 Geographic Segmentation Analysis
5.4 Aquaponics
5.5 Aeroponics
5.6 Others.
Chapter 6: Controlled Environment Agriculture Market by Components (2018-2032)
6.1 Controlled Environment Agriculture Market Snapshot and Growth Engine
6.2 Market Overview
6.3 Lighting
6.3.1 Introduction and Market Overview
6.3.2 Historic and Forecasted Market Size in Value USD and Volume Units
6.3.3 Key Market Trends, Growth Factors, and Opportunities
6.3.4 Geographic Segmentation Analysis
6.4 Growing Media
6.5 Nutrients
6.6 Others
Chapter 7: Company Profiles and Competitive Analysis
7.1 Competitive Landscape
7.1.1 Competitive Benchmarking
7.1.2 Controlled Environment Agriculture Market Share by Manufacturer (2024)
7.1.3 Industry BCG Matrix
7.1.4 Heat Map Analysis
7.1.5 Mergers and Acquisitions
7.2 ACCLIMA INCAQUACHECK PVT. LTD
7.2.1 Company Overview
7.2.2 Key Executives
7.2.3 Company Snapshot
7.2.4 Role of the Company in the Market
7.2.5 Sustainability and Social Responsibility
7.2.6 Operating Business Segments
7.2.7 Product Portfolio
7.2.8 Business Performance
7.2.9 Key Strategic Moves and Recent Developments
7.2.10 SWOT Analysis
7.3 CAMPBELL SCIENTIFIC
7.4 DAVIS INSTRUMENTS
7.5 DECAGON DEVICES INCDELTA-T DEVICES LTDHUSQVARNA
7.6 IRROMETER COMPANY INCMETER GROUP
7.7 PARROT
7.8 SENTEK PVT. LTDSTEVENS WATER MONITORING SYSTEM INCSTREAT INSTRUMENTS
7.9 TORO COMPANY
7.10
Chapter 8: Global Controlled Environment Agriculture Market By Region
8.1 Overview
8.2. North America Controlled Environment Agriculture Market
8.2.1 Key Market Trends, Growth Factors and Opportunities
8.2.2 Top Key Companies
8.2.3 Historic and Forecasted Market Size by Segments
8.2.4 Historic and Forecasted Market Size by Crop
8.2.4.1 Leafy Greens
8.2.4.2 Tomato
8.2.4.3 Strawberries
8.2.4.4 Cucumber
8.2.4.5 Cannabis
8.2.4.6 Others
8.2.5 Historic and Forecasted Market Size by Growing Methods
8.2.5.1 Hydroponics
8.2.5.2 Aquaponics
8.2.5.3 Aeroponics
8.2.5.4 Others.
8.2.6 Historic and Forecasted Market Size by Components
8.2.6.1 Lighting
8.2.6.2 Growing Media
8.2.6.3 Nutrients
8.2.6.4 Others
8.2.7 Historic and Forecast Market Size by Country
8.2.7.1 US
8.2.7.2 Canada
8.2.7.3 Mexico
8.3. Eastern Europe Controlled Environment Agriculture Market
8.3.1 Key Market Trends, Growth Factors and Opportunities
8.3.2 Top Key Companies
8.3.3 Historic and Forecasted Market Size by Segments
8.3.4 Historic and Forecasted Market Size by Crop
8.3.4.1 Leafy Greens
8.3.4.2 Tomato
8.3.4.3 Strawberries
8.3.4.4 Cucumber
8.3.4.5 Cannabis
8.3.4.6 Others
8.3.5 Historic and Forecasted Market Size by Growing Methods
8.3.5.1 Hydroponics
8.3.5.2 Aquaponics
8.3.5.3 Aeroponics
8.3.5.4 Others.
8.3.6 Historic and Forecasted Market Size by Components
8.3.6.1 Lighting
8.3.6.2 Growing Media
8.3.6.3 Nutrients
8.3.6.4 Others
8.3.7 Historic and Forecast Market Size by Country
8.3.7.1 Russia
8.3.7.2 Bulgaria
8.3.7.3 The Czech Republic
8.3.7.4 Hungary
8.3.7.5 Poland
8.3.7.6 Romania
8.3.7.7 Rest of Eastern Europe
8.4. Western Europe Controlled Environment Agriculture Market
8.4.1 Key Market Trends, Growth Factors and Opportunities
8.4.2 Top Key Companies
8.4.3 Historic and Forecasted Market Size by Segments
8.4.4 Historic and Forecasted Market Size by Crop
8.4.4.1 Leafy Greens
8.4.4.2 Tomato
8.4.4.3 Strawberries
8.4.4.4 Cucumber
8.4.4.5 Cannabis
8.4.4.6 Others
8.4.5 Historic and Forecasted Market Size by Growing Methods
8.4.5.1 Hydroponics
8.4.5.2 Aquaponics
8.4.5.3 Aeroponics
8.4.5.4 Others.
8.4.6 Historic and Forecasted Market Size by Components
8.4.6.1 Lighting
8.4.6.2 Growing Media
8.4.6.3 Nutrients
8.4.6.4 Others
8.4.7 Historic and Forecast Market Size by Country
8.4.7.1 Germany
8.4.7.2 UK
8.4.7.3 France
8.4.7.4 The Netherlands
8.4.7.5 Italy
8.4.7.6 Spain
8.4.7.7 Rest of Western Europe
8.5. Asia Pacific Controlled Environment Agriculture Market
8.5.1 Key Market Trends, Growth Factors and Opportunities
8.5.2 Top Key Companies
8.5.3 Historic and Forecasted Market Size by Segments
8.5.4 Historic and Forecasted Market Size by Crop
8.5.4.1 Leafy Greens
8.5.4.2 Tomato
8.5.4.3 Strawberries
8.5.4.4 Cucumber
8.5.4.5 Cannabis
8.5.4.6 Others
8.5.5 Historic and Forecasted Market Size by Growing Methods
8.5.5.1 Hydroponics
8.5.5.2 Aquaponics
8.5.5.3 Aeroponics
8.5.5.4 Others.
8.5.6 Historic and Forecasted Market Size by Components
8.5.6.1 Lighting
8.5.6.2 Growing Media
8.5.6.3 Nutrients
8.5.6.4 Others
8.5.7 Historic and Forecast Market Size by Country
8.5.7.1 China
8.5.7.2 India
8.5.7.3 Japan
8.5.7.4 South Korea
8.5.7.5 Malaysia
8.5.7.6 Thailand
8.5.7.7 Vietnam
8.5.7.8 The Philippines
8.5.7.9 Australia
8.5.7.10 New Zealand
8.5.7.11 Rest of APAC
8.6. Middle East & Africa Controlled Environment Agriculture Market
8.6.1 Key Market Trends, Growth Factors and Opportunities
8.6.2 Top Key Companies
8.6.3 Historic and Forecasted Market Size by Segments
8.6.4 Historic and Forecasted Market Size by Crop
8.6.4.1 Leafy Greens
8.6.4.2 Tomato
8.6.4.3 Strawberries
8.6.4.4 Cucumber
8.6.4.5 Cannabis
8.6.4.6 Others
8.6.5 Historic and Forecasted Market Size by Growing Methods
8.6.5.1 Hydroponics
8.6.5.2 Aquaponics
8.6.5.3 Aeroponics
8.6.5.4 Others.
8.6.6 Historic and Forecasted Market Size by Components
8.6.6.1 Lighting
8.6.6.2 Growing Media
8.6.6.3 Nutrients
8.6.6.4 Others
8.6.7 Historic and Forecast Market Size by Country
8.6.7.1 Turkiye
8.6.7.2 Bahrain
8.6.7.3 Kuwait
8.6.7.4 Saudi Arabia
8.6.7.5 Qatar
8.6.7.6 UAE
8.6.7.7 Israel
8.6.7.8 South Africa
8.7. South America Controlled Environment Agriculture Market
8.7.1 Key Market Trends, Growth Factors and Opportunities
8.7.2 Top Key Companies
8.7.3 Historic and Forecasted Market Size by Segments
8.7.4 Historic and Forecasted Market Size by Crop
8.7.4.1 Leafy Greens
8.7.4.2 Tomato
8.7.4.3 Strawberries
8.7.4.4 Cucumber
8.7.4.5 Cannabis
8.7.4.6 Others
8.7.5 Historic and Forecasted Market Size by Growing Methods
8.7.5.1 Hydroponics
8.7.5.2 Aquaponics
8.7.5.3 Aeroponics
8.7.5.4 Others.
8.7.6 Historic and Forecasted Market Size by Components
8.7.6.1 Lighting
8.7.6.2 Growing Media
8.7.6.3 Nutrients
8.7.6.4 Others
8.7.7 Historic and Forecast Market Size by Country
8.7.7.1 Brazil
8.7.7.2 Argentina
8.7.7.3 Rest of SA
Chapter 9 Analyst Viewpoint and Conclusion
9.1 Recommendations and Concluding Analysis
9.2 Potential Market Strategies
Chapter 10 Research Methodology
10.1 Research Process
10.2 Primary Research
10.3 Secondary Research
|
Controlled Environment Agriculture Market |
|||
|
Base Year: |
2024 |
Forecast Period: |
2025-2032 |
|
Historical Data: |
2018 to 2024 |
Market Size in 2024: |
USD 99.8 Bn. |
|
Forecast Period 2025-32 CAGR: |
10.5% |
Market Size in 2032: |
USD 221.83 Bn. |
|
Segments Covered: |
By Crop |
|
|
|
By Growing Methods |
|
||
|
By Components |
|
||
|
By Region |
|
||
|
Key Market Drivers: |
|
||
|
Key Market Restraints: |
|
||
|
Key Opportunities: |
|
||
|
Companies Covered in the Report: |
|
||


