


Connected Building Market Synopsis:
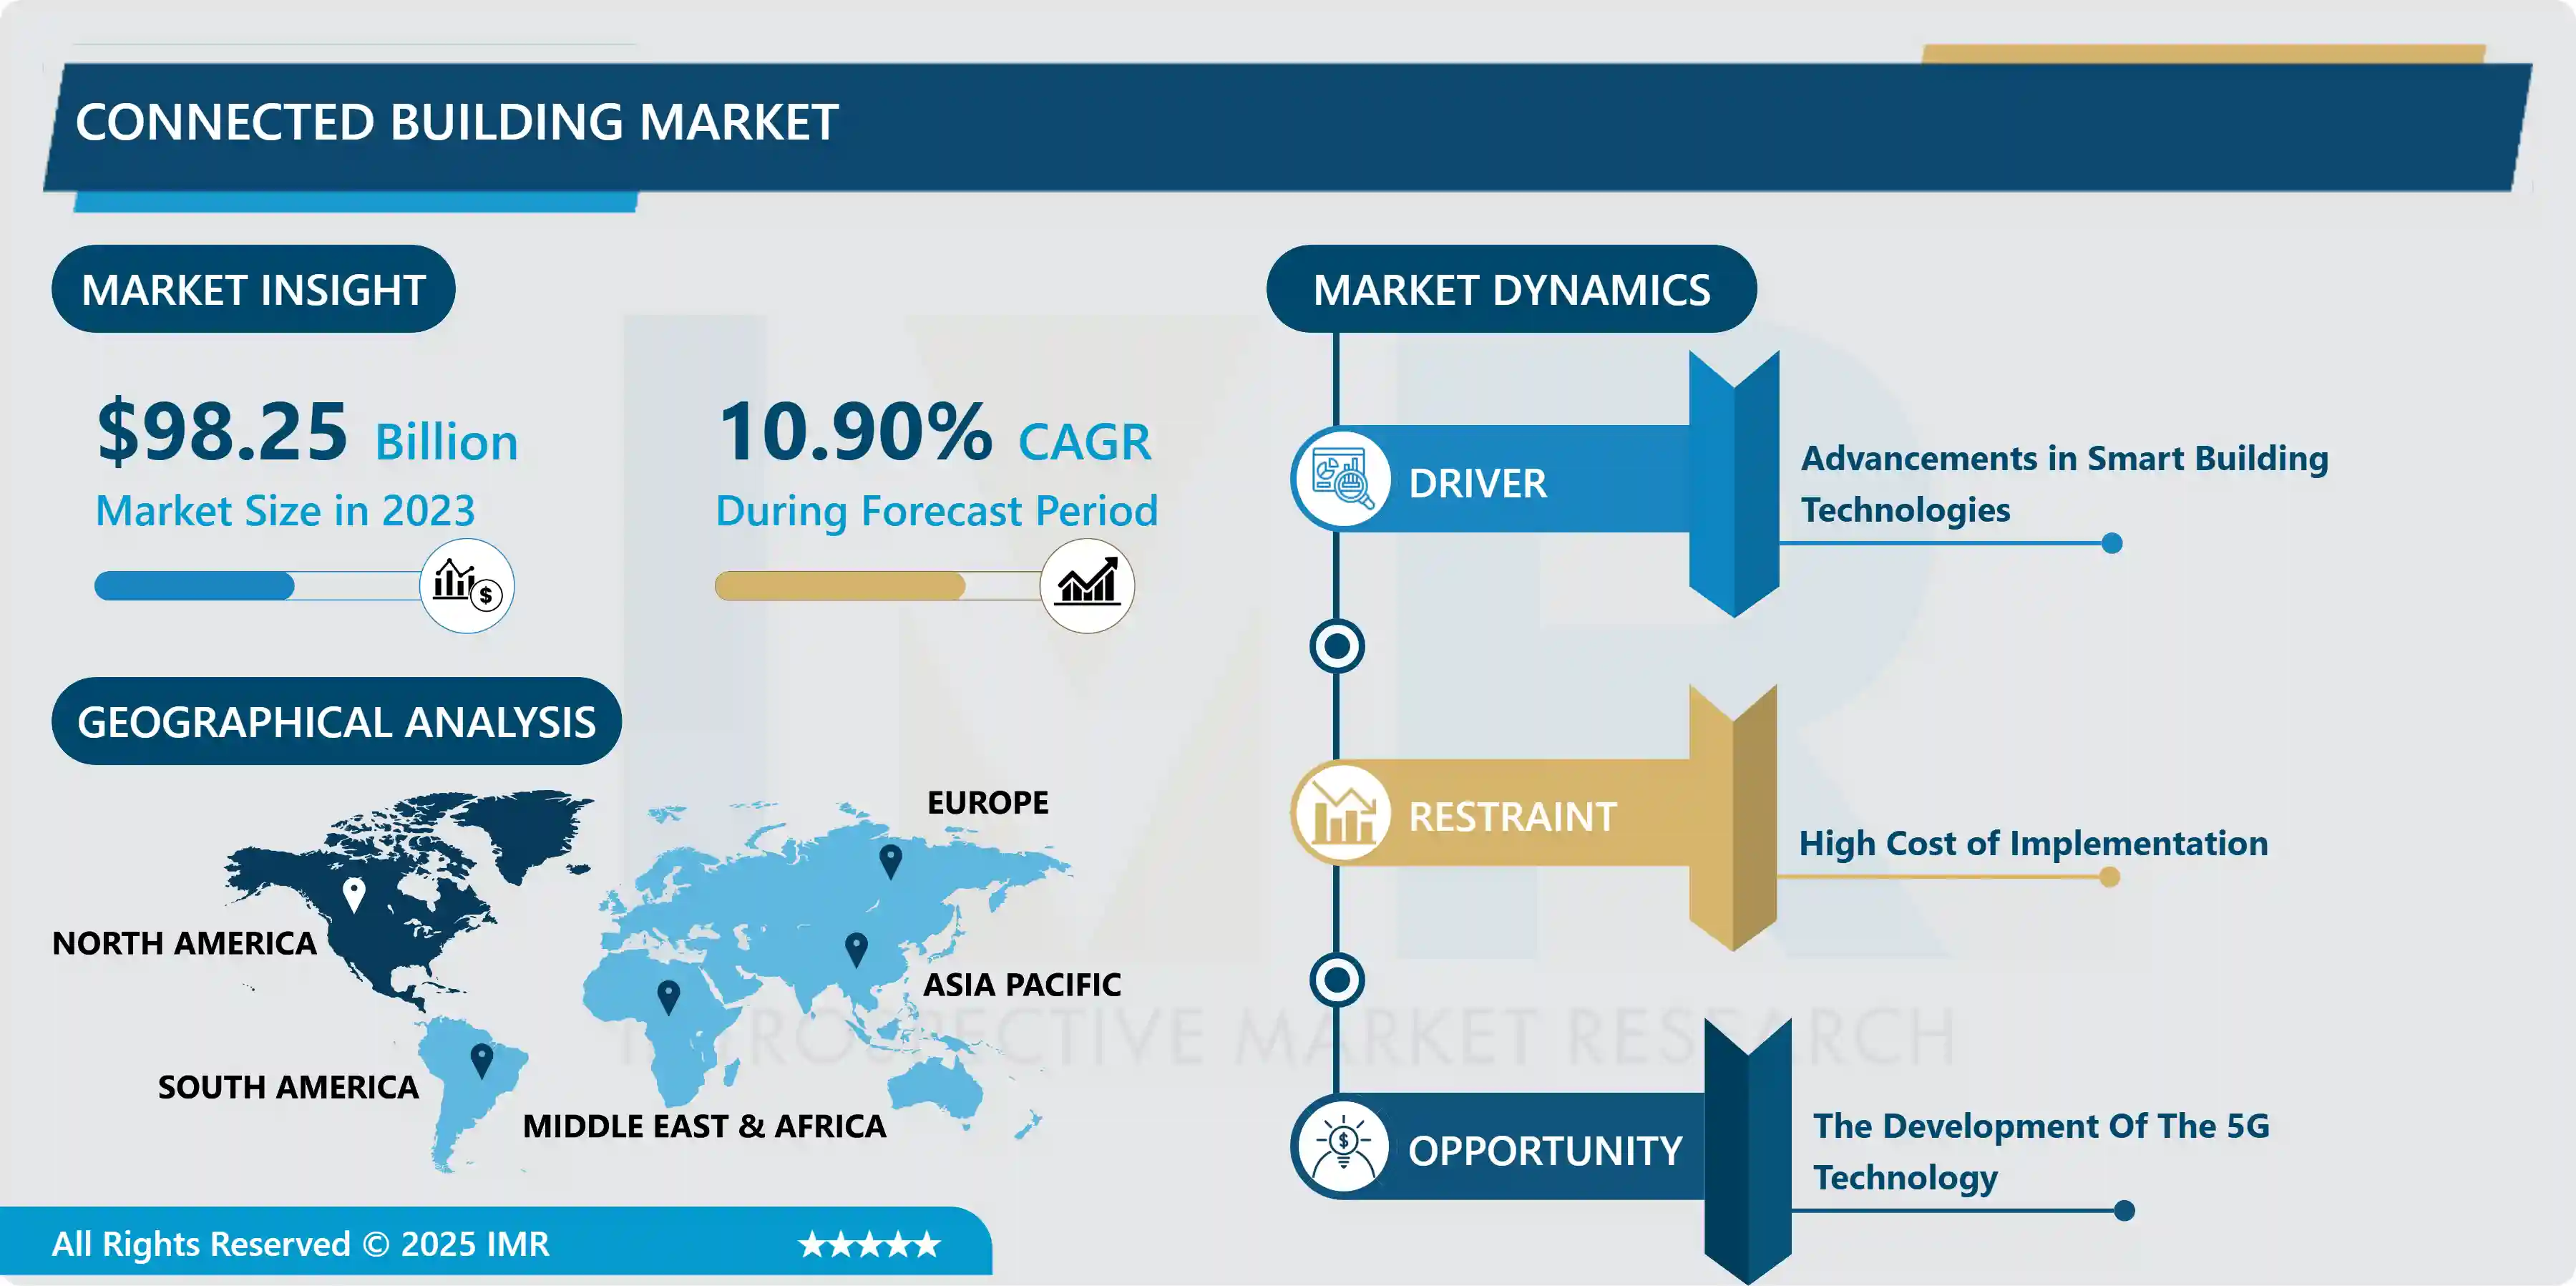
The Global Market for Connected Building Estimated at USD 98.25 Billion In the Year 2024, is Projected to Reach A Revised Size of USD 249.3 Billion by 2032, Growing at A CAGR of 10.90% Over the Forecast Period 2024-2032.
Global Connected Building Market is experiencing significant growth due to the integration of smart technologies in commercial and non-commercial buildings. These connected buildings enable people-based efficiency by connecting operations, finance, and sustainability teams, facilitating better building management and tenant engagement. Technology-based efficiency is achieved through advanced sensor and IoT-enabled devices that reduce energy consumption, leading to cost savings and improved sustainability.
Moreover, the market is driven by the demand for automation, cloud computing, the Internet of Things, data analytics, and big data, enabling unparalleled data access and centralized control of building systems. With the rise of 5G and IoT, commercial real estate is embracing holistic network capabilities to adapt to the digitally driven age. As a result, connectivity has become a vital differentiator for effective infrastructures, transforming the commercial real estate landscape. Businesses are increasingly seeking faster networks to leverage digital amenities and handle data-intensive applications, making network infrastructure a critical focus for maintaining competitiveness. This dynamic shift in commercial buildings is driven by a desire for greater operational productivity, reduced energy costs, and improved occupant comfort, making connected buildings the reality of smart operational demands.
The Connected Building Market Trend Analysis
Advancements in Smart Building Technologies
- The Connected Buildings Market is experiencing significant growth primarily due to the continuous advancements in smart building technologies. Key technologies driving this market include the Internet of Things (IoT), cloud computing, data analytics, artificial intelligence (AI), and automation. These innovations are revolutionizing the way buildings are designed, constructed, and operated, leading to a myriad of benefits. Integrating IoT devices within buildings allows for the creation of a vast network of interconnected sensors and devices. This connectivity enables real-time data collection and analysis, enabling building operators to monitor and control various systems remotely. This seamless integration not only improves operational efficiency but also facilitates predictive maintenance, reducing downtime and optimizing resource utilization.
- Furthermore, cloud computing plays a crucial role in the Connected Buildings Market. Cloud-based platforms provide scalable and flexible solutions for storing and processing large volumes of data generated by IoT devices. This data is leveraged through sophisticated data analytics and AI algorithms, offering valuable insights into building performance and occupant behavior. By understanding occupant preferences, building systems can be dynamically adjusted to enhance comfort and productivity while minimizing energy waste. Automation is another key driver that streamlines building operations and enhances efficiency. Automated systems can regulate lighting, heating, ventilation, air conditioning (HVAC), and other critical building functions based on occupancy patterns and real-time data, leading to significant energy savings and reduced operational costs.
The development of the 5G technology
- New and powerful capabilities for intelligent buildings are enhanced by the advent of 5G technology. It contributes significantly to the growth of loT-enabled devices by offering effective real-time operational and analytics capabilities. Due to loT-enabled devices in smart buildings, a significant volume of data is generated; nonetheless, 5G technology enables the speedy building of data transit, interpretation, and effective actions conducted inexpensively. The building Internet of Things (BloT) and Al-enabled technologies made possible by 5G greatly improve the user/occupant experience.
- Additionally, Demand for faster and more dependable digital infrastructure is rising quickly as the world becomes more dependent on technology. Through the provision of low-latency, high-speed data connections, 5G, the fifth generation of cellular network technology, is poised to completely alter how we interact with the outside world. Experiences in smart buildings are already beginning to be impacted by 5G. The backbone of an intelligent building is provided by 5G technology, which can decrease the time required for manual labor, enhance security, and raise occupant comfort. The capacity of 5G to offer greater data transmission speeds is one of its most important advantages.
- The idea of building management has experienced a paradigm shift as a result of the quick growth of technology and the emergence of IoT, which has made connected devices a reality. According to United Nations data, the percentage of people living in urban areas worldwide reached 55.7% as of 2019. In developed nations, the percentage of people living in urban regions is over 81%. In contrast, 51% of people in the developing world reside in urban regions, suggesting that there are more jobs in urban areas. Also, as the population grows, environmental issues become more pressing, supporting the notion that managing building infrastructure or operations is only one aspect of smart buildings. The user experience is improved by a smart building's attention to other factors like occupant comfort, health and safety, energy management, sustainability, and cost-effectiveness.
Segmentation Analysis of the Connected Building Market
Connected Building market segments cover the Platform, Service, and Application. By Application, the commercial segment is anticipated to dominate the Market over the Forecast period.
Due to an increased focus on intelligent construction by stakeholders including developers and owners of Commercial Real Estate (CRE) to save operating expenses. Governments worldwide are closely examining the CRE to make investments and greatly enhance building practices that save energy. The hotel, hospital, retail, corporate offices, and other segments make up the commercial segment. Healthcare is anticipated to take the lead due to the rising demand for cutting-edge systems to manage hospital operations.
The rapidly expanding use of intelligent building solutions to control safety and security, smart maintenance, energy consumption, and other factors is likely to be seen in the residential market. The demand for intelligent buildings in residential applications is anticipated to increase as a result of the rising demand for smart house lighting, HVAC monitoring, smart door locking systems, and smart meters.
For instance, In November 2022, Smart building solutions from ABB bring energy efficiencies to hospitals, all cities need well-functioning hospitals. They highlight a brand-new hospital in South Australia that provides essential assistance to its workers and patients by utilizing building automation solutions from ABB. The most intricate structures ever created are some of the modern medical institutions.
By automating essential building functions like lighting, shutter control, heating, ventilation, security, and energy management, systems like ABB's open-standard i-bus® KNX decrease staff workload. The new Calvary Adelaide Hospital, the biggest private hospital in South Australia, has received lighting management from ABB, a crucial building automation component. The most recent ABB i-bus KNX® smart building technology has been installed in the contemporary 12-story hospital. The hospital decided to manage and monitor all of the building's lighting using the ABB i-bus® KNX system. ABB's i-bus® KNX solution, which is based on the global KNX standard, offers intelligent and integrated building control for simpler lighting management as well as enhanced flexibility, security, economic efficiency, and convenience.
Regional Analysis of the Connected Building Market
North America is expected to dominate the Market over the Forecast period.
North America is at the forefront of technology thanks to significant investments in R&D. The introduction of cutting-edge smart building solutions, which use cutting-edge technologies like the Internet of Things (IoT), big data, deep learning, cloud computing, data analytics, and artificial intelligence (IT), to save energy, reduce operational outflows, and improve collective occupancy comfort, is what controls the growth factor in North America. Additionally, this is improved by adhering to the laws and standards set forth by the North American government.
According to Statista, The proportion of US households adding smart home technologies is expected to increase to over 30 million shortly. The most sought-after items by customers are linked cameras, followed by video doorbells, smart locks, smart speakers, connected lightbulbs, and connected lightbulbs.
Between 2018 and 2022, there to be a steady rise in the number of households in the smart home market in the US. In the United States, there are 39 million smart home users in 2018 and 57.55 million in 2022.
Moreover, Canada and the US have made significant contributions to technological advancement in this area. Building controls and system integration are two connected building concepts that US organizations are heavily funding. These methods enhance energy storage and efficiency to produce buildings that are healthier, safer, and more environmentally friendly. By lowering greenhouse gas emissions and improving the energy efficiency of federal buildings, the Canadian government is also supporting Canada's commitment to the environment and its resources, which is fueling the expansion of connected buildings in this area.
COVID-19 Impact Analysis on Connected Building Market
The demand for smart solutions for a safe workplace is anticipated to increase as business facilities are reopened for in-office work following the epidemic. After a lockdown, the property managers of commercial buildings and the corporate tenants are responsible for providing a secure work environment. They must therefore manage routine cleaning and sanitization, correct office ventilation, intelligent entrance control, temperature measurement devices, and space optimization for physical distance using smart technology. These elements should increase the demand for smart building systems.
Furthermore, in the future, tracking employee movement to stop the spread of illnesses will be possible thanks to smart technologies. Real-time data can be provided as intelligent technology interacts with systems and humans. The pandemic has increased prospects for intelligent building solutions to slow the spread of airborne infections. As a result, after the epidemic, the demand for modern infrastructure is anticipated to expand exponentially.
Top Key Players Covered in the Connected Building Market
- Rockwell Automation, Inc. (Us)
- Jacobs (Us)
- Tech Mahindra Limited (India)
- Infosys Limited (India)
- Capgemini Service Sas (France)
- Fujitsu (Japan)
- Bain & Company (Us)
- General Electric (Us)
- Constellation Research Inc. (Us)
- Enghouse Interactive (Us)
- Cbt Company (Us)
- Wipro Limited (India)
- Bosch Software Innovations Gmbh (Germany)
- Intel Corporation (Us)
- IBM Corporation (Us), And Other Major Players.
Key Industry Developments in the Connected Building Market
In March 2023, Johnson Controls, a prominent leader in smart building technologies, has sealed a game-changing acquisition deal with OpenBlue, a distinguished provider of cloud-based connected building solutions. This strategic move solidifies Johnson Controls' foothold in the market while significantly expanding its array of service offerings.
In April 2023, Microsoft has introduced a groundbreaking technology, "Azure Digital Twins," set to redefine the management of connected buildings. This innovative solution creates virtual replicas or simulations of physical spaces, empowering real-time monitoring, data analysis, and predictive maintenance.
|
Global Connected Building Market |
|||
|
Base Year: |
2023 |
Forecast Period: |
2024-2032 |
|
Historical Data: |
2017 to 2023 |
Market Size in 2023: |
USD 98.25 Bn. |
|
Forecast Period 2024-32 CAGR: |
10.90% |
Market Size in 2032: |
USD 249.3 Bn. |
|
Segments Covered: |
By Platform |
|
|
|
By Service |
|
||
|
By Application |
|
||
|
By Region |
|
||
|
Key Market Drivers: |
|
||
|
Key Market Restraints: |
|
||
|
Key Opportunities: |
|
||
|
Companies Covered in the Report: |
|
||
Chapter 1: Introduction
1.1 Scope and Coverage
Chapter 2:Executive Summary
Chapter 3: Market Landscape
3.1 Market Dynamics
3.1.1 Drivers
3.1.2 Restraints
3.1.3 Opportunities
3.1.4 Challenges
3.2 Market Trend Analysis
3.3 PESTLE Analysis
3.4 Porter's Five Forces Analysis
3.5 Industry Value Chain Analysis
3.6 Ecosystem
3.7 Regulatory Landscape
3.8 Price Trend Analysis
3.9 Patent Analysis
3.10 Technology Evolution
3.11 Investment Pockets
3.12 Import-Export Analysis
Chapter 4: Connected Building Market by Platform (2018-2032)
4.1 Connected Building Market Snapshot and Growth Engine
4.2 Market Overview
4.3 Device
4.3.1 Introduction and Market Overview
4.3.2 Historic and Forecasted Market Size in Value USD and Volume Units
4.3.3 Key Market Trends, Growth Factors, and Opportunities
4.3.4 Geographic Segmentation Analysis
4.4 Connectivity
4.5 Application Management
Chapter 5: Connected Building Market by Service (2018-2032)
5.1 Connected Building Market Snapshot and Growth Engine
5.2 Market Overview
5.3 Business Process Management
5.3.1 Introduction and Market Overview
5.3.2 Historic and Forecasted Market Size in Value USD and Volume Units
5.3.3 Key Market Trends, Growth Factors, and Opportunities
5.3.4 Geographic Segmentation Analysis
5.4 Customer Engagement
5.5 Maintenance
5.6 and Support
5.7 Deployment and Integration Services
Chapter 6: Connected Building Market by Application (2018-2032)
6.1 Connected Building Market Snapshot and Growth Engine
6.2 Market Overview
6.3 Commercial
6.3.1 Introduction and Market Overview
6.3.2 Historic and Forecasted Market Size in Value USD and Volume Units
6.3.3 Key Market Trends, Growth Factors, and Opportunities
6.3.4 Geographic Segmentation Analysis
6.4 Residential
Chapter 7: Company Profiles and Competitive Analysis
7.1 Competitive Landscape
7.1.1 Competitive Benchmarking
7.1.2 Connected Building Market Share by Manufacturer (2024)
7.1.3 Industry BCG Matrix
7.1.4 Heat Map Analysis
7.1.5 Mergers and Acquisitions
7.2 BASF SE
7.2.1 Company Overview
7.2.2 Key Executives
7.2.3 Company Snapshot
7.2.4 Role of the Company in the Market
7.2.5 Sustainability and Social Responsibility
7.2.6 Operating Business Segments
7.2.7 Product Portfolio
7.2.8 Business Performance
7.2.9 Key Strategic Moves and Recent Developments
7.2.10 SWOT Analysis
7.3 SMURFIT KAPPA GROUP
7.4 MONDI GROUP
7.5 ROCKTENN
7.6 STORA ENSO
7.7 CLEARWATER PAPER CORPORATION
7.8 AMCOR
7.9 NOVAMONT S.P.AKRUGER INCH.B. FULLER COMPANY
7.10 REYNOLDS GROUP HOLDING LIMITED
7.11 INTERNATIONAL CORP.
Chapter 8: Global Connected Building Market By Region
8.1 Overview
8.2. North America Connected Building Market
8.2.1 Key Market Trends, Growth Factors and Opportunities
8.2.2 Top Key Companies
8.2.3 Historic and Forecasted Market Size by Segments
8.2.4 Historic and Forecasted Market Size by Platform
8.2.4.1 Device
8.2.4.2 Connectivity
8.2.4.3 Application Management
8.2.5 Historic and Forecasted Market Size by Service
8.2.5.1 Business Process Management
8.2.5.2 Customer Engagement
8.2.5.3 Maintenance
8.2.5.4 and Support
8.2.5.5 Deployment and Integration Services
8.2.6 Historic and Forecasted Market Size by Application
8.2.6.1 Commercial
8.2.6.2 Residential
8.2.7 Historic and Forecast Market Size by Country
8.2.7.1 US
8.2.7.2 Canada
8.2.7.3 Mexico
8.3. Eastern Europe Connected Building Market
8.3.1 Key Market Trends, Growth Factors and Opportunities
8.3.2 Top Key Companies
8.3.3 Historic and Forecasted Market Size by Segments
8.3.4 Historic and Forecasted Market Size by Platform
8.3.4.1 Device
8.3.4.2 Connectivity
8.3.4.3 Application Management
8.3.5 Historic and Forecasted Market Size by Service
8.3.5.1 Business Process Management
8.3.5.2 Customer Engagement
8.3.5.3 Maintenance
8.3.5.4 and Support
8.3.5.5 Deployment and Integration Services
8.3.6 Historic and Forecasted Market Size by Application
8.3.6.1 Commercial
8.3.6.2 Residential
8.3.7 Historic and Forecast Market Size by Country
8.3.7.1 Russia
8.3.7.2 Bulgaria
8.3.7.3 The Czech Republic
8.3.7.4 Hungary
8.3.7.5 Poland
8.3.7.6 Romania
8.3.7.7 Rest of Eastern Europe
8.4. Western Europe Connected Building Market
8.4.1 Key Market Trends, Growth Factors and Opportunities
8.4.2 Top Key Companies
8.4.3 Historic and Forecasted Market Size by Segments
8.4.4 Historic and Forecasted Market Size by Platform
8.4.4.1 Device
8.4.4.2 Connectivity
8.4.4.3 Application Management
8.4.5 Historic and Forecasted Market Size by Service
8.4.5.1 Business Process Management
8.4.5.2 Customer Engagement
8.4.5.3 Maintenance
8.4.5.4 and Support
8.4.5.5 Deployment and Integration Services
8.4.6 Historic and Forecasted Market Size by Application
8.4.6.1 Commercial
8.4.6.2 Residential
8.4.7 Historic and Forecast Market Size by Country
8.4.7.1 Germany
8.4.7.2 UK
8.4.7.3 France
8.4.7.4 The Netherlands
8.4.7.5 Italy
8.4.7.6 Spain
8.4.7.7 Rest of Western Europe
8.5. Asia Pacific Connected Building Market
8.5.1 Key Market Trends, Growth Factors and Opportunities
8.5.2 Top Key Companies
8.5.3 Historic and Forecasted Market Size by Segments
8.5.4 Historic and Forecasted Market Size by Platform
8.5.4.1 Device
8.5.4.2 Connectivity
8.5.4.3 Application Management
8.5.5 Historic and Forecasted Market Size by Service
8.5.5.1 Business Process Management
8.5.5.2 Customer Engagement
8.5.5.3 Maintenance
8.5.5.4 and Support
8.5.5.5 Deployment and Integration Services
8.5.6 Historic and Forecasted Market Size by Application
8.5.6.1 Commercial
8.5.6.2 Residential
8.5.7 Historic and Forecast Market Size by Country
8.5.7.1 China
8.5.7.2 India
8.5.7.3 Japan
8.5.7.4 South Korea
8.5.7.5 Malaysia
8.5.7.6 Thailand
8.5.7.7 Vietnam
8.5.7.8 The Philippines
8.5.7.9 Australia
8.5.7.10 New Zealand
8.5.7.11 Rest of APAC
8.6. Middle East & Africa Connected Building Market
8.6.1 Key Market Trends, Growth Factors and Opportunities
8.6.2 Top Key Companies
8.6.3 Historic and Forecasted Market Size by Segments
8.6.4 Historic and Forecasted Market Size by Platform
8.6.4.1 Device
8.6.4.2 Connectivity
8.6.4.3 Application Management
8.6.5 Historic and Forecasted Market Size by Service
8.6.5.1 Business Process Management
8.6.5.2 Customer Engagement
8.6.5.3 Maintenance
8.6.5.4 and Support
8.6.5.5 Deployment and Integration Services
8.6.6 Historic and Forecasted Market Size by Application
8.6.6.1 Commercial
8.6.6.2 Residential
8.6.7 Historic and Forecast Market Size by Country
8.6.7.1 Turkiye
8.6.7.2 Bahrain
8.6.7.3 Kuwait
8.6.7.4 Saudi Arabia
8.6.7.5 Qatar
8.6.7.6 UAE
8.6.7.7 Israel
8.6.7.8 South Africa
8.7. South America Connected Building Market
8.7.1 Key Market Trends, Growth Factors and Opportunities
8.7.2 Top Key Companies
8.7.3 Historic and Forecasted Market Size by Segments
8.7.4 Historic and Forecasted Market Size by Platform
8.7.4.1 Device
8.7.4.2 Connectivity
8.7.4.3 Application Management
8.7.5 Historic and Forecasted Market Size by Service
8.7.5.1 Business Process Management
8.7.5.2 Customer Engagement
8.7.5.3 Maintenance
8.7.5.4 and Support
8.7.5.5 Deployment and Integration Services
8.7.6 Historic and Forecasted Market Size by Application
8.7.6.1 Commercial
8.7.6.2 Residential
8.7.7 Historic and Forecast Market Size by Country
8.7.7.1 Brazil
8.7.7.2 Argentina
8.7.7.3 Rest of SA
Chapter 9 Analyst Viewpoint and Conclusion
9.1 Recommendations and Concluding Analysis
9.2 Potential Market Strategies
Chapter 10 Research Methodology
10.1 Research Process
10.2 Primary Research
10.3 Secondary Research
|
Global Connected Building Market |
|||
|
Base Year: |
2023 |
Forecast Period: |
2024-2032 |
|
Historical Data: |
2017 to 2023 |
Market Size in 2023: |
USD 98.25 Bn. |
|
Forecast Period 2024-32 CAGR: |
10.90% |
Market Size in 2032: |
USD 249.3 Bn. |
|
Segments Covered: |
By Platform |
|
|
|
By Service |
|
||
|
By Application |
|
||
|
By Region |
|
||
|
Key Market Drivers: |
|
||
|
Key Market Restraints: |
|
||
|
Key Opportunities: |
|
||
|
Companies Covered in the Report: |
|
||


