


Water and Gas Valve Market Synopsis
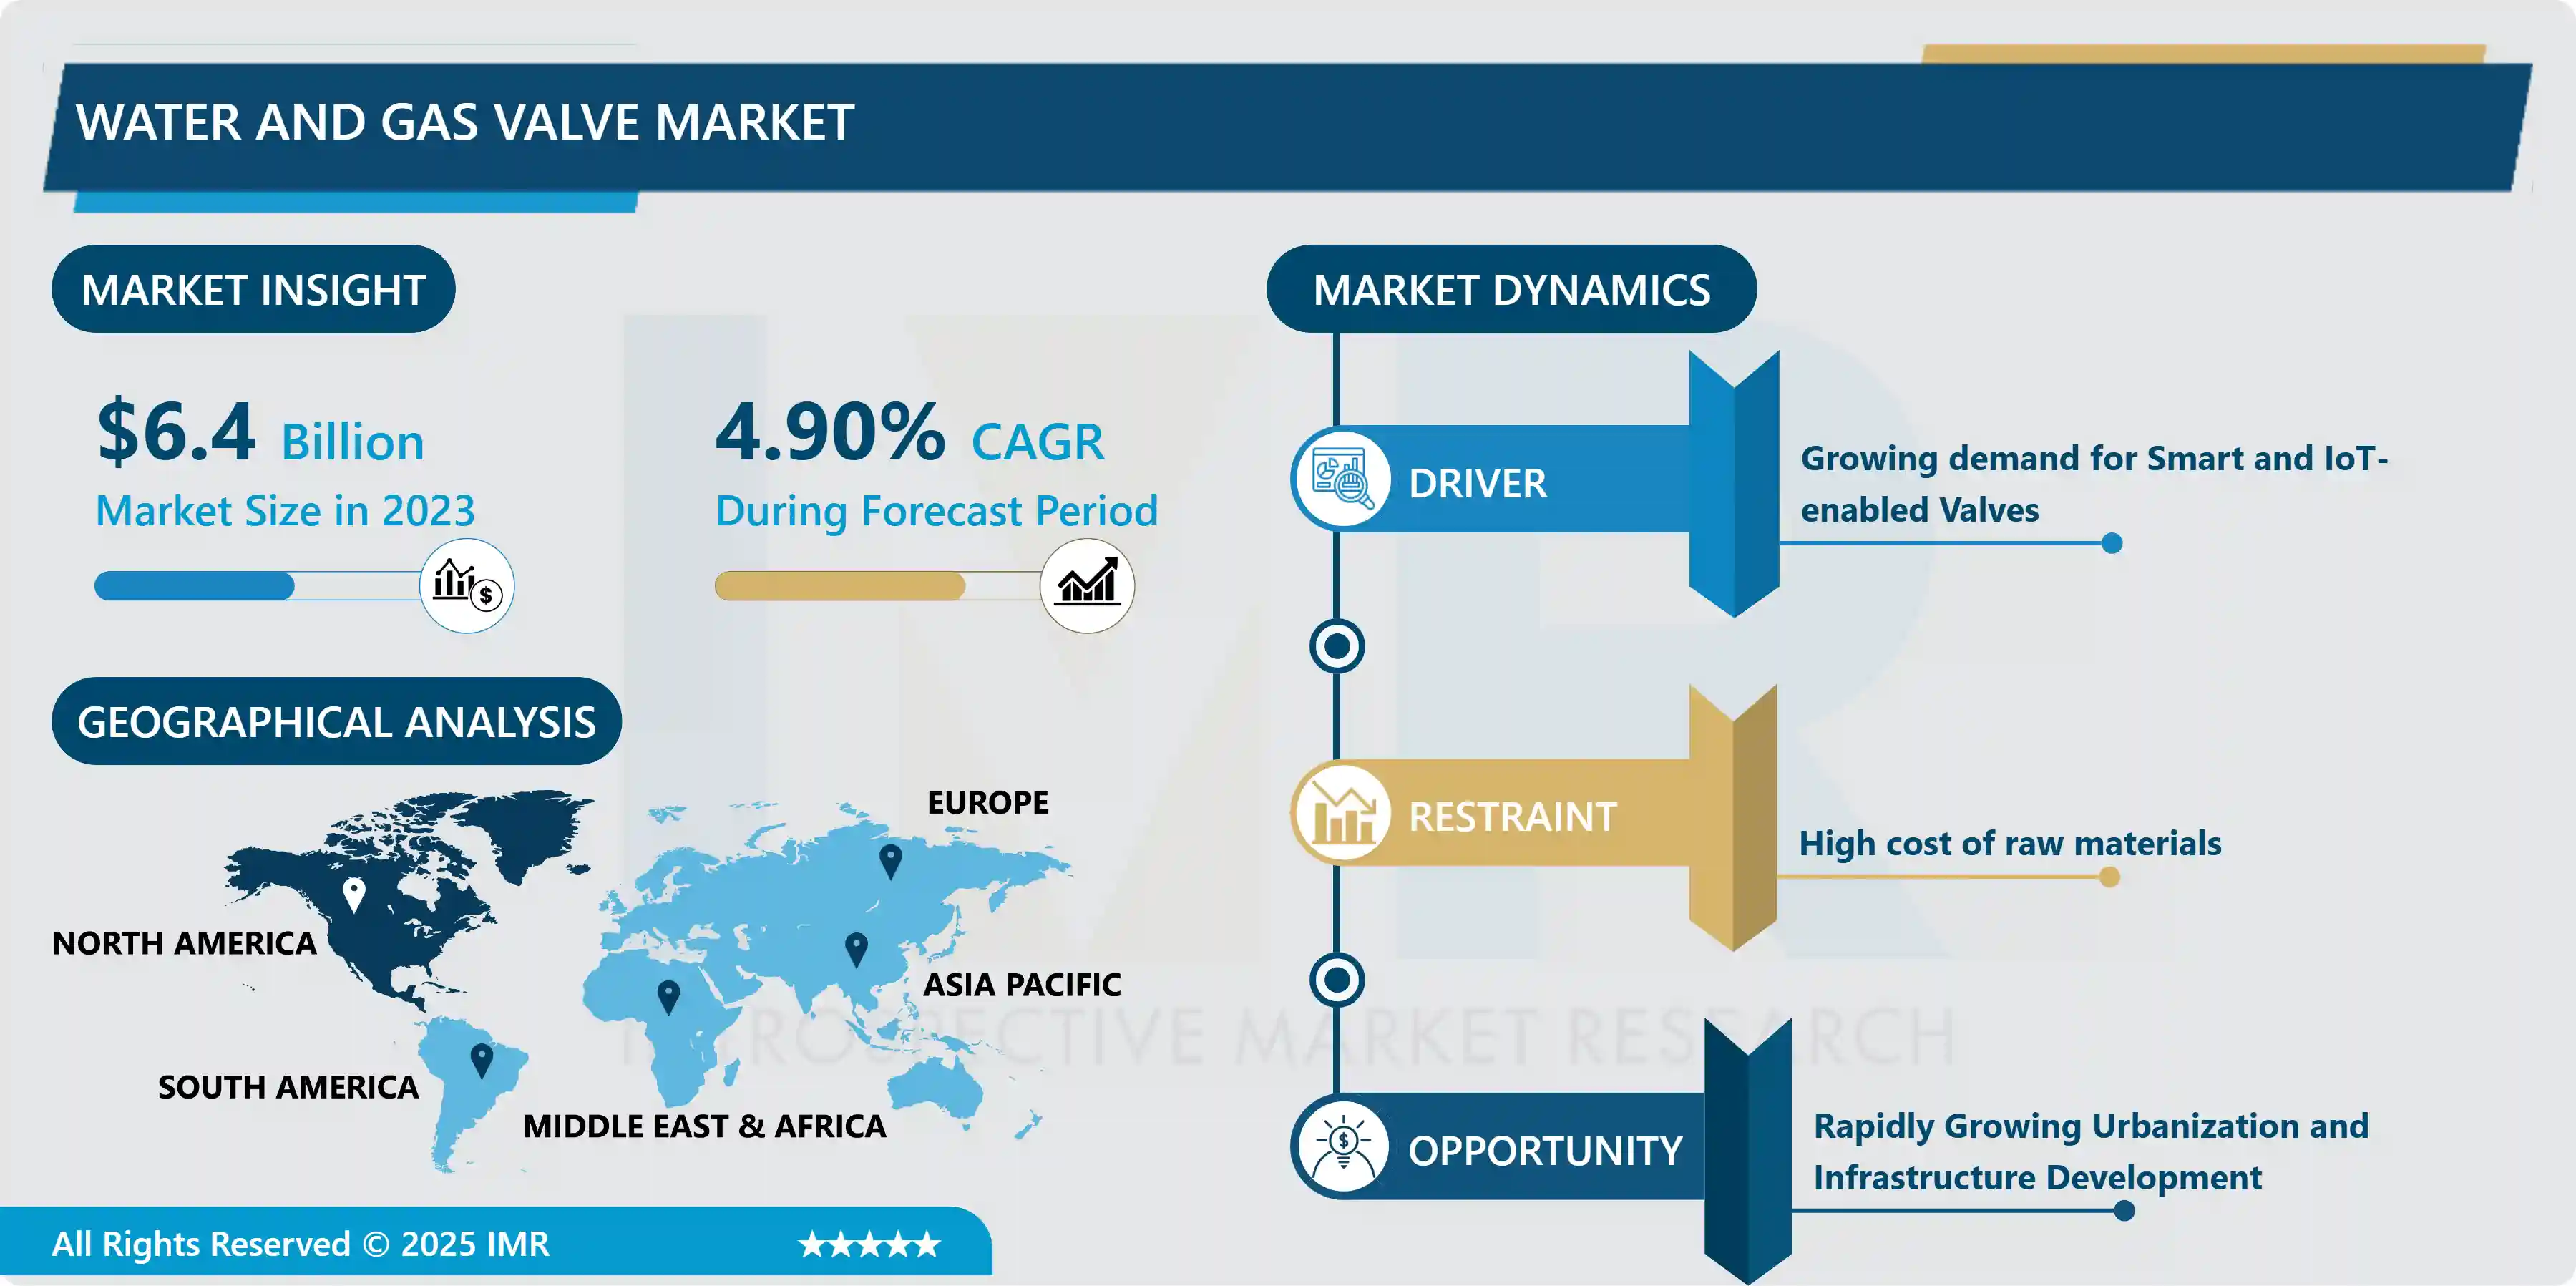
The water and Gas Valve Market Size Was Valued at USD 6.4 Billion in 2023 and is Projected to Reach USD 9.84 Billion by 2032, Growing at a CAGR of 4.9% From 2024-2032.
Water and gas valves serve as mechanisms that enable the regulation of water or gas movement in specific directions. A gas valve functions to manage the passage of gas within a system.
These valves are commonly positioned within the walls of pipelines that facilitate the transportation of water or gas. water valves find application in the management of water flow within pipes, whereas gas valves are instrumental in governing gas flow through pipelines. To prevent any dangerous reactions between water or gas and potentially harmful substances, it is essential to use these valves correctly.
Water valves and gas valves are used to control the flow of fluids of water or gas. ensure that these fluids can be directed, regulated, and shut off as needed. The basic principles of operation are similar, but there can be variations in design and materials to accommodate the specific characteristics of water and gas systems of valves.
A gate valve is a type of valve that controls flow by using a gate-like element to either allow or block the flow. It is used for things like water and gas and can open or close it by turning it in one direction. It has a single stem, so can operate it easily without taking off a cap. Its mechanism is good for situations because it operates easily. only need to turn it open or close, and it is a one-way valve.
 The Water and Gas Valve Market Trend Analysis
Growing demand for Smart and IoT-enabled Valves.
-
Traditional valves require manual operation, which can be time-consuming and may lead to inefficiencies or delays in responding to changes in demand or emergencies. Smart valves equipped with IoT capabilities can be controlled remotely using smartphones, tablets, or computers. This allows to open, close, or adjust valve settings from a distance, improving operational efficiency and reducing the need for on-site personnel.
- Smart valves are equipped with sensors that provide real-time data on various parameters such as flow rate, pressure, temperature, and valve position. This data can be used to monitor the performance of the valve, detect abnormality, and optimize its operation. For instance, in water distribution systems, the data collected from smart valves can help identify leaks, pressure drops, or unusual usage patterns. ?
- IoT-enabled valves can be integrated into larger automation systems. In a commercial building, smart valves are linked to a Building Management System (BMS) to automate the regulation of heating, cooling, and water supply based on occupancy patterns and environmental conditions. This automation leads to energy savings and improved comfort. ?In both residential and industrial, pipes carry water and gas. If these pipes break and leak, it can cause big problems like losing a lot of water or gas, it can be dangerous, and harm the environment.

According to Statista, the above graph shows the growing Industrial IoT revenue.
-
The growing Industrial Internet of Things revenue in the Water and Gas Valve Market can be attributed to the increasing adoption of smart water and gas management systems by utilities and industrial facilities.
Rapidly Growing Urbanization and Infrastructure Development
-
Urbanization leads to a higher population density, resulting in an increased demand for water supply and gas distribution networks. Valves play a crucial role in managing the flow of these resources, ensuring reliable supply to residential, commercial, and industrial areas.
- As cities expand, the need for efficient water treatment and wastewater management becomes more noticeable. Valves are used in various stages of water treatment processes to control the flow, pressure, and direction of water, helping to maintain water quality and meet regulatory standards.
- Growing urbanization that comes with a heightened awareness of environmental issues. Regulations regarding water and gas distribution systems are becoming tougher to ensure sustainability and safety. Valves that meet these regulatory requirements are in demand to help minimize leaks, reduce waste, and enhance system reliability.
- Cities undergoing rapid urbanization are embracing smart city technologies. These technologies involve the integration of sensors and automation systems into utility networks. Valves equipped with smart technology can enable remote monitoring, data collection, and real-time adjustments, enhancing the efficiency of water and gas distribution systems.
The Water and Gas Valve Market Segmentation Analysis
Water and Gas Valve Market segments cover the Type, End-user, and Application. By End-user, the oil and gas industry segment is Anticipated to Dominate the Market Over the Forecast period.
- The water and gas valve market includes products designed to control the flow of water and gas in various applications. Valves are crucial components in industries such as oil and gas, water and wastewater management, energy generation, and manufacturing, play a crucial role in regulating the flow, pressure, and direction of fluids (water and gas) within pipelines, machinery, and various systems.
- The oil and gas industry involves complex processes, including exploration, extraction, refining, and distribution of oil and gas resources. These processes require a substantial number of valves to control the flow and pressure of fluids at different stages in the industry.
- Valves are critical components in the oil and gas sector. They are used in wellheads, pipelines, refineries, storage tanks, and distribution networks. Efficient valve systems ensure safe and controlled operations, preventing leaks, spills, and accidents.
- The oil and gas industry uses valves for various applications, including shutting off or controlling the flow of crude oil, natural gas, and hydrocarbons. Valves are used to manage the flow of water, steam, and chemicals in different processes. Compliance with regulations o requires specialized valve systems that can handle harsh conditions and prevent emissions.
Water and Gas Valve Market Regional Analysis
Asia Pacific is Expected to Dominate the Market Over the Forecast Period.
- The Asia Pacific region has witnessed substantial industrial growth in sectors such as manufacturing, construction, technology, and more. Industries require significant amounts of water and energy to operate machinery, cool processes, and ensure efficient production. Gas valves play a crucial role in regulating the flow of gas for various industrial processes. As more industries establish themselves in urban centers, the demand for water and gas valves increases to support their operations.
- Rapid urbanization and industrialization, governments and private entities invest heavily in infrastructure projects. This includes the construction of water treatment plants, pipelines, gas distribution networks, and urban utilities. Water and gas valves are essential components of these systems, allowing for precise control, isolation, and regulation of fluid and gas flows.
- Urbanization comes from the integration of modern technologies into infrastructure systems. Smart city initiatives involve the use of sensors and data analytics to optimize the distribution and management of resources like water and gas. These advanced systems often rely on valve technologies to ensure efficient operation and minimal wastage. ?
- Concerns about environmental sustainability grow, there is an emphasis on efficient resource utilization. Water scarcity issues are prevalent in many parts of the Asia Pacific region, driving the need for better water management through effective valve systems. regulations to reduce gas emissions and promote cleaner energy sources drive the demand for gas valves that can help control and monitor gas distribution.
Water and Gas Valve Market Top Key Players:
- Flowserve Corporation (India)
- Larsen & Toubro (India)
- DBV Valve (China)
- Kirloskar Brothers Limited (India)
- VIP Valves (India)
- Pentair Valve (UK)
- Hawle Valves (India)
- XHVAL (China)
- BEL Valves (UK)
- Fluidline Valves (India)
- JC Valves (UAE)
- Petrol Valves (Italy)
- Valvitalia (Italy)
- Neway Valve (China)
- Walworth (US)
- Emerson (US)
- ALFA LAVAL (Sweden)
- AVK Holding AS(Denmark)
- CIRCOR International (US)
- SUFA Technology Industry (China)
- Crane (US)
- Curtiss-Wright Corporation (US)
- Yuanda Valve (China)
- Danfoss AS (Denmark)
- EG Valves (China)
- Sanhua Valve (China)
- DXP Enterprises (US) and Other Major Player.
Key Industry Developments in the Water and Gas Valve Market
- In May 2024, Viega expanded its valve portfolio, launching 21 new valves across the ProPress, MegaPress, and PureFlow systems. This addition includes strainers, swing check valves, hydronic balancing, and brass ball valves, designed to reduce installation time. "This expanded offering broadens the industries we can serve and allows our clients to specify Viega products for any project," said Director of Engineering Services, Jason McKinnon. Viega now offers the most complete press portfolio on the market.
- In November 2023, Flowserve Corporation launched the Worcester Cryogenic series, featuring reliable quarter-turn floating ball valves for LNG, hydrogen, and industrial gas applications. The series includes two configurations: a three-piece design (CF44 series) and a flanged option (CF51/CF52 series). Key features are a high-strength stem and an upgraded live-loaded stem seal, ensuring superior control over fugitive emissions. This new series exemplifies Flowserve’s commitment to delivering high-performance solutions for cryogenic and industrial gas industries.
|
Water and Gas Valve Market |
|||
|
Base Year: |
2023 |
Forecast Period: |
2024-2032 |
|
Historical Data: |
2017 to 2023 |
Market Size in 2023: |
USD 6.4 Bn. |
|
Forecast Period 2024-32 CAGR: |
4.9% |
Market Size in 2032: |
USD 9.84 Bn. |
|
Segments Covered: |
By Type |
|
|
|
By End-user |
|
||
|
By Application |
|
||
|
By Region |
|
||
|
Key Market Drivers: |
|
||
|
Key Market Restraints: |
|
||
|
Key Opportunities: |
|
||
|
Companies Covered in the Report: |
|
||
Chapter 1: Introduction
1.1 Scope and Coverage
Chapter 2:Executive Summary
Chapter 3: Market Landscape
3.1 Market Dynamics
3.1.1 Drivers
3.1.2 Restraints
3.1.3 Opportunities
3.1.4 Challenges
3.2 Market Trend Analysis
3.3 PESTLE Analysis
3.4 Porter's Five Forces Analysis
3.5 Industry Value Chain Analysis
3.6 Ecosystem
3.7 Regulatory Landscape
3.8 Price Trend Analysis
3.9 Patent Analysis
3.10 Technology Evolution
3.11 Investment Pockets
3.12 Import-Export Analysis
Chapter 4: Water and Gas Valve Market by Type (2018-2032)
4.1 Water and Gas Valve Market Snapshot and Growth Engine
4.2 Market Overview
4.3 Ball Valves
4.3.1 Introduction and Market Overview
4.3.2 Historic and Forecasted Market Size in Value USD and Volume Units
4.3.3 Key Market Trends, Growth Factors, and Opportunities
4.3.4 Geographic Segmentation Analysis
4.4 Gate Valves
4.5 Butterfly Valves
4.6 Mixing Valves
4.7 Multi-Turn Valves
Chapter 5: Water and Gas Valve Market by End-user (2018-2032)
5.1 Water and Gas Valve Market Snapshot and Growth Engine
5.2 Market Overview
5.3 Oil and Gas Industry
5.3.1 Introduction and Market Overview
5.3.2 Historic and Forecasted Market Size in Value USD and Volume Units
5.3.3 Key Market Trends, Growth Factors, and Opportunities
5.3.4 Geographic Segmentation Analysis
5.4 Water and Wastewater Management
5.5 Chemical Industry
5.6 Power Generation
5.7 HAVC
5.8 Construction
Chapter 6: Water and Gas Valve Market by Application (2018-2032)
6.1 Water and Gas Valve Market Snapshot and Growth Engine
6.2 Market Overview
6.3 Residential
6.3.1 Introduction and Market Overview
6.3.2 Historic and Forecasted Market Size in Value USD and Volume Units
6.3.3 Key Market Trends, Growth Factors, and Opportunities
6.3.4 Geographic Segmentation Analysis
6.4 Commercial
6.5 Industrial
Chapter 7: Company Profiles and Competitive Analysis
7.1 Competitive Landscape
7.1.1 Competitive Benchmarking
7.1.2 Water and Gas Valve Market Share by Manufacturer (2024)
7.1.3 Industry BCG Matrix
7.1.4 Heat Map Analysis
7.1.5 Mergers and Acquisitions
7.2 L'ORÉAL (FRANCE)
7.2.1 Company Overview
7.2.2 Key Executives
7.2.3 Company Snapshot
7.2.4 Role of the Company in the Market
7.2.5 Sustainability and Social Responsibility
7.2.6 Operating Business Segments
7.2.7 Product Portfolio
7.2.8 Business Performance
7.2.9 Key Strategic Moves and Recent Developments
7.2.10 SWOT Analysis
7.3 ESTÉE LAUDER COMPANIES INC. (UNITED STATES)
7.4 SHISEIDO COLTD. (JAPAN)
7.5 JOHNSON & JOHNSON (US)
7.6 PROCTER & GAMBLE (US)
7.7 UNILEVER (UNITED KINGDOM/NETHERLANDS)
7.8 COTY INC. (US)
7.9 REVLON INC. (US)
7.10 AMOREPACIFIC CORPORATION (SOUTH KOREA)
7.11 KAO CORPORATION (JAPAN)
7.12 AVON PRODUCTS INC. (UNITED KINGDOM)
7.13 BEIERSDORF AG (GERMANY)
7.14 MARY KAY INC. (US)
7.15 COLGATE-PALMOLIVE COMPANY (US)
7.16 ESTÉE LAUDER COMPANIES (US)
7.17 NU SKIN ENTERPRISES INC. (US)
7.18 CLARINS GROUP (FRANCE)
7.19 ELIZABETH ARDEN INC. (US)
7.20 ORIFLAME COSMETICS AG (SWITZERLAND)
7.21 COSMAX INC. (SOUTH KOREA)
7.22
Chapter 8: Global Water and Gas Valve Market By Region
8.1 Overview
8.2. North America Water and Gas Valve Market
8.2.1 Key Market Trends, Growth Factors and Opportunities
8.2.2 Top Key Companies
8.2.3 Historic and Forecasted Market Size by Segments
8.2.4 Historic and Forecasted Market Size by Type
8.2.4.1 Ball Valves
8.2.4.2 Gate Valves
8.2.4.3 Butterfly Valves
8.2.4.4 Mixing Valves
8.2.4.5 Multi-Turn Valves
8.2.5 Historic and Forecasted Market Size by End-user
8.2.5.1 Oil and Gas Industry
8.2.5.2 Water and Wastewater Management
8.2.5.3 Chemical Industry
8.2.5.4 Power Generation
8.2.5.5 HAVC
8.2.5.6 Construction
8.2.6 Historic and Forecasted Market Size by Application
8.2.6.1 Residential
8.2.6.2 Commercial
8.2.6.3 Industrial
8.2.7 Historic and Forecast Market Size by Country
8.2.7.1 US
8.2.7.2 Canada
8.2.7.3 Mexico
8.3. Eastern Europe Water and Gas Valve Market
8.3.1 Key Market Trends, Growth Factors and Opportunities
8.3.2 Top Key Companies
8.3.3 Historic and Forecasted Market Size by Segments
8.3.4 Historic and Forecasted Market Size by Type
8.3.4.1 Ball Valves
8.3.4.2 Gate Valves
8.3.4.3 Butterfly Valves
8.3.4.4 Mixing Valves
8.3.4.5 Multi-Turn Valves
8.3.5 Historic and Forecasted Market Size by End-user
8.3.5.1 Oil and Gas Industry
8.3.5.2 Water and Wastewater Management
8.3.5.3 Chemical Industry
8.3.5.4 Power Generation
8.3.5.5 HAVC
8.3.5.6 Construction
8.3.6 Historic and Forecasted Market Size by Application
8.3.6.1 Residential
8.3.6.2 Commercial
8.3.6.3 Industrial
8.3.7 Historic and Forecast Market Size by Country
8.3.7.1 Russia
8.3.7.2 Bulgaria
8.3.7.3 The Czech Republic
8.3.7.4 Hungary
8.3.7.5 Poland
8.3.7.6 Romania
8.3.7.7 Rest of Eastern Europe
8.4. Western Europe Water and Gas Valve Market
8.4.1 Key Market Trends, Growth Factors and Opportunities
8.4.2 Top Key Companies
8.4.3 Historic and Forecasted Market Size by Segments
8.4.4 Historic and Forecasted Market Size by Type
8.4.4.1 Ball Valves
8.4.4.2 Gate Valves
8.4.4.3 Butterfly Valves
8.4.4.4 Mixing Valves
8.4.4.5 Multi-Turn Valves
8.4.5 Historic and Forecasted Market Size by End-user
8.4.5.1 Oil and Gas Industry
8.4.5.2 Water and Wastewater Management
8.4.5.3 Chemical Industry
8.4.5.4 Power Generation
8.4.5.5 HAVC
8.4.5.6 Construction
8.4.6 Historic and Forecasted Market Size by Application
8.4.6.1 Residential
8.4.6.2 Commercial
8.4.6.3 Industrial
8.4.7 Historic and Forecast Market Size by Country
8.4.7.1 Germany
8.4.7.2 UK
8.4.7.3 France
8.4.7.4 The Netherlands
8.4.7.5 Italy
8.4.7.6 Spain
8.4.7.7 Rest of Western Europe
8.5. Asia Pacific Water and Gas Valve Market
8.5.1 Key Market Trends, Growth Factors and Opportunities
8.5.2 Top Key Companies
8.5.3 Historic and Forecasted Market Size by Segments
8.5.4 Historic and Forecasted Market Size by Type
8.5.4.1 Ball Valves
8.5.4.2 Gate Valves
8.5.4.3 Butterfly Valves
8.5.4.4 Mixing Valves
8.5.4.5 Multi-Turn Valves
8.5.5 Historic and Forecasted Market Size by End-user
8.5.5.1 Oil and Gas Industry
8.5.5.2 Water and Wastewater Management
8.5.5.3 Chemical Industry
8.5.5.4 Power Generation
8.5.5.5 HAVC
8.5.5.6 Construction
8.5.6 Historic and Forecasted Market Size by Application
8.5.6.1 Residential
8.5.6.2 Commercial
8.5.6.3 Industrial
8.5.7 Historic and Forecast Market Size by Country
8.5.7.1 China
8.5.7.2 India
8.5.7.3 Japan
8.5.7.4 South Korea
8.5.7.5 Malaysia
8.5.7.6 Thailand
8.5.7.7 Vietnam
8.5.7.8 The Philippines
8.5.7.9 Australia
8.5.7.10 New Zealand
8.5.7.11 Rest of APAC
8.6. Middle East & Africa Water and Gas Valve Market
8.6.1 Key Market Trends, Growth Factors and Opportunities
8.6.2 Top Key Companies
8.6.3 Historic and Forecasted Market Size by Segments
8.6.4 Historic and Forecasted Market Size by Type
8.6.4.1 Ball Valves
8.6.4.2 Gate Valves
8.6.4.3 Butterfly Valves
8.6.4.4 Mixing Valves
8.6.4.5 Multi-Turn Valves
8.6.5 Historic and Forecasted Market Size by End-user
8.6.5.1 Oil and Gas Industry
8.6.5.2 Water and Wastewater Management
8.6.5.3 Chemical Industry
8.6.5.4 Power Generation
8.6.5.5 HAVC
8.6.5.6 Construction
8.6.6 Historic and Forecasted Market Size by Application
8.6.6.1 Residential
8.6.6.2 Commercial
8.6.6.3 Industrial
8.6.7 Historic and Forecast Market Size by Country
8.6.7.1 Turkiye
8.6.7.2 Bahrain
8.6.7.3 Kuwait
8.6.7.4 Saudi Arabia
8.6.7.5 Qatar
8.6.7.6 UAE
8.6.7.7 Israel
8.6.7.8 South Africa
8.7. South America Water and Gas Valve Market
8.7.1 Key Market Trends, Growth Factors and Opportunities
8.7.2 Top Key Companies
8.7.3 Historic and Forecasted Market Size by Segments
8.7.4 Historic and Forecasted Market Size by Type
8.7.4.1 Ball Valves
8.7.4.2 Gate Valves
8.7.4.3 Butterfly Valves
8.7.4.4 Mixing Valves
8.7.4.5 Multi-Turn Valves
8.7.5 Historic and Forecasted Market Size by End-user
8.7.5.1 Oil and Gas Industry
8.7.5.2 Water and Wastewater Management
8.7.5.3 Chemical Industry
8.7.5.4 Power Generation
8.7.5.5 HAVC
8.7.5.6 Construction
8.7.6 Historic and Forecasted Market Size by Application
8.7.6.1 Residential
8.7.6.2 Commercial
8.7.6.3 Industrial
8.7.7 Historic and Forecast Market Size by Country
8.7.7.1 Brazil
8.7.7.2 Argentina
8.7.7.3 Rest of SA
Chapter 9 Analyst Viewpoint and Conclusion
9.1 Recommendations and Concluding Analysis
9.2 Potential Market Strategies
Chapter 10 Research Methodology
10.1 Research Process
10.2 Primary Research
10.3 Secondary Research
|
Water and Gas Valve Market |
|||
|
Base Year: |
2023 |
Forecast Period: |
2024-2032 |
|
Historical Data: |
2017 to 2023 |
Market Size in 2023: |
USD 6.4 Bn. |
|
Forecast Period 2024-32 CAGR: |
4.9% |
Market Size in 2032: |
USD 9.84 Bn. |
|
Segments Covered: |
By Type |
|
|
|
By End-user |
|
||
|
By Application |
|
||
|
By Region |
|
||
|
Key Market Drivers: |
|
||
|
Key Market Restraints: |
|
||
|
Key Opportunities: |
|
||
|
Companies Covered in the Report: |
|
||


