


Elevator and Escalator Market Synopsis
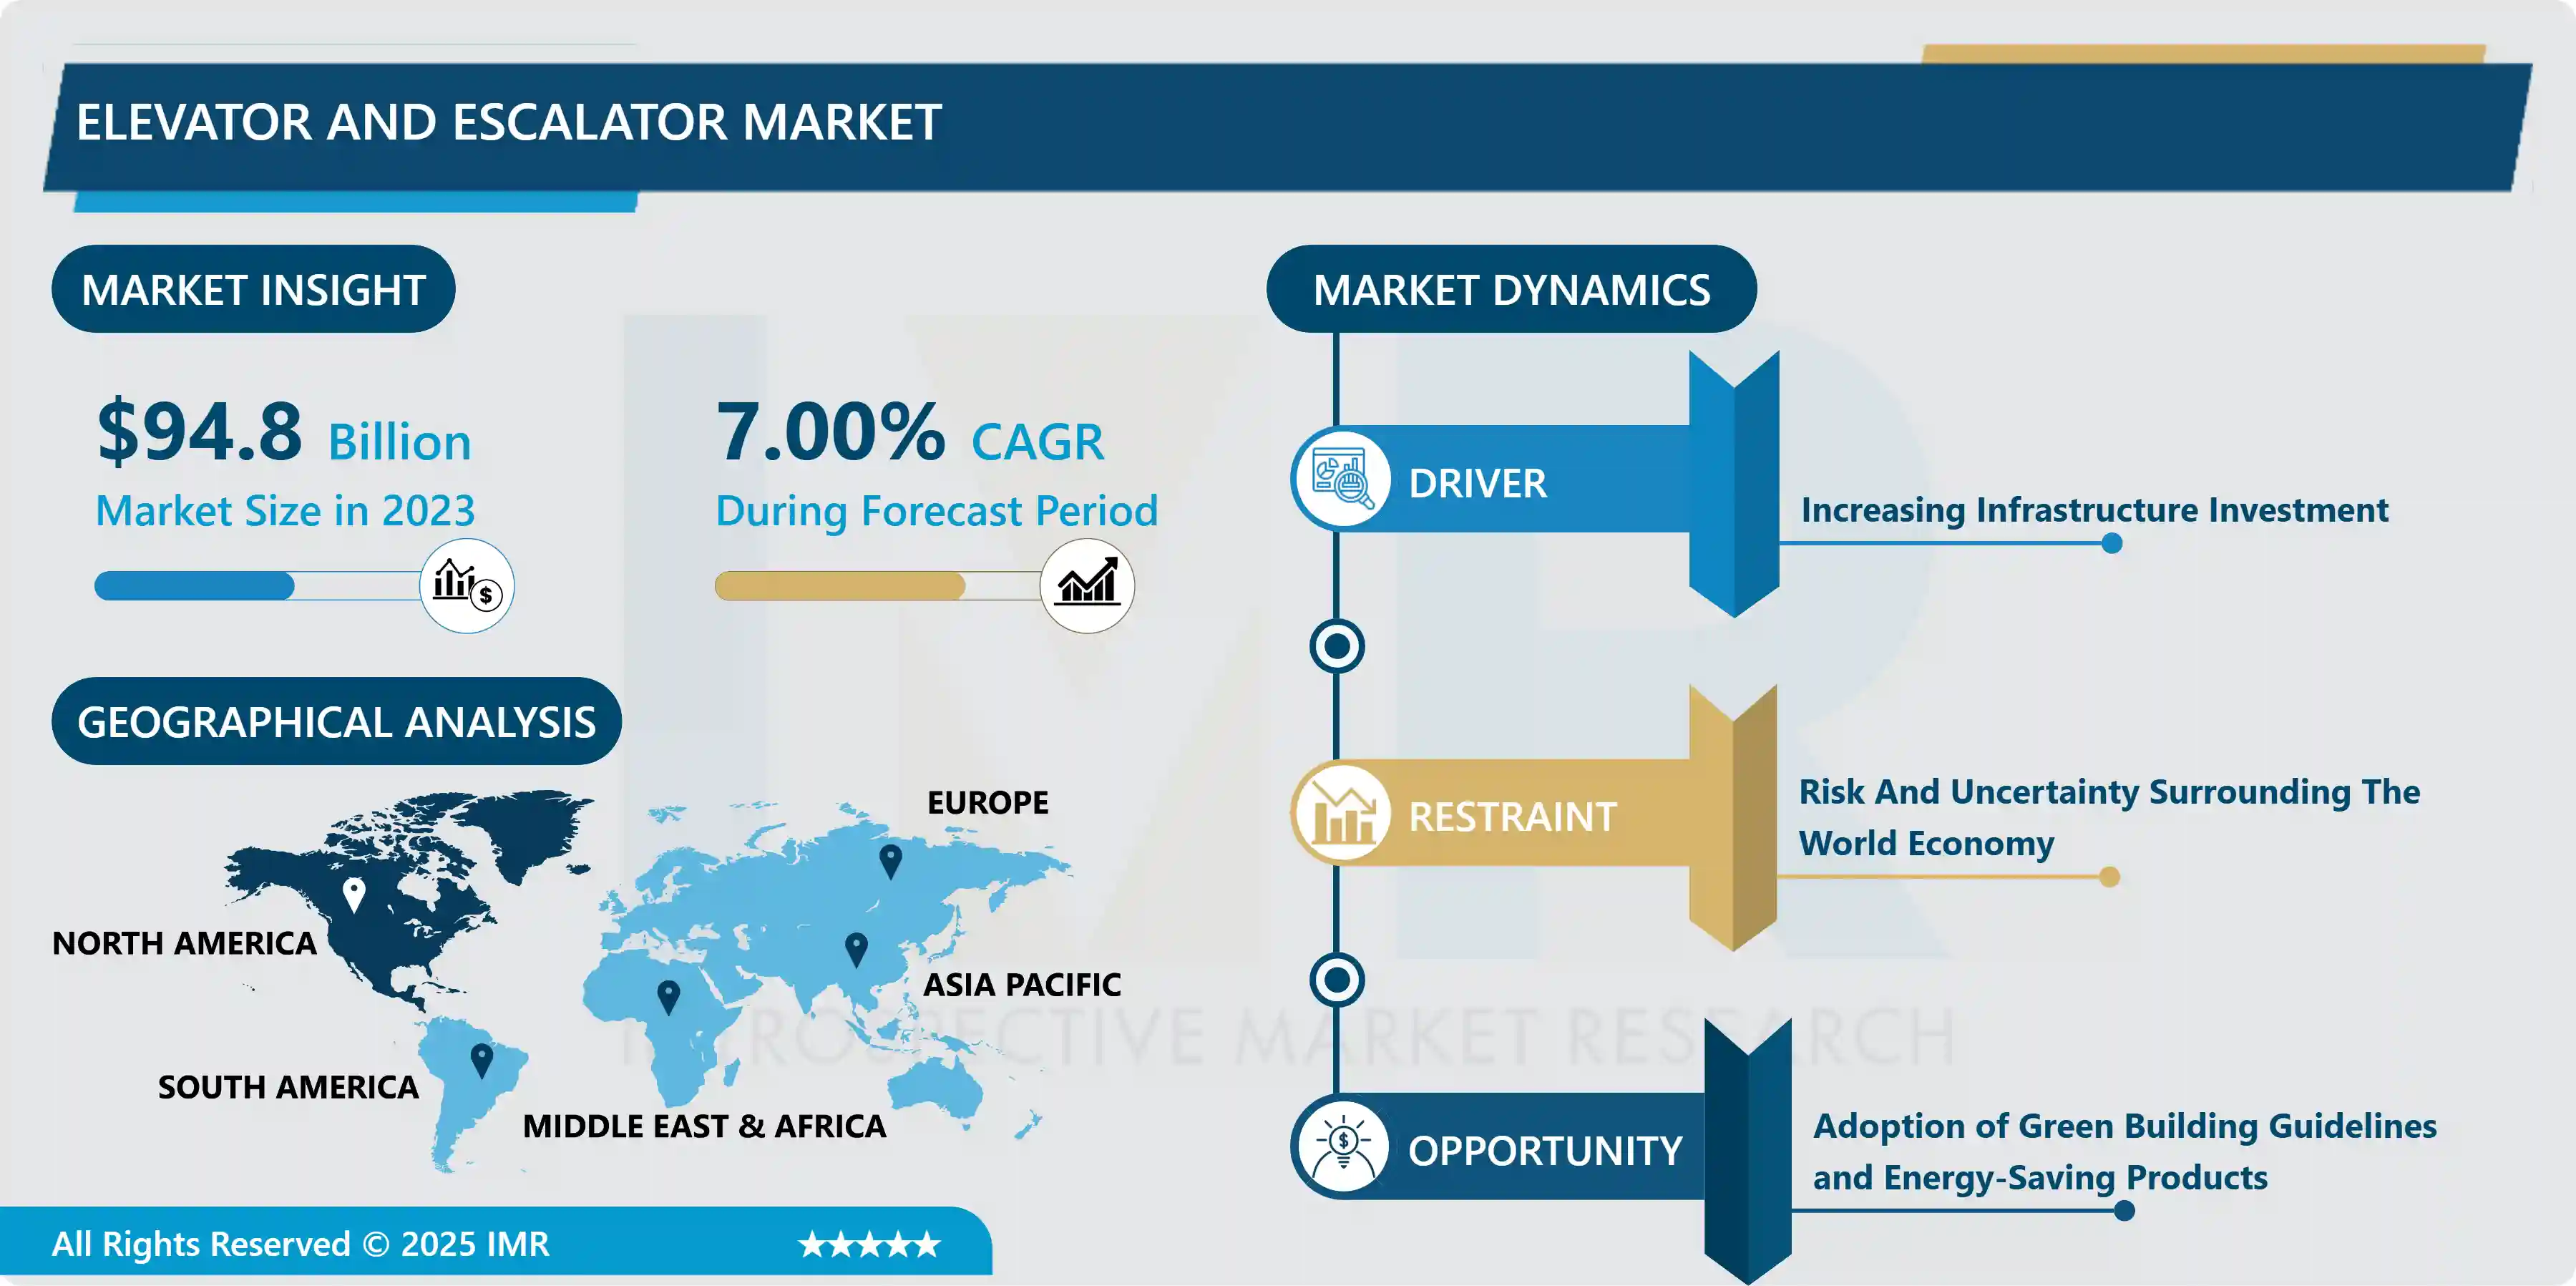
The Global Market for Elevator and Escalator Estimated at USD 94.8 Billion In the Year 2023, is Projected to Reach A Revised Size of USD 174.29 Billion by 2032, Growing at A CAGR of 7.0% Over the Forecast Period 2024-2032.
An elevator is a sort of lift for rooms that may carry several people at once. It is utilized to transport people up and down between floors of a building. In contrast, escalators act as moving steps that transport passengers between a building's various floors. Patient data, luggage, etc. considered to be inter-floor transporters placed and used in commercial infrastructures, residential structures, and industrial settings, such as elevators, escalators, and associated moving walkways. The research report offers comprehensive insights into how sales are divided among product segments for new installations in newly constructed infrastructure projects, replacement or repaired products as part of maintenance activities, or the replacement of outdated solutions with cutting-edge technology under modernization operations.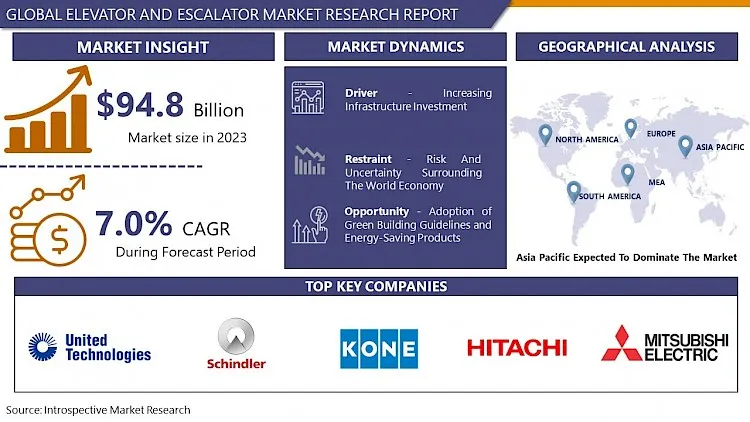
The first passenger elevator was built in New York in 1857, but it was abandoned three years later after a rocky start. People were hesitant to use elevators as a mode of transportation at the time since they were only seen as a piece of industrial equipment. However, the introduction of high-rise structures and contemporary cities completely altered the elevator sector. Over 18 million elevators and escalators are now in use worldwide.
Elevator and escalator markets are expanding as a result of increased investment in residential and commercial infrastructure projects in both developing and developed economies. It is anticipated that the product will develop as more of the largest and tallest commercial structures are constructed in various regions. For instance, some of the urban projects to which manufacturers are keen to contribute are White Magnolia Tower, Raffles City, Xujiahui Center, One Manhattan West, and Lakhta Center. Additionally, it is anticipated that the market would develop as a consequence of manufacturers putting more emphasis on providing products with greater safety. 
According to Statista, the above graph shows that the continuous increase in the total number of elevators and escalators in operation around the world indicates the ongoing urbanization and development of infrastructure in various regions. As of 2022, with over 20 million elevators and escalators in operation, it is evident that these vertical transportation systems have become an essential part of modern life, especially in densely populated urban areas.
The Elevator and Escalator Market Dyanamic:
Driver
Rapid Urbanization Across the Globe
- Quick urbanization across the globe has arisen as a crucial driver for the lift and elevator market, reshaping metropolitan scenes and changing the manner in which individuals move inside urban areas. Vertical solutions are urgently needed to meet the growing demand for space-saving living and working environments as urban populations grow. As a solution to the challenge of limited land availability in densely populated areas, tall buildings, characterized by high-rise structures and skyscrapers, have become emblematic of contemporary urbanization. With regards to fast urbanization, populace densification inside urban communities is a characterizing pattern.
- More individuals are congregating in metropolitan places, prompting expanded swarming and blockage. Accordingly, vertical development has picked up speed, permitting engineers to fabricate upwards to oblige a bigger number of inhabitants and organizations inside a restricted metropolitan impression. Lifts and elevators assume an imperative part in this upward versatility environment, giving effective transportation among floors and empowering consistent admittance to different conveniences and administrations situated inside tall structures.
- Besides, fast urbanization is interwoven with changing way of life inclinations and financial elements. Metropolitan regions draw in people looking for business amazing open doors, instructive establishments, and social conveniences, driving relocation from provincial to metropolitan regions. This metropolitan deluge powers interest for private and business spaces in tall structures, further highlighting the requirement for dependable vertical transportation frameworks. Lifts and elevators not just work with everyday drives and admittance to work environments yet additionally improve the general comfort and openness of metropolitan living. Besides, as states and confidential designers put resources into framework undertakings to help metropolitan development, lifts and elevators arise as essential parts of current metropolitan foundation.
Opportunity
Green Building Initiatives With growing emphasis on sustainability and energy efficiency
- lift and elevator market to line up with green structure drives. These frameworks are intended to upgrade energy utilization through elements like regenerative drives, Drove lighting, and reserve modes. By offering items that meet rigid energy productivity necessities, makers can engage earth cognizant clients and engineers trying to accomplish maintainability objectives in their structure projects. Besides, green structure certificate programs like Initiative in Energy and Ecological Plan (LEED) give a system to assessing the supportability of structures.
- Lift and elevator makers can foster items and arrangements that add to LEED focuses by utilizing supportable materials, decreasing energy utilization, and giving eco-accommodating plan choices. This arrangement with green structure guidelines upgrades the market allure of their items and separates them from contenders. Notwithstanding ecological advantages, energy-proficient lift and elevator frameworks offer expense reserve funds to building proprietors and administrators.
- Lift and elevator makers can use these motivations, for example, tax reductions, awards, and refunds for energy-proficient items, to empower reception and drive market interest for green structure agreeable arrangements. By lining up with government drives, producers can uphold maintainability objectives at both the neighborhood and worldwide levels while growing their market reach.
- In conclusion, the accentuation on maintainability and energy proficiency presents a convincing an open door for the lift and elevator market to enhance, create eco-accommodating arrangements, and add to a more feasible constructed climate. By offering energy-effective items, lessening ecological effect, and supporting reasonable structure rehearses, makers cannot just meet the developing necessities of the market yet in addition assume a critical part in tending to environmental change and advancing natural stewardship.
Segmentation Analysis of the Elevator and Escalator Market
Elevator and Escalator market segments cover the Product, business, and application. By Product, the Escalators segment is anticipated to dominate the Market over the Forecast period.
The market's fastest-growing category is anticipated to be escalators. The increased demand from commercial infrastructures, such as shopping centers, business parks, and others, is to blame for this. Additionally, the need for escalators and moving walkways is increasing as a result of the expanding aircraft infrastructure development. For instance, the $775 million redevelopment of Stansted Airport in the United Kingdom is anticipated to be finished by 2021. Furthermore, due to their widespread market penetration, the need for elevators is anticipated to expand steadily.
The escalator market is projected to be the fastest-growing category due to several factors. With the rapid urbanization and increasing construction of high-rise buildings in emerging economies, the demand for vertical transportation solutions is surging. Escalators offer a convenient and efficient way to move large numbers of people between different floors, making them a popular choice in malls, airports, and public transport hubs. Additionally, advancements in technology have led to energy-efficient and safer escalator models, further driving their adoption. As cities expand, the need for efficient transportation systems escalates, positioning escalators as a pivotal component in modern urban infrastructure, contributing to their remarkable growth in the market.
Regional Analysis of the Elevator and Escalator Market
Asia Pacific is expected to dominate the Market over the Forecast period.
The increasing demand from China and India is driving the market in the Asia Pacific region. Some of the driving forces behind the market include the simple accessibility of raw resources, low cost of labor, and a relatively strict regulatory structure in these emerging nations. China, India, and Japan are the three most important markets in the Asia Pacific, whereas the US is the biggest market in North America. The market for elevators and escalators in APAC is anticipated to be driven by the expanding use of these devices in the region's infrastructure, commercial, and residential sectors. During the forecast period, industrialization, a growing middle-class population, increasing disposable income, and shifting lifestyles are anticipated to fuel demand for elevators and escalators.
According to Statista, Due to the building industry's continued growth, it is anticipated that the global market for elevators would surpass 183 billion US dollars by 2026. China accounts for two-thirds of new installations globally, and the Asia-Pacific market has seen the strongest growth. Growth is mostly being driven by the region's rapid urbanization and preference for tall structures.
COVID-19 Impact Analysis on the Elevator and Escalator Market
A difficult and unprecedented global health disaster was caused by the COVID-19 epidemic. As a precaution, the majority of the major economies enforced a severe and sudden nationwide lockdown that restricted the region's financial activity. The labor-intensive and extremely unstable construction sector was severely impacted by the abrupt closure. This aspect also slowed down modernization and new building, which hindered sales and the growth of the global market. Reduced financial liquidity, uncertainty around public investments, and a gloomy outlook among established potential investors all contributed to a slowdown in market expansion. The manufacturing ecosystem's supply chain has been completely disrupted, and as a result, the market has degraded throughout many different locations. A temporary prohibition was required by numerous federal governments.
Top Key Players Covered in the Elevator and Escalator Market
- United Technologies (U.S.)
- Schindler (Switzerland)
- KONE CORPORATION (Finland)
- Hitachi, Ltd. (Japan)
- HYUNDAIELEVATOR CO., LTD. (South Korea)
- Mitsubishi Electric Corporation(Japan)
- Johnson Elevator Co., Ltd. (China)
- FUJITEC CO., LTD (Japan)
- Toshiba Corporation (Japan)
- Schindler Management Ltd. (Switzerland)
- ThyssenKrup AG (Germany)
- Sigma elevator company (Thailand)
- Electra Ltd (Israel)
- Gulf Elevator & Escalator Co, Ltd (Japan)
- Otis Elevator Company (US), and Other Major Players.
Key Industry Developments in the Elevator and Escalator Market
- In April 2024, Hitachi Energy revealed investments of over $1.5 billion to ramp up its global transformer manufacturing capacity to keep pace with the growing demand and support long-term plans and electrification efforts. The investments were intended to gradually expand the company's global transformer capacity by 2027 and were in addition to the $3 billion already announced to progress on the electrification of the energy system driven by the energy transition.
- In October 2023, KONE Corporation, a global leader in the elevator and escalator industry, completed the sale of its Russia operations to Russia-based S8 Capital diversified Holding. The transaction had been approved by the relevant authorities, and with the closing of the deal, KONE was fully divested from Russia. The value of the transaction was not disclosed. The sale of the business followed KONE's announcement in March 2022 to cease deliveries and not sign new orders due to Russia's military actions against Ukraine. In June of the same year, KONE revealed its plans to divest its business and operations. At the time of closing the deal, KONE had employed approximately 300 people in Russia, and the business accounted for less than 1% of KONE's global sales.
|
Global Elevator and Escalator Market |
|||
|
Base Year: |
2023 |
Forecast Period: |
2024-2032 |
|
Historical Data: |
2017 to 2023 |
Market Size in 2023: |
USD 94.8 Bn. |
|
Forecast Period 2024-32 CAGR: |
7.0 % |
Market Size in 2032: |
USD 174.29 Bn. |
|
Segments Covered: |
By Product |
|
|
|
By Business |
|
||
|
By Application |
|
||
|
By Region |
|
||
|
Key Market Drivers: |
|
||
|
Key Market Restraints: |
|
||
|
Key Opportunities: |
|
||
|
Companies Covered in the report: |
|
||
Chapter 1: Introduction
1.1 Scope and Coverage
Chapter 2:Executive Summary
Chapter 3: Market Landscape
3.1 Market Dynamics
3.1.1 Drivers
3.1.2 Restraints
3.1.3 Opportunities
3.1.4 Challenges
3.2 Market Trend Analysis
3.3 PESTLE Analysis
3.4 Porter's Five Forces Analysis
3.5 Industry Value Chain Analysis
3.6 Ecosystem
3.7 Regulatory Landscape
3.8 Price Trend Analysis
3.9 Patent Analysis
3.10 Technology Evolution
3.11 Investment Pockets
3.12 Import-Export Analysis
Chapter 4: Elevator and Escalator Market by Product (2018-2032)
4.1 Elevator and Escalator Market Snapshot and Growth Engine
4.2 Market Overview
4.3 Elevators
4.3.1 Introduction and Market Overview
4.3.2 Historic and Forecasted Market Size in Value USD and Volume Units
4.3.3 Key Market Trends, Growth Factors, and Opportunities
4.3.4 Geographic Segmentation Analysis
4.4 Escalators
4.5 Moving Walkways
Chapter 5: Elevator and Escalator Market by Business (2018-2032)
5.1 Elevator and Escalator Market Snapshot and Growth Engine
5.2 Market Overview
5.3 New Equipment
5.3.1 Introduction and Market Overview
5.3.2 Historic and Forecasted Market Size in Value USD and Volume Units
5.3.3 Key Market Trends, Growth Factors, and Opportunities
5.3.4 Geographic Segmentation Analysis
5.4 Maintenance
5.5 Modernization
Chapter 6: Elevator and Escalator Market by Application (2018-2032)
6.1 Elevator and Escalator Market Snapshot and Growth Engine
6.2 Market Overview
6.3 Residential
6.3.1 Introduction and Market Overview
6.3.2 Historic and Forecasted Market Size in Value USD and Volume Units
6.3.3 Key Market Trends, Growth Factors, and Opportunities
6.3.4 Geographic Segmentation Analysis
6.4 Commercial
6.5 Industrial
Chapter 7: Company Profiles and Competitive Analysis
7.1 Competitive Landscape
7.1.1 Competitive Benchmarking
7.1.2 Elevator and Escalator Market Share by Manufacturer (2024)
7.1.3 Industry BCG Matrix
7.1.4 Heat Map Analysis
7.1.5 Mergers and Acquisitions
7.2 BSL LIMITED (INDIA)
7.2.1 Company Overview
7.2.2 Key Executives
7.2.3 Company Snapshot
7.2.4 Role of the Company in the Market
7.2.5 Sustainability and Social Responsibility
7.2.6 Operating Business Segments
7.2.7 Product Portfolio
7.2.8 Business Performance
7.2.9 Key Strategic Moves and Recent Developments
7.2.10 SWOT Analysis
7.3 SHANDONG RUYI TECHNOLOGY GROUP COLTD. (CHINA)
7.4 INDORAMA VENTURES PUBLIC COMPANY LIMITED (THAILAND)
7.5 ADITYA BIRLA GROUP (INDIA)
7.6 LUTHAI TEXTILE COLTD. (CHINA)
7.7 WELSPUN INDIA LTD. (INDIA)
7.8 LENZING AG (AUSTRIA)
7.9 ALBIS PLASTIC GMBH (GERMANY)
7.10 GRASIM INDUSTRIES LIMITED (INDIA)
7.11 TORAY INDUSTRIES INC. (JAPAN)
7.12 TEIJIN LIMITED (JAPAN)
7.13 MILLIKEN & COMPANY(USA)
7.14 FIBRE2FASHION PVT. LTD. (INDIA)
Chapter 8: Global Elevator and Escalator Market By Region
8.1 Overview
8.2. North America Elevator and Escalator Market
8.2.1 Key Market Trends, Growth Factors and Opportunities
8.2.2 Top Key Companies
8.2.3 Historic and Forecasted Market Size by Segments
8.2.4 Historic and Forecasted Market Size by Product
8.2.4.1 Elevators
8.2.4.2 Escalators
8.2.4.3 Moving Walkways
8.2.5 Historic and Forecasted Market Size by Business
8.2.5.1 New Equipment
8.2.5.2 Maintenance
8.2.5.3 Modernization
8.2.6 Historic and Forecasted Market Size by Application
8.2.6.1 Residential
8.2.6.2 Commercial
8.2.6.3 Industrial
8.2.7 Historic and Forecast Market Size by Country
8.2.7.1 US
8.2.7.2 Canada
8.2.7.3 Mexico
8.3. Eastern Europe Elevator and Escalator Market
8.3.1 Key Market Trends, Growth Factors and Opportunities
8.3.2 Top Key Companies
8.3.3 Historic and Forecasted Market Size by Segments
8.3.4 Historic and Forecasted Market Size by Product
8.3.4.1 Elevators
8.3.4.2 Escalators
8.3.4.3 Moving Walkways
8.3.5 Historic and Forecasted Market Size by Business
8.3.5.1 New Equipment
8.3.5.2 Maintenance
8.3.5.3 Modernization
8.3.6 Historic and Forecasted Market Size by Application
8.3.6.1 Residential
8.3.6.2 Commercial
8.3.6.3 Industrial
8.3.7 Historic and Forecast Market Size by Country
8.3.7.1 Russia
8.3.7.2 Bulgaria
8.3.7.3 The Czech Republic
8.3.7.4 Hungary
8.3.7.5 Poland
8.3.7.6 Romania
8.3.7.7 Rest of Eastern Europe
8.4. Western Europe Elevator and Escalator Market
8.4.1 Key Market Trends, Growth Factors and Opportunities
8.4.2 Top Key Companies
8.4.3 Historic and Forecasted Market Size by Segments
8.4.4 Historic and Forecasted Market Size by Product
8.4.4.1 Elevators
8.4.4.2 Escalators
8.4.4.3 Moving Walkways
8.4.5 Historic and Forecasted Market Size by Business
8.4.5.1 New Equipment
8.4.5.2 Maintenance
8.4.5.3 Modernization
8.4.6 Historic and Forecasted Market Size by Application
8.4.6.1 Residential
8.4.6.2 Commercial
8.4.6.3 Industrial
8.4.7 Historic and Forecast Market Size by Country
8.4.7.1 Germany
8.4.7.2 UK
8.4.7.3 France
8.4.7.4 The Netherlands
8.4.7.5 Italy
8.4.7.6 Spain
8.4.7.7 Rest of Western Europe
8.5. Asia Pacific Elevator and Escalator Market
8.5.1 Key Market Trends, Growth Factors and Opportunities
8.5.2 Top Key Companies
8.5.3 Historic and Forecasted Market Size by Segments
8.5.4 Historic and Forecasted Market Size by Product
8.5.4.1 Elevators
8.5.4.2 Escalators
8.5.4.3 Moving Walkways
8.5.5 Historic and Forecasted Market Size by Business
8.5.5.1 New Equipment
8.5.5.2 Maintenance
8.5.5.3 Modernization
8.5.6 Historic and Forecasted Market Size by Application
8.5.6.1 Residential
8.5.6.2 Commercial
8.5.6.3 Industrial
8.5.7 Historic and Forecast Market Size by Country
8.5.7.1 China
8.5.7.2 India
8.5.7.3 Japan
8.5.7.4 South Korea
8.5.7.5 Malaysia
8.5.7.6 Thailand
8.5.7.7 Vietnam
8.5.7.8 The Philippines
8.5.7.9 Australia
8.5.7.10 New Zealand
8.5.7.11 Rest of APAC
8.6. Middle East & Africa Elevator and Escalator Market
8.6.1 Key Market Trends, Growth Factors and Opportunities
8.6.2 Top Key Companies
8.6.3 Historic and Forecasted Market Size by Segments
8.6.4 Historic and Forecasted Market Size by Product
8.6.4.1 Elevators
8.6.4.2 Escalators
8.6.4.3 Moving Walkways
8.6.5 Historic and Forecasted Market Size by Business
8.6.5.1 New Equipment
8.6.5.2 Maintenance
8.6.5.3 Modernization
8.6.6 Historic and Forecasted Market Size by Application
8.6.6.1 Residential
8.6.6.2 Commercial
8.6.6.3 Industrial
8.6.7 Historic and Forecast Market Size by Country
8.6.7.1 Turkiye
8.6.7.2 Bahrain
8.6.7.3 Kuwait
8.6.7.4 Saudi Arabia
8.6.7.5 Qatar
8.6.7.6 UAE
8.6.7.7 Israel
8.6.7.8 South Africa
8.7. South America Elevator and Escalator Market
8.7.1 Key Market Trends, Growth Factors and Opportunities
8.7.2 Top Key Companies
8.7.3 Historic and Forecasted Market Size by Segments
8.7.4 Historic and Forecasted Market Size by Product
8.7.4.1 Elevators
8.7.4.2 Escalators
8.7.4.3 Moving Walkways
8.7.5 Historic and Forecasted Market Size by Business
8.7.5.1 New Equipment
8.7.5.2 Maintenance
8.7.5.3 Modernization
8.7.6 Historic and Forecasted Market Size by Application
8.7.6.1 Residential
8.7.6.2 Commercial
8.7.6.3 Industrial
8.7.7 Historic and Forecast Market Size by Country
8.7.7.1 Brazil
8.7.7.2 Argentina
8.7.7.3 Rest of SA
Chapter 9 Analyst Viewpoint and Conclusion
9.1 Recommendations and Concluding Analysis
9.2 Potential Market Strategies
Chapter 10 Research Methodology
10.1 Research Process
10.2 Primary Research
10.3 Secondary Research
|
Global Elevator and Escalator Market |
|||
|
Base Year: |
2023 |
Forecast Period: |
2024-2032 |
|
Historical Data: |
2017 to 2023 |
Market Size in 2023: |
USD 94.8 Bn. |
|
Forecast Period 2024-32 CAGR: |
7.0 % |
Market Size in 2032: |
USD 174.29 Bn. |
|
Segments Covered: |
By Product |
|
|
|
By Business |
|
||
|
By Application |
|
||
|
By Region |
|
||
|
Key Market Drivers: |
|
||
|
Key Market Restraints: |
|
||
|
Key Opportunities: |
|
||
|
Companies Covered in the report: |
|
||


