


Virtual Reality in Gaming Market Synopsis
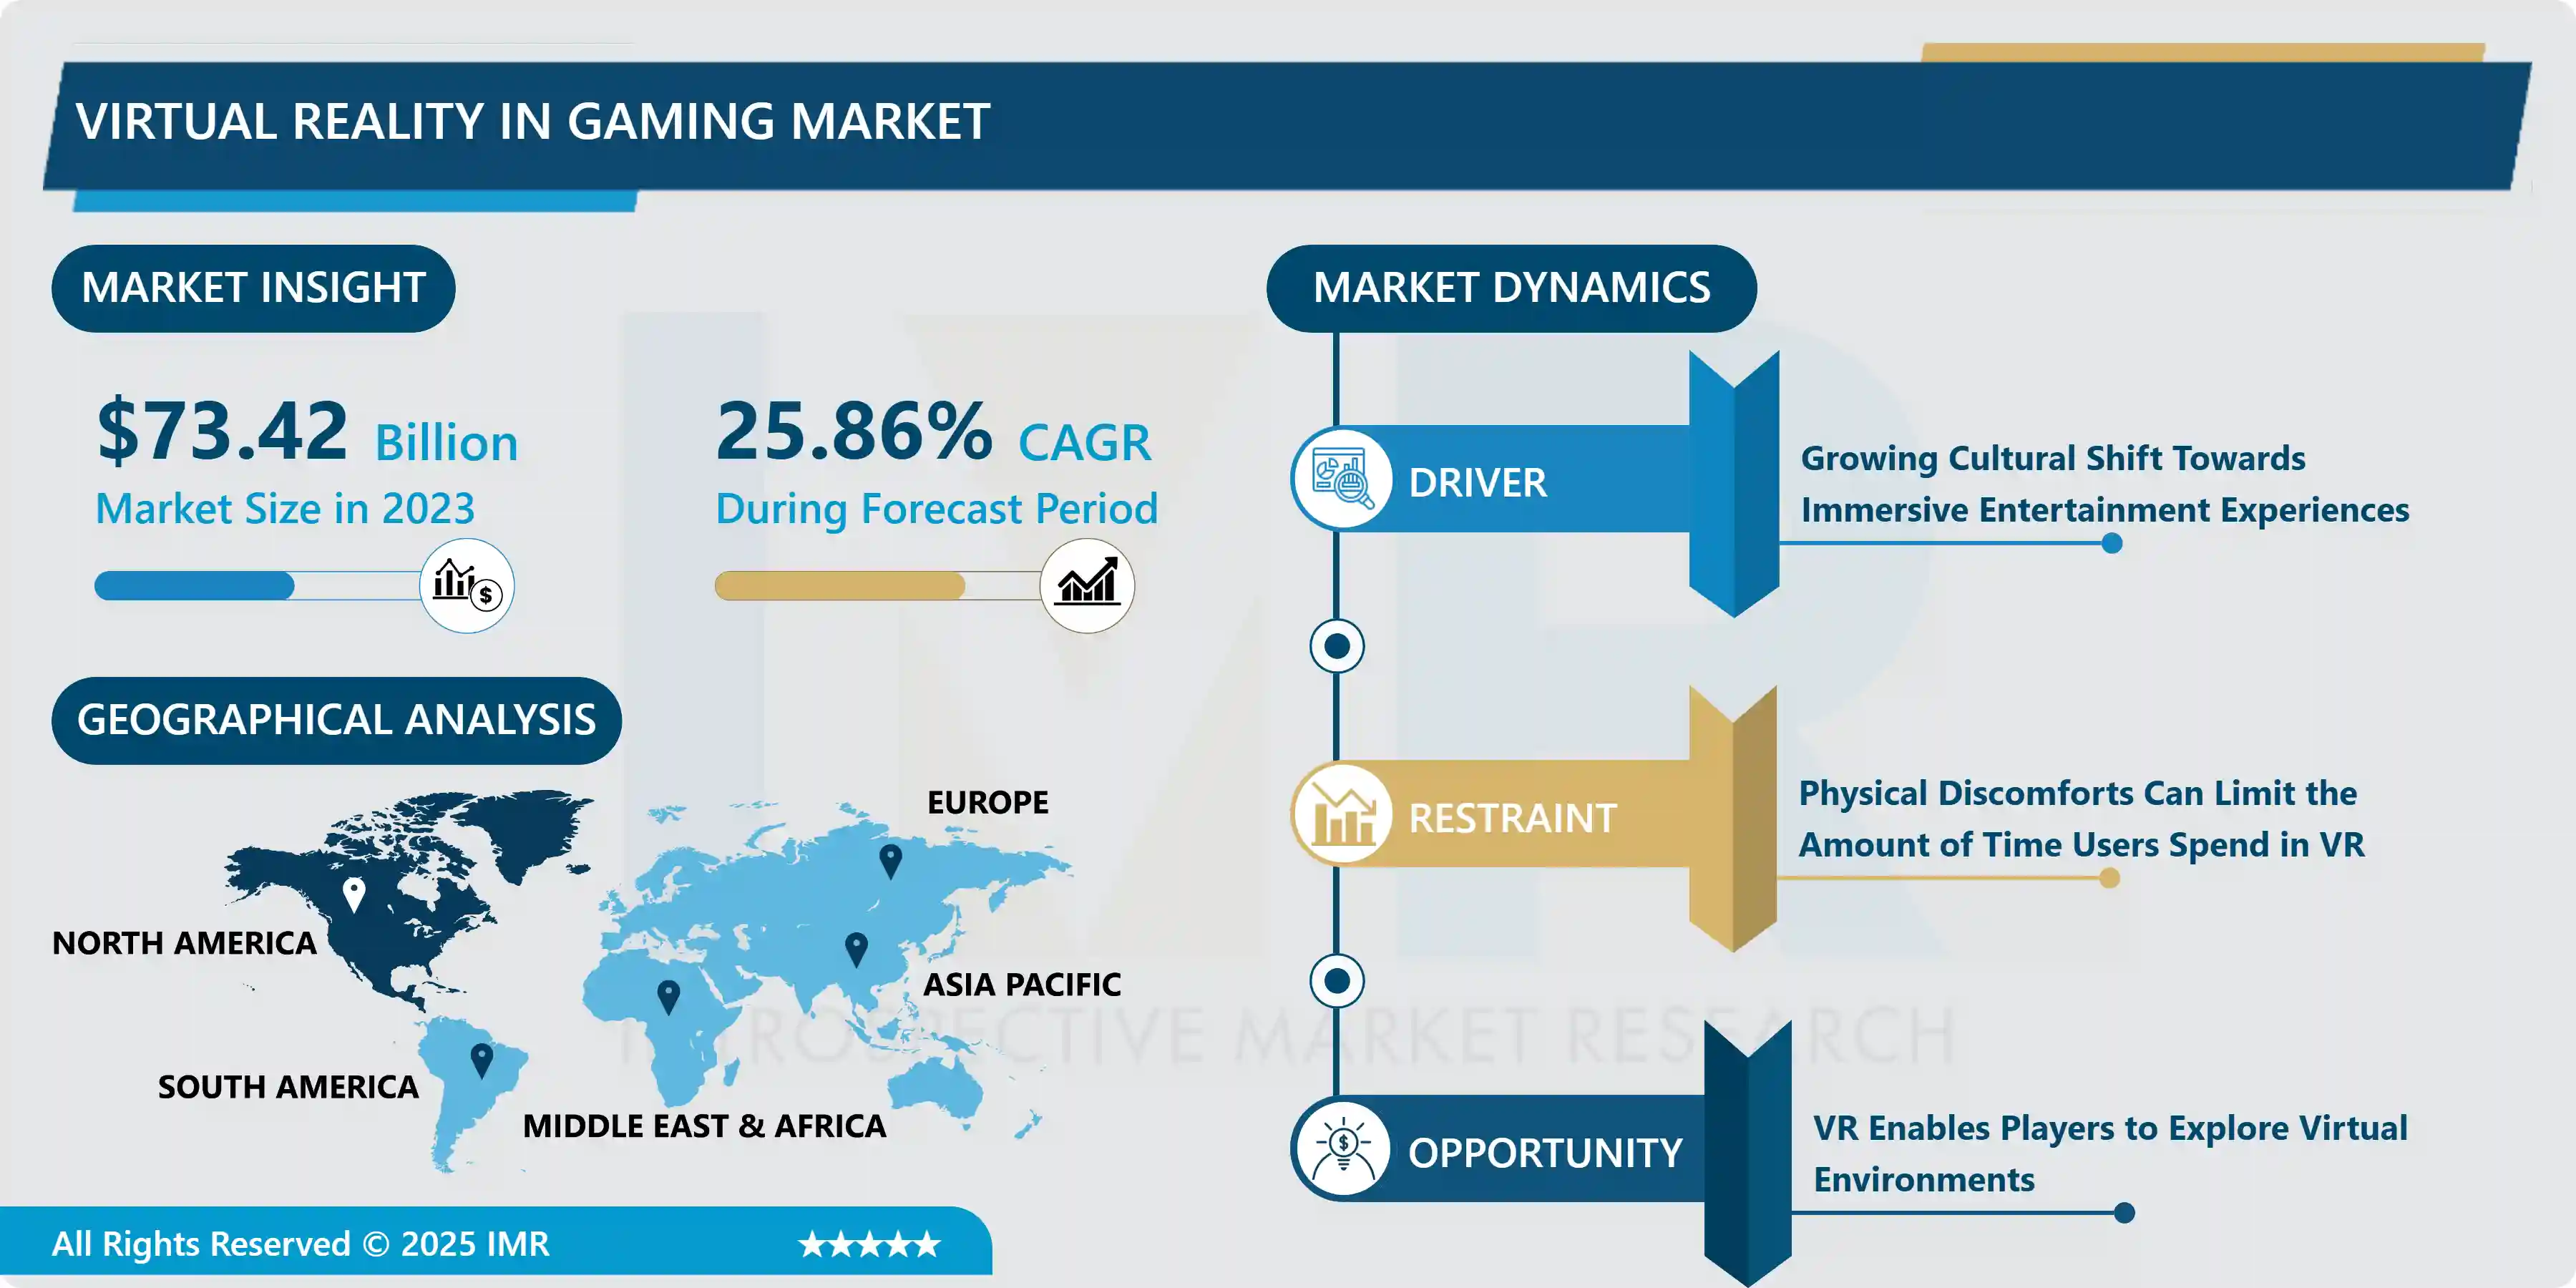
Virtual Reality in Gaming Market Size Was Valued at USD 73.42 Billion in 2023, and is Projected to Reach USD 581.84 Billion by 2032, Growing at a CAGR of 25.86% From 2024-2032
Virtual Reality (VR) in gamingis the use of technology to create immersive simulated environments that users can interact with using a headset and controllers, giving them a sense of presence and allowing for deeply engaging gameplay experiences.
VR gaming offers players an immersive experience, allowing them to feel physically present in the game world. This immersive experience can be used in various genres, such as action, adventure, puzzle, and simulation games. VR gaming allows players to explore vast, detailed virtual worlds, practice real-world skills in a safe, controlled environment, and facilitate social interaction. It also has immense potential for educational purposes, allowing students to explore historical events, dissect virtual organisms, and even travel to outer space. VR is also used in healthcare for physical therapy, pain management, and mental health treatment, helping patients manage pain, overcome phobias, and reduce stress.
VR arcades and entertainment centers provide high-end VR gaming without the need for expensive home equipment, offering a wide range of experiences. However, VR enables artists and developers to create interactive and immersive experiences that push the boundaries of traditional gaming, fostering creativity and innovation. VR gaming provides an immersive experience, enhancing emotional engagement and overall gaming experience. It introduces innovative gameplay mechanics, allowing players to physically interact with objects in the virtual environment, adding depth and realism. VR gaming also allows players to escape reality and explore new worlds, fostering a sense of community and camaraderie.
Some VR games also promote health and fitness, appealing to a broader audience. Technological advancements, such as higher-resolution displays, accurate tracking, and ergonomics, make VR gaming more comfortable and enjoyable. The introduction of affordable VR headsets has expanded the market reach, making VR gaming accessible to a wider audience. VR technology also offers opportunities for immersive experiences in other forms of media and entertainment, making it appealing to content creators and consumers.
Virtual Reality in Gaming Market Trend Analysis
Growing Cultural Shift Towards Immersive Entertainment Experiences
- The rise of virtual reality (VR) in gaming is driven by a growing cultural shift towards immersive entertainment experiences. This shift is driven by the demand for immersive experiences, which are now being supplemented by interactive mediums like video games. VR gaming offers a unique form of escapism, allowing players to temporarily disconnect from reality. Social and cultural influences also play a role in the adoption and development of VR gaming. The rise of social media and digital connectivity has led to a shift in how people interact and consume entertainment, emphasizing shared experiences and communal engagement.
- Multiplayer VR games allow players to interact with friends and strangers in virtual spaces, fostering social connections and creating shared memories. Advancements in technology have made VR gaming more accessible and affordable, with high-quality VR headsets, motion tracking systems, and haptic feedback devices becoming more affordable and widely available. Improvements in graphics, sound, and artificial intelligence have made virtual worlds more realistic and engaging.
- Innovation in game design has also been driven by the shift towards immersive entertainment experiences, with developers exploring new gameplay mechanics and storytelling techniques specifically tailored for VR. This innovation drives further interest in VR gaming and encourages more developers to explore the medium.
Restraints
Physical Discomforts Can Limit the Amount of Time Users Spend in VR
- Virtual reality (VR) in gaming can cause physical discomforts for users, limiting their comfortable time spent in VR environments. Common issues include motion sickness, eye strain, and fatigue due to the close proximity of display screens to the eyes. VR headsets can be bulky and heavy, causing discomfort, pressure points, headaches, and neck strain. The straps and fit may not be ideal for every user, leading to discomfort during gameplay.
- Temperature and sweating can also be uncomfortable due to VR headsets, especially in active games or environments with poor ventilation. This can limit the duration of VR sessions and cause discomfort. Additionally, users may experience spatial disorientation when transitioning between the virtual and real world, leading to a brief period of discomfort or disorientation as the brain adjusts to the differences in sensory input. Overall, VR can be a challenging and potentially uncomfortable experience for users.
Opportunity
VR Enables Players to Explore Virtual Environments
- VR technology offers a highly immersive and lifelike gaming experience, allowing players to feel physically present within the game world. Its realism is enhanced by detailed graphics, lifelike animations, and convincing physics, making exploration more engaging and believable. Unlike traditional gaming, VR allows players to physically move around and interact with the virtual environment, allowing for more natural and intuitive exploration.
- Interactivity and discovery are common in VR exploration, with puzzles, hidden secrets, and interactive objects encouraging players to actively engage with the environment. VR can also have educational and therapeutic applications, such as teaching history, geography, or science, or providing exposure therapy for phobias or anxiety disorders. Multiplayer and social interaction are also possible in VR, allowing players to explore virtual environments together, fostering collaboration, communication, and social bonding, enhancing the overall gaming experience.
Challenge
High-Quality VR Experiences Require Powerful Hardware
- VR gaming demands high-resolution graphics at high frame rates to maintain immersion and prevent motion sickness. Each frame must be rendered twice, often at higher resolutions than traditional gaming setups. Powerful CPUs and GPUs are required to handle the rendering workload, and advanced display technology is needed for a smooth and comfortable experience. VR headsets require high-resolution displays with low latency and high refresh rates, which can be expensive to manufacture and integrate.
- The cost of high-quality VR hardware, including powerful PCs or gaming consoles and premium headsets, can create a significant barrier to entry for many gamers, potentially limiting the potential audience and slowing its adoption rate. Accessibility concerns may also be deterred by the complexity of setting up and configuring VR hardware, especially if it requires significant investment in new equipment or upgrades to existing systems. Robust tracking and input solutions are also required, often involving additional sensors, cameras, or other tracking hardware.
Virtual Reality in Gaming Market Segment Analysis:
Virtual Reality in Gaming Market is Segmented based on type, connecting device, and end user.
By Type, Hardware segment is expected to dominate the market during the forecast period
- VR technology provides an immersive gaming experience, allowing players to feel physically present in the virtual environment. This level of immersion is not achievable with traditional gaming setups, making VR hardware highly desirable among gamers. Advancements in VR hardware technology have led to improved performance, higher resolutions, better motion tracking, and reduced latency, making VR gaming more accessible and appealing to a broader audience. The growing game library and affordable options have also contributed to the popularity of VR hardware.
- Developers are creating innovative and engaging VR content across various genres, attracting more gamers to invest in VR hardware. Major players, such as Oculus, HTC, Sony, and Valve, have invested heavily in VR technology, further driving its adoption and development. VR gaming also offers potential for social interaction, allowing players to connect and engage with friends and other users from around the world, adding value to the gaming experience and encouraging continued investment in VR hardware.
By Connecting Device, Gaming Console segment held the largest share in 2023
- Gaming consoles like PlayStation, Xbox, and Nintendo Switch have established user bases, making them ideal for integrating VR capabilities. These consoles offer high-quality graphics and powerful processing power, enabling developers to create visually stunning VR games. They also offer integrated ecosystems, including online stores, social features, and multiplayer functionality, making it easier for developers to distribute and monetize VR games. This also enhances the social aspect of VR gaming.
- Incorporating VR into gaming consoles makes the technology more affordable and accessible to a wider audience. Players can purchase a compatible VR headset for their existing console, eliminating the need for expensive PC hardware or standalone headsets. Major gaming console manufacturers like Sony and Microsoft have shown strong support for VR gaming by investing in developer partnerships and creating resources, attracting talented developers to create compelling VR experiences.
Virtual Reality in Gaming Market Regional Insights:
North America is Expected to Dominate the Market Over the Forecast Period
- North America, particularly the US, is home to numerous technology companies that are driving innovation in VR gaming. These companies invest heavily in research and development, creating cutting-edge VR hardware and software. North America has been an early adopter of VR technology, with many consumers embracing it since its inception. The region's high disposable income allows consumers to invest in high-end VR hardware and software, contributing to the growth of the market.
- Companies like Oculus, Sony, and HTC are based in North America or have a strong presence in the region. The region's large gaming market, with a significant portion of the population engaging in gaming activities, provides ample opportunities for VR gaming companies to thrive and expand their reach. Additionally, North America's strong gaming culture, with a large community of dedicated gamers eager to explore new gaming experiences, contributes to the success of VR gaming in the region.
Virtual Reality in Gaming Market Top Key Players:
- Meta Platforms, Inc. (US)
- Oculus VR, LLC (US)
- Valve Corporation (US)
- Google LLC (US)
- Microsoft Corporation (US)
- NVIDIA Corporation (US)
- Unity Technologies (US)
- Apple Inc. (US)
- Advanced Micro Devices, Inc. (US)
- Intel Corporation (US)
- Qualcomm Incorporated (US)
- Electronic Arts Inc. (US)
- Epic Games, Inc. (US)
- Activision Blizzard, Inc. (US)
- Magic Leap, Inc. (US)
- Google Stadia (US)
- Sixense Entertainment, Inc. (US)
- Slightly Mad Studios (UK)
- Ubisoft Entertainment SA (France)
- Lenovo Group Limited (China)
- Sony Interactive Entertainment LLC (Japan)
- Nintendo Co., Ltd. (Japan)
- Samsung Electronics Co., Ltd. (South Korea)
- HTC Corporation (Taiwan), and other major players
Key Industry Developments in the Virtual Reality in Gaming Market:
- In January 2023, Unity, the world's leading platform for creating and growing real-time 3D content, and Google announced that the companies are expanding their partnership and deepening collaboration across their ecosystems to help studios accelerate the growth and development of their live games. Unity and Google are making it easier for all developers to create multiplayer experiences by offering two solutions from Unity Gaming Services (UGS), Game Server Hosting and Voice and Text Chat, on Google Cloud Marketplace Furthermore, the companies announced that Google Ads and Display & Video 360 will soon bid into Unity LevelPlay, Unity's mediation offering, as part of Google's partner bidding program.
- In January 2023, Microsoft Corp. announced plans to acquire Activision Blizzard Inc., a leader in game development and interactive entertainment content publisher. This acquisition will accelerate the growth in Microsoft’s gaming business across mobile, PC, console, and cloud and will provide building blocks for the metaverse.
|
Virtual Reality in Gaming Market |
|||
|
Base Year: |
2023 |
Forecast Period: |
2024-2032 |
|
Historical Data: |
2017 to 2023 |
Market Size in 2023: |
73.42 Bn. |
|
Forecast Period 2024-32 CAGR: |
25.86% |
Market Size in 2030: |
581.84 Bn. |
|
Segments Covered: |
By Type |
|
|
|
By Connecting Device |
|
||
|
By Material |
|
||
|
By Region |
|
||
|
Key Market Drivers: |
|
||
|
Key Market Restraints: |
|
||
|
Key Opportunities: |
|
||
|
Companies Covered in the report: |
|
||
Chapter 1: Introduction
1.1 Scope and Coverage
Chapter 2:Executive Summary
Chapter 3: Market Landscape
3.1 Market Dynamics
3.1.1 Drivers
3.1.2 Restraints
3.1.3 Opportunities
3.1.4 Challenges
3.2 Market Trend Analysis
3.3 PESTLE Analysis
3.4 Porter's Five Forces Analysis
3.5 Industry Value Chain Analysis
3.6 Ecosystem
3.7 Regulatory Landscape
3.8 Price Trend Analysis
3.9 Patent Analysis
3.10 Technology Evolution
3.11 Investment Pockets
3.12 Import-Export Analysis
Chapter 4: Virtual Reality in Gaming Market by Type (2018-2032)
4.1 Virtual Reality in Gaming Market Snapshot and Growth Engine
4.2 Market Overview
4.3 Software
4.3.1 Introduction and Market Overview
4.3.2 Historic and Forecasted Market Size in Value USD and Volume Units
4.3.3 Key Market Trends, Growth Factors, and Opportunities
4.3.4 Geographic Segmentation Analysis
4.4 Hardware
Chapter 5: Virtual Reality in Gaming Market by Connecting Device (2018-2032)
5.1 Virtual Reality in Gaming Market Snapshot and Growth Engine
5.2 Market Overview
5.3 Gaming Console
5.3.1 Introduction and Market Overview
5.3.2 Historic and Forecasted Market Size in Value USD and Volume Units
5.3.3 Key Market Trends, Growth Factors, and Opportunities
5.3.4 Geographic Segmentation Analysis
5.4 PC/Desktop
5.5 Smartphone
Chapter 6: Virtual Reality in Gaming Market by Material (2018-2032)
6.1 Virtual Reality in Gaming Market Snapshot and Growth Engine
6.2 Market Overview
6.3 Commercial Space
6.3.1 Introduction and Market Overview
6.3.2 Historic and Forecasted Market Size in Value USD and Volume Units
6.3.3 Key Market Trends, Growth Factors, and Opportunities
6.3.4 Geographic Segmentation Analysis
6.4 Individual
Chapter 7: Company Profiles and Competitive Analysis
7.1 Competitive Landscape
7.1.1 Competitive Benchmarking
7.1.2 Virtual Reality in Gaming Market Share by Manufacturer (2024)
7.1.3 Industry BCG Matrix
7.1.4 Heat Map Analysis
7.1.5 Mergers and Acquisitions
7.2 ACCENTURE
7.2.1 Company Overview
7.2.2 Key Executives
7.2.3 Company Snapshot
7.2.4 Role of the Company in the Market
7.2.5 Sustainability and Social Responsibility
7.2.6 Operating Business Segments
7.2.7 Product Portfolio
7.2.8 Business Performance
7.2.9 Key Strategic Moves and Recent Developments
7.2.10 SWOT Analysis
7.3 GENERATION 10 LTD ALLEGRO DEVELOPMENT CORPORATION
7.4 AMPHORA INC BRADY TECHNOLOGIES
7.5 TRIPLE POINT TECHNOLOGY INC OPENLINK LLC COMFIN SOFTWARE
7.6 EKA SOFTWARE SOLUTIONS
7.7 SAP SE
7.8 SAPIENT
7.9 ENUIT LLC
7.10 CONTIGO SOFTWARE LTD VENTYX
7.11 TRAYPORT
7.12 CALVUS
7.13 FIS
7.14 PREVISE SYSTEMS GMBH AND OTHERS MAJOR PLAYERS
Chapter 8: Global Virtual Reality in Gaming Market By Region
8.1 Overview
8.2. North America Virtual Reality in Gaming Market
8.2.1 Key Market Trends, Growth Factors and Opportunities
8.2.2 Top Key Companies
8.2.3 Historic and Forecasted Market Size by Segments
8.2.4 Historic and Forecasted Market Size by Type
8.2.4.1 Software
8.2.4.2 Hardware
8.2.5 Historic and Forecasted Market Size by Connecting Device
8.2.5.1 Gaming Console
8.2.5.2 PC/Desktop
8.2.5.3 Smartphone
8.2.6 Historic and Forecasted Market Size by Material
8.2.6.1 Commercial Space
8.2.6.2 Individual
8.2.7 Historic and Forecast Market Size by Country
8.2.7.1 US
8.2.7.2 Canada
8.2.7.3 Mexico
8.3. Eastern Europe Virtual Reality in Gaming Market
8.3.1 Key Market Trends, Growth Factors and Opportunities
8.3.2 Top Key Companies
8.3.3 Historic and Forecasted Market Size by Segments
8.3.4 Historic and Forecasted Market Size by Type
8.3.4.1 Software
8.3.4.2 Hardware
8.3.5 Historic and Forecasted Market Size by Connecting Device
8.3.5.1 Gaming Console
8.3.5.2 PC/Desktop
8.3.5.3 Smartphone
8.3.6 Historic and Forecasted Market Size by Material
8.3.6.1 Commercial Space
8.3.6.2 Individual
8.3.7 Historic and Forecast Market Size by Country
8.3.7.1 Russia
8.3.7.2 Bulgaria
8.3.7.3 The Czech Republic
8.3.7.4 Hungary
8.3.7.5 Poland
8.3.7.6 Romania
8.3.7.7 Rest of Eastern Europe
8.4. Western Europe Virtual Reality in Gaming Market
8.4.1 Key Market Trends, Growth Factors and Opportunities
8.4.2 Top Key Companies
8.4.3 Historic and Forecasted Market Size by Segments
8.4.4 Historic and Forecasted Market Size by Type
8.4.4.1 Software
8.4.4.2 Hardware
8.4.5 Historic and Forecasted Market Size by Connecting Device
8.4.5.1 Gaming Console
8.4.5.2 PC/Desktop
8.4.5.3 Smartphone
8.4.6 Historic and Forecasted Market Size by Material
8.4.6.1 Commercial Space
8.4.6.2 Individual
8.4.7 Historic and Forecast Market Size by Country
8.4.7.1 Germany
8.4.7.2 UK
8.4.7.3 France
8.4.7.4 The Netherlands
8.4.7.5 Italy
8.4.7.6 Spain
8.4.7.7 Rest of Western Europe
8.5. Asia Pacific Virtual Reality in Gaming Market
8.5.1 Key Market Trends, Growth Factors and Opportunities
8.5.2 Top Key Companies
8.5.3 Historic and Forecasted Market Size by Segments
8.5.4 Historic and Forecasted Market Size by Type
8.5.4.1 Software
8.5.4.2 Hardware
8.5.5 Historic and Forecasted Market Size by Connecting Device
8.5.5.1 Gaming Console
8.5.5.2 PC/Desktop
8.5.5.3 Smartphone
8.5.6 Historic and Forecasted Market Size by Material
8.5.6.1 Commercial Space
8.5.6.2 Individual
8.5.7 Historic and Forecast Market Size by Country
8.5.7.1 China
8.5.7.2 India
8.5.7.3 Japan
8.5.7.4 South Korea
8.5.7.5 Malaysia
8.5.7.6 Thailand
8.5.7.7 Vietnam
8.5.7.8 The Philippines
8.5.7.9 Australia
8.5.7.10 New Zealand
8.5.7.11 Rest of APAC
8.6. Middle East & Africa Virtual Reality in Gaming Market
8.6.1 Key Market Trends, Growth Factors and Opportunities
8.6.2 Top Key Companies
8.6.3 Historic and Forecasted Market Size by Segments
8.6.4 Historic and Forecasted Market Size by Type
8.6.4.1 Software
8.6.4.2 Hardware
8.6.5 Historic and Forecasted Market Size by Connecting Device
8.6.5.1 Gaming Console
8.6.5.2 PC/Desktop
8.6.5.3 Smartphone
8.6.6 Historic and Forecasted Market Size by Material
8.6.6.1 Commercial Space
8.6.6.2 Individual
8.6.7 Historic and Forecast Market Size by Country
8.6.7.1 Turkiye
8.6.7.2 Bahrain
8.6.7.3 Kuwait
8.6.7.4 Saudi Arabia
8.6.7.5 Qatar
8.6.7.6 UAE
8.6.7.7 Israel
8.6.7.8 South Africa
8.7. South America Virtual Reality in Gaming Market
8.7.1 Key Market Trends, Growth Factors and Opportunities
8.7.2 Top Key Companies
8.7.3 Historic and Forecasted Market Size by Segments
8.7.4 Historic and Forecasted Market Size by Type
8.7.4.1 Software
8.7.4.2 Hardware
8.7.5 Historic and Forecasted Market Size by Connecting Device
8.7.5.1 Gaming Console
8.7.5.2 PC/Desktop
8.7.5.3 Smartphone
8.7.6 Historic and Forecasted Market Size by Material
8.7.6.1 Commercial Space
8.7.6.2 Individual
8.7.7 Historic and Forecast Market Size by Country
8.7.7.1 Brazil
8.7.7.2 Argentina
8.7.7.3 Rest of SA
Chapter 9 Analyst Viewpoint and Conclusion
9.1 Recommendations and Concluding Analysis
9.2 Potential Market Strategies
Chapter 10 Research Methodology
10.1 Research Process
10.2 Primary Research
10.3 Secondary Research
|
Virtual Reality in Gaming Market |
|||
|
Base Year: |
2023 |
Forecast Period: |
2024-2032 |
|
Historical Data: |
2017 to 2023 |
Market Size in 2023: |
73.42 Bn. |
|
Forecast Period 2024-32 CAGR: |
25.86% |
Market Size in 2030: |
581.84 Bn. |
|
Segments Covered: |
By Type |
|
|
|
By Connecting Device |
|
||
|
By Material |
|
||
|
By Region |
|
||
|
Key Market Drivers: |
|
||
|
Key Market Restraints: |
|
||
|
Key Opportunities: |
|
||
|
Companies Covered in the report: |
|
||


