


Global Virtual Network Services Market Overview
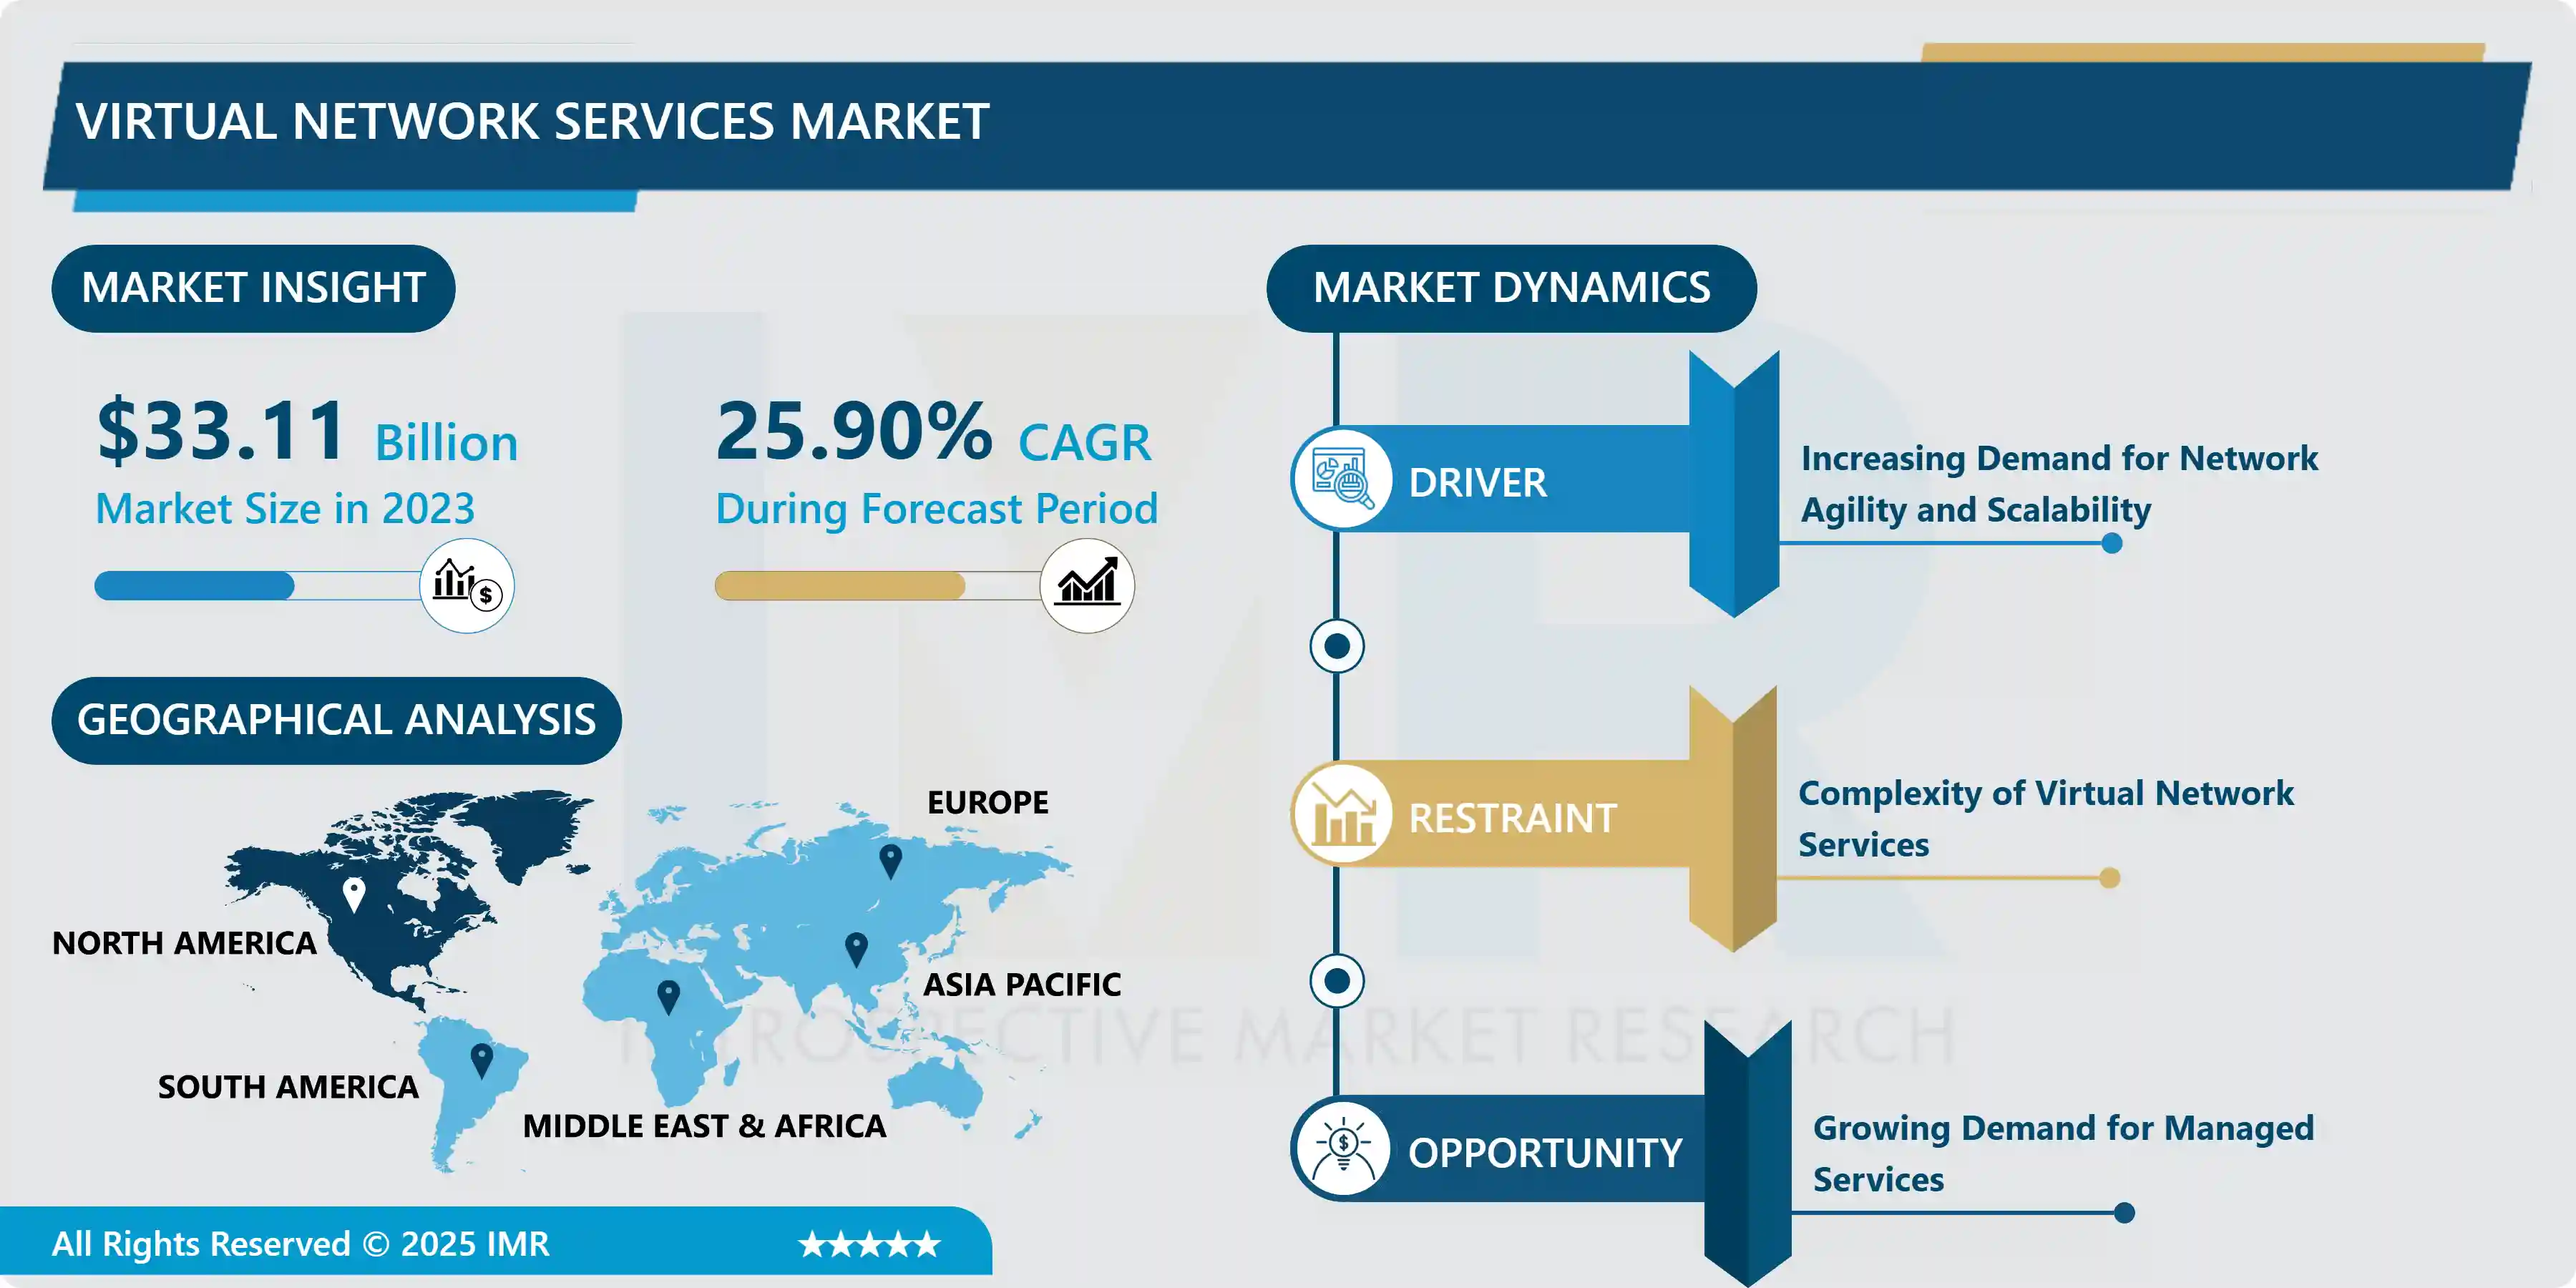
Global Virtual Network Services Market size is expected to grow from USD 33.11 Billion in 2023 to USD 263.14 Billion by 2032, at a CAGR of 25.90% during the forecast period (2024-2032)
Virtual Network Services (VNS) refer to cloud-based or software-driven solutions that offer networking functionalities and services remotely over the Internet. These services are designed to enhance and optimize network operations by providing features such as routing, security, WAN optimization, and more without relying on physical infrastructure.
Virtual network services are used in many different industries. In the business world, VNS makes it possible for distant employees to connect securely and access company resources with ease. Additionally, it simplifies network administration, making it simpler to scale and more flexible to adjust to shifting business requirements. Within the telecommunications industry, virtual network services (VNS) allow service providers to provide their clients with innovative and reasonably priced services such as network function virtualization (NFV), software-defined wide-area networks (SD-WAN), and virtual private networks (VPNs).
Virtual network services have several benefits. First of all, they provide scalability and agility, enabling networks to quickly adjust to shifting needs without requiring major hardware modifications. Second, by offering strong encryption, firewalls, and access control features, VNS improves security. Thirdly, by removing the need for significant physical hardware maintenance and updates, these services lower the cost of infrastructure. Finally, VNS encourages centralized management, making it simpler to oversee and manage network operations.
Global Virtual Network Services Market Trend Analysis:
Increasing Demand for Network Agility and Scalability
-
The surge in demand for network agility and scalability is a driving force propelling the global virtual network services market. These services bring forth a multitude of benefits, chiefly starting with their agility in configuring and managing network resources. Businesses can swiftly provision, modify, and scale their network infrastructure in response to changing business needs, ensuring adaptability in dynamic work environments and facilitating rapid adjustments to meet evolving demands.
-
Furthermore, virtual network services offer unparalleled scalability, liberating businesses from the constraints often associated with traditional physical infrastructure. This scalability accommodates expanding user bases, surges in data traffic, and the adoption of new applications, granting the flexibility to scale operations as needed without limitations.
-
Support for emerging technologies like IoT, cloud computing, and edge computing remains a pivotal strength of virtual network services. These services demonstrate the agility required to seamlessly integrate and sustain these innovations within networks. Moreover, they significantly enhance network performance and resource utilization, optimizing operational efficiency and cost-effectiveness. By dynamically allocating resources and optimizing traffic flow, businesses ensure peak performance while curbing unnecessary expenses.
-
A critical aspect driving the adoption of virtual network services is their ability to facilitate remote work and mobility trends. Particularly evident in the rise of remote workforces, these services, notably VPNs and software-defined networking (SDN), provide secure and seamless connectivity across various locations, thereby enhancing workforce management agility.
-
The evolving threat landscape necessitates adaptable and responsive security measures, an area where virtual network services excel. These services integrate advanced security features that can be swiftly updated and modified, providing a higher level of agility in addressing dynamic cybersecurity concerns. Ultimately, their capacity for cost efficiency and resource optimization by effectively utilizing resources minimizes underutilization and reduces unnecessary capital expenditures, adding further value to businesses adopting these services.
Growing Demand for Managed Services
-
The increasing demand for managed services represents a significant opportunity within the global virtual network services market. This trend stems from various factors propelling businesses to opt for outsourced network management. The preference for managed services, particularly in IT infrastructure and network management, provides a substantial avenue for providers of virtual network services. Businesses are drawn to outsourcing due to factors like cost-effectiveness, access to specialized expertise, and a desire to concentrate on core competencies.
-
Adopting managed services enables organizations to strategically allocate resources and focus on essential business operations. Entrusting expert service providers with the management, maintenance, and optimization of their virtual network infrastructure allows companies to streamline their operations efficiently.
-
The increasingly complex nature of network operations, stemming from the integration of cloud, IoT, and diverse technologies, fuels the demand for managed service providers. This complexity creates an opportunity for vendors in the virtual network services space to offer tailored solutions and specialized support services to navigate intricate network infrastructures.
-
Moreover, the round-the-clock monitoring and support included in managed services are crucial for businesses operating across various time zones or requiring uninterrupted network availability. This continuous support enhances reliability, reducing downtime, and enhancing the appeal of managed virtual network services.
-
Managed service providers also offer scalability, aligning solutions with a company's growth trajectory. This flexibility ensures businesses can swiftly adapt their network services to changing needs, crucial in today's dynamic market landscape. Additionally, these providers offer security expertise, ensuring compliance with regulatory standards, and addressing the growing need for robust security in network operations. Overall, the surge in demand for managed services offers an opportunity for the virtual network services market to deliver efficient, secure, and customized solutions while enabling businesses to focus on strategic growth.
Global Virtual Network Services Market Segment Analysis:
Virtual Network Services Market Segmented on the basis of Type and Application
By Type, Cloud-based segment is expected to dominate the market during the forecast period
-
Cloud-based virtual network services offer scalability, allowing businesses to easily scale up or down based on their requirements. This flexibility was a significant advantage compared to on-premise solutions, which often required substantial upfront investments and lacked the same degree of adaptability.
-
Cloud-based services typically follow a pay-as-you-go model, allowing companies to pay only for the resources they use. This cost-effectiveness was appealing to businesses looking to optimize expenses, especially when compared to the capital expenses associated with on-premise infrastructure.
-
Cloud-based virtual network services often provide quicker deployment times compared to on-premise solutions. They also benefit from continuous updates and innovations by service providers, allowing businesses to leverage the latest technologies more readily.
-
Cloud-based services seamlessly integrate with other cloud-based applications, supporting the integration of emerging technologies like IoT, AI, and edge computing.
By Application, Financial Services and Insurance (BFSI) segment is expected to dominate the market during the forecast period
-
The BFSI sector deals with highly sensitive financial data, making security a paramount concern. Virtual network services offer robust encryption, secure access controls, and other advanced security measures that align with the stringent security standards required by the industry.
-
The BFSI sector operates under strict regulatory frameworks, such as PCI DSS, GDPR, and others specific to financial institutions. Virtual network services aid in ensuring compliance with these regulations by providing secure data transmission, storage, and access, thus enabling financial institutions to meet industry-specific compliance requirements. With the increasing trend of remote work and the need for mobility, BFSI firms utilize virtual network services to enable secure remote access to sensitive data and applications. These services support a mobile workforce while maintaining high levels of security and compliance.
Global Virtual Network Services Market Regional Insights:
North America Region Dominate the Market
-
North America is anticipated to maintain its leadership position in the global virtual network services market owing to various influential factors. The region's robust adoption of cloud computing, with more than 80% of organizations utilizing cloud services, has surged the demand for virtual network services. This rising reliance on cloud services has spurred the need for seamless connectivity between cloud-based workloads, in-house networks, and other cloud platforms.
-
A significant driver behind North America's dominance is its hosting of major cloud service providers such as Amazon Web Services (AWS), Microsoft Azure, and Google Cloud Platform (GCP). These industry giants offer a wide spectrum of virtual network services, attracting businesses of all sizes seeking reliable and adaptable networking solutions.
-
North America's well-established and mature IT infrastructure forms a solid foundation for deploying and managing virtual network services. Moreover, businesses in the region increasingly seek networking solutions that offer flexibility and scalability, qualities readily provided by virtual network services to promptly meet evolving business demands.
-
Furthermore, North America's proactive approach towards technological advancements, especially in networking technologies like virtual network services, underscores the region's history of early adoption and innovation. This proactive stance, complemented by the strong presence of key market players specializing in software-defined networking (SDN) and network function virtualization (NFV) solutions, fortifies the region's dominance in the market.
-
Various industries in North America, including BFSI, healthcare, IT, and telecommunications, demonstrate substantial interest in virtual network services due to their scalability, security, and agility advantages. Government initiatives aimed at enhancing digital infrastructure and fostering innovation in networking technologies, coupled with stringent security and compliance standards, further solidify North America's position in the global virtual network services market.
Key Players Covered in Virtual Network Services Market:
-
Oracle Corporation (US)
-
VMware LLC (US)
-
Microsoft Corporation (US)
-
Verizon Business (US)
-
IBM Corporation (US)
-
The Hewlett Packard Enterprise (US)
-
Citrix Systems, Inc. (US)
-
Lumen Technologies, Inc. (US)
-
Cisco Systems, Inc. (US)
-
Akamai Technologies, Inc. (US)
-
Edgio, Inc. (US)
-
Equinix, Inc. (US)
-
Zayo Group Holdings, Inc. (US)
-
Digital Realty (US)
-
Rackspace Technology (US)
-
Cloudflare, Inc. (US)
-
The Colt Group (UK)
-
Deutsche Telekom AG (Germany)
-
Huawei Technologies Co., Ltd. (China)
-
Virtual Network Solutions (Malaysia), and Other Major Players
Key Industry Developments in the Global Virtual Network Services Market:
-
In January 2023, Huawei Technologies and the telecom company Etisalat UAE (e&) partnered. The 5G Portable Private Network MEC deployment and testing are the main goals of the collaboration. The business wants to offer Etisalat UAE consumers smart connectivity and cutting-edge digitalized solutions.
-
In March 2022, Oracle Cloud Infrastructure launched new services and capabilities focused on giving customers even more flexibility. Oracle Cloud Infrastructure (OCI) introduces 11 new services to enhance computer, networking, and storage capabilities, enabling faster, more secure, and cost-effective workload operations for various businesses. OCI addresses prevalent cloud misconceptions, emphasizing simplicity and flexibility without requiring application rewrites or complex pricing models.
|
Global Virtual Network Services Market |
|||
|
Base Year: |
2023 |
Forecast Period: |
2024-2032 |
|
Historical Data: |
2017 to 2023 |
Market Size in 2023: |
USD 33.11 Bn. |
|
Forecast Period 2024-32 CAGR: |
25.90% |
Market Size in 2032: |
USD 263.14 Bn. |
|
Segments Covered: |
By Type |
|
|
|
By Application |
|
||
|
By Region |
|
||
|
Key Market Drivers: |
|
||
|
Key Market Restraints: |
|
||
|
Key Opportunities: |
|
||
|
Companies Covered in the report: |
|
||
Chapter 1: Introduction
1.1 Scope and Coverage
Chapter 2:Executive Summary
Chapter 3: Market Landscape
3.1 Market Dynamics
3.1.1 Drivers
3.1.2 Restraints
3.1.3 Opportunities
3.1.4 Challenges
3.2 Market Trend Analysis
3.3 PESTLE Analysis
3.4 Porter's Five Forces Analysis
3.5 Industry Value Chain Analysis
3.6 Ecosystem
3.7 Regulatory Landscape
3.8 Price Trend Analysis
3.9 Patent Analysis
3.10 Technology Evolution
3.11 Investment Pockets
3.12 Import-Export Analysis
Chapter 4: Virtual Network Services Market by Type (2018-2032)
4.1 Virtual Network Services Market Snapshot and Growth Engine
4.2 Market Overview
4.3 On-premise
4.3.1 Introduction and Market Overview
4.3.2 Historic and Forecasted Market Size in Value USD and Volume Units
4.3.3 Key Market Trends, Growth Factors, and Opportunities
4.3.4 Geographic Segmentation Analysis
4.4 Cloud-based
Chapter 5: Virtual Network Services Market by Application (2018-2032)
5.1 Virtual Network Services Market Snapshot and Growth Engine
5.2 Market Overview
5.3 Banking
5.3.1 Introduction and Market Overview
5.3.2 Historic and Forecasted Market Size in Value USD and Volume Units
5.3.3 Key Market Trends, Growth Factors, and Opportunities
5.3.4 Geographic Segmentation Analysis
5.4 Financial Services and Insurance (BFSI)
5.5 Public Sector
5.6 Healthcare
5.7 IT
5.8 Telecommunication
Chapter 6: Company Profiles and Competitive Analysis
6.1 Competitive Landscape
6.1.1 Competitive Benchmarking
6.1.2 Virtual Network Services Market Share by Manufacturer (2024)
6.1.3 Industry BCG Matrix
6.1.4 Heat Map Analysis
6.1.5 Mergers and Acquisitions
6.2 DJI
6.2.1 Company Overview
6.2.2 Key Executives
6.2.3 Company Snapshot
6.2.4 Role of the Company in the Market
6.2.5 Sustainability and Social Responsibility
6.2.6 Operating Business Segments
6.2.7 Product Portfolio
6.2.8 Business Performance
6.2.9 Key Strategic Moves and Recent Developments
6.2.10 SWOT Analysis
6.3 MIR INNOVATION
6.4 AIRWING
6.5 MICROMULTICOPTER AERO TECHNOLOGY
6.6 PARROT
6.7 JYU
6.8 AEE
6.9 3D ROBOTICS
6.10 ASCTEC
6.11 XAIRCRAFT
6.12 ZERO TECH
6.13 AEROVIRONMENT AND OTHER MAJOR KEY PLAYERS.
Chapter 7: Global Virtual Network Services Market By Region
7.1 Overview
7.2. North America Virtual Network Services Market
7.2.1 Key Market Trends, Growth Factors and Opportunities
7.2.2 Top Key Companies
7.2.3 Historic and Forecasted Market Size by Segments
7.2.4 Historic and Forecasted Market Size by Type
7.2.4.1 On-premise
7.2.4.2 Cloud-based
7.2.5 Historic and Forecasted Market Size by Application
7.2.5.1 Banking
7.2.5.2 Financial Services and Insurance (BFSI)
7.2.5.3 Public Sector
7.2.5.4 Healthcare
7.2.5.5 IT
7.2.5.6 Telecommunication
7.2.6 Historic and Forecast Market Size by Country
7.2.6.1 US
7.2.6.2 Canada
7.2.6.3 Mexico
7.3. Eastern Europe Virtual Network Services Market
7.3.1 Key Market Trends, Growth Factors and Opportunities
7.3.2 Top Key Companies
7.3.3 Historic and Forecasted Market Size by Segments
7.3.4 Historic and Forecasted Market Size by Type
7.3.4.1 On-premise
7.3.4.2 Cloud-based
7.3.5 Historic and Forecasted Market Size by Application
7.3.5.1 Banking
7.3.5.2 Financial Services and Insurance (BFSI)
7.3.5.3 Public Sector
7.3.5.4 Healthcare
7.3.5.5 IT
7.3.5.6 Telecommunication
7.3.6 Historic and Forecast Market Size by Country
7.3.6.1 Russia
7.3.6.2 Bulgaria
7.3.6.3 The Czech Republic
7.3.6.4 Hungary
7.3.6.5 Poland
7.3.6.6 Romania
7.3.6.7 Rest of Eastern Europe
7.4. Western Europe Virtual Network Services Market
7.4.1 Key Market Trends, Growth Factors and Opportunities
7.4.2 Top Key Companies
7.4.3 Historic and Forecasted Market Size by Segments
7.4.4 Historic and Forecasted Market Size by Type
7.4.4.1 On-premise
7.4.4.2 Cloud-based
7.4.5 Historic and Forecasted Market Size by Application
7.4.5.1 Banking
7.4.5.2 Financial Services and Insurance (BFSI)
7.4.5.3 Public Sector
7.4.5.4 Healthcare
7.4.5.5 IT
7.4.5.6 Telecommunication
7.4.6 Historic and Forecast Market Size by Country
7.4.6.1 Germany
7.4.6.2 UK
7.4.6.3 France
7.4.6.4 The Netherlands
7.4.6.5 Italy
7.4.6.6 Spain
7.4.6.7 Rest of Western Europe
7.5. Asia Pacific Virtual Network Services Market
7.5.1 Key Market Trends, Growth Factors and Opportunities
7.5.2 Top Key Companies
7.5.3 Historic and Forecasted Market Size by Segments
7.5.4 Historic and Forecasted Market Size by Type
7.5.4.1 On-premise
7.5.4.2 Cloud-based
7.5.5 Historic and Forecasted Market Size by Application
7.5.5.1 Banking
7.5.5.2 Financial Services and Insurance (BFSI)
7.5.5.3 Public Sector
7.5.5.4 Healthcare
7.5.5.5 IT
7.5.5.6 Telecommunication
7.5.6 Historic and Forecast Market Size by Country
7.5.6.1 China
7.5.6.2 India
7.5.6.3 Japan
7.5.6.4 South Korea
7.5.6.5 Malaysia
7.5.6.6 Thailand
7.5.6.7 Vietnam
7.5.6.8 The Philippines
7.5.6.9 Australia
7.5.6.10 New Zealand
7.5.6.11 Rest of APAC
7.6. Middle East & Africa Virtual Network Services Market
7.6.1 Key Market Trends, Growth Factors and Opportunities
7.6.2 Top Key Companies
7.6.3 Historic and Forecasted Market Size by Segments
7.6.4 Historic and Forecasted Market Size by Type
7.6.4.1 On-premise
7.6.4.2 Cloud-based
7.6.5 Historic and Forecasted Market Size by Application
7.6.5.1 Banking
7.6.5.2 Financial Services and Insurance (BFSI)
7.6.5.3 Public Sector
7.6.5.4 Healthcare
7.6.5.5 IT
7.6.5.6 Telecommunication
7.6.6 Historic and Forecast Market Size by Country
7.6.6.1 Turkiye
7.6.6.2 Bahrain
7.6.6.3 Kuwait
7.6.6.4 Saudi Arabia
7.6.6.5 Qatar
7.6.6.6 UAE
7.6.6.7 Israel
7.6.6.8 South Africa
7.7. South America Virtual Network Services Market
7.7.1 Key Market Trends, Growth Factors and Opportunities
7.7.2 Top Key Companies
7.7.3 Historic and Forecasted Market Size by Segments
7.7.4 Historic and Forecasted Market Size by Type
7.7.4.1 On-premise
7.7.4.2 Cloud-based
7.7.5 Historic and Forecasted Market Size by Application
7.7.5.1 Banking
7.7.5.2 Financial Services and Insurance (BFSI)
7.7.5.3 Public Sector
7.7.5.4 Healthcare
7.7.5.5 IT
7.7.5.6 Telecommunication
7.7.6 Historic and Forecast Market Size by Country
7.7.6.1 Brazil
7.7.6.2 Argentina
7.7.6.3 Rest of SA
Chapter 8 Analyst Viewpoint and Conclusion
8.1 Recommendations and Concluding Analysis
8.2 Potential Market Strategies
Chapter 9 Research Methodology
9.1 Research Process
9.2 Primary Research
9.3 Secondary Research
|
Global Virtual Network Services Market |
|||
|
Base Year: |
2023 |
Forecast Period: |
2024-2032 |
|
Historical Data: |
2017 to 2023 |
Market Size in 2023: |
USD 33.11 Bn. |
|
Forecast Period 2024-32 CAGR: |
25.90% |
Market Size in 2032: |
USD 263.14 Bn. |
|
Segments Covered: |
By Type |
|
|
|
By Application |
|
||
|
By Region |
|
||
|
Key Market Drivers: |
|
||
|
Key Market Restraints: |
|
||
|
Key Opportunities: |
|
||
|
Companies Covered in the report: |
|
||
Frequently Asked Questions :
The forecast period in the Virtual Network Services Market research report is 2024-2032.


