


Spend Analytics Market Synopsis
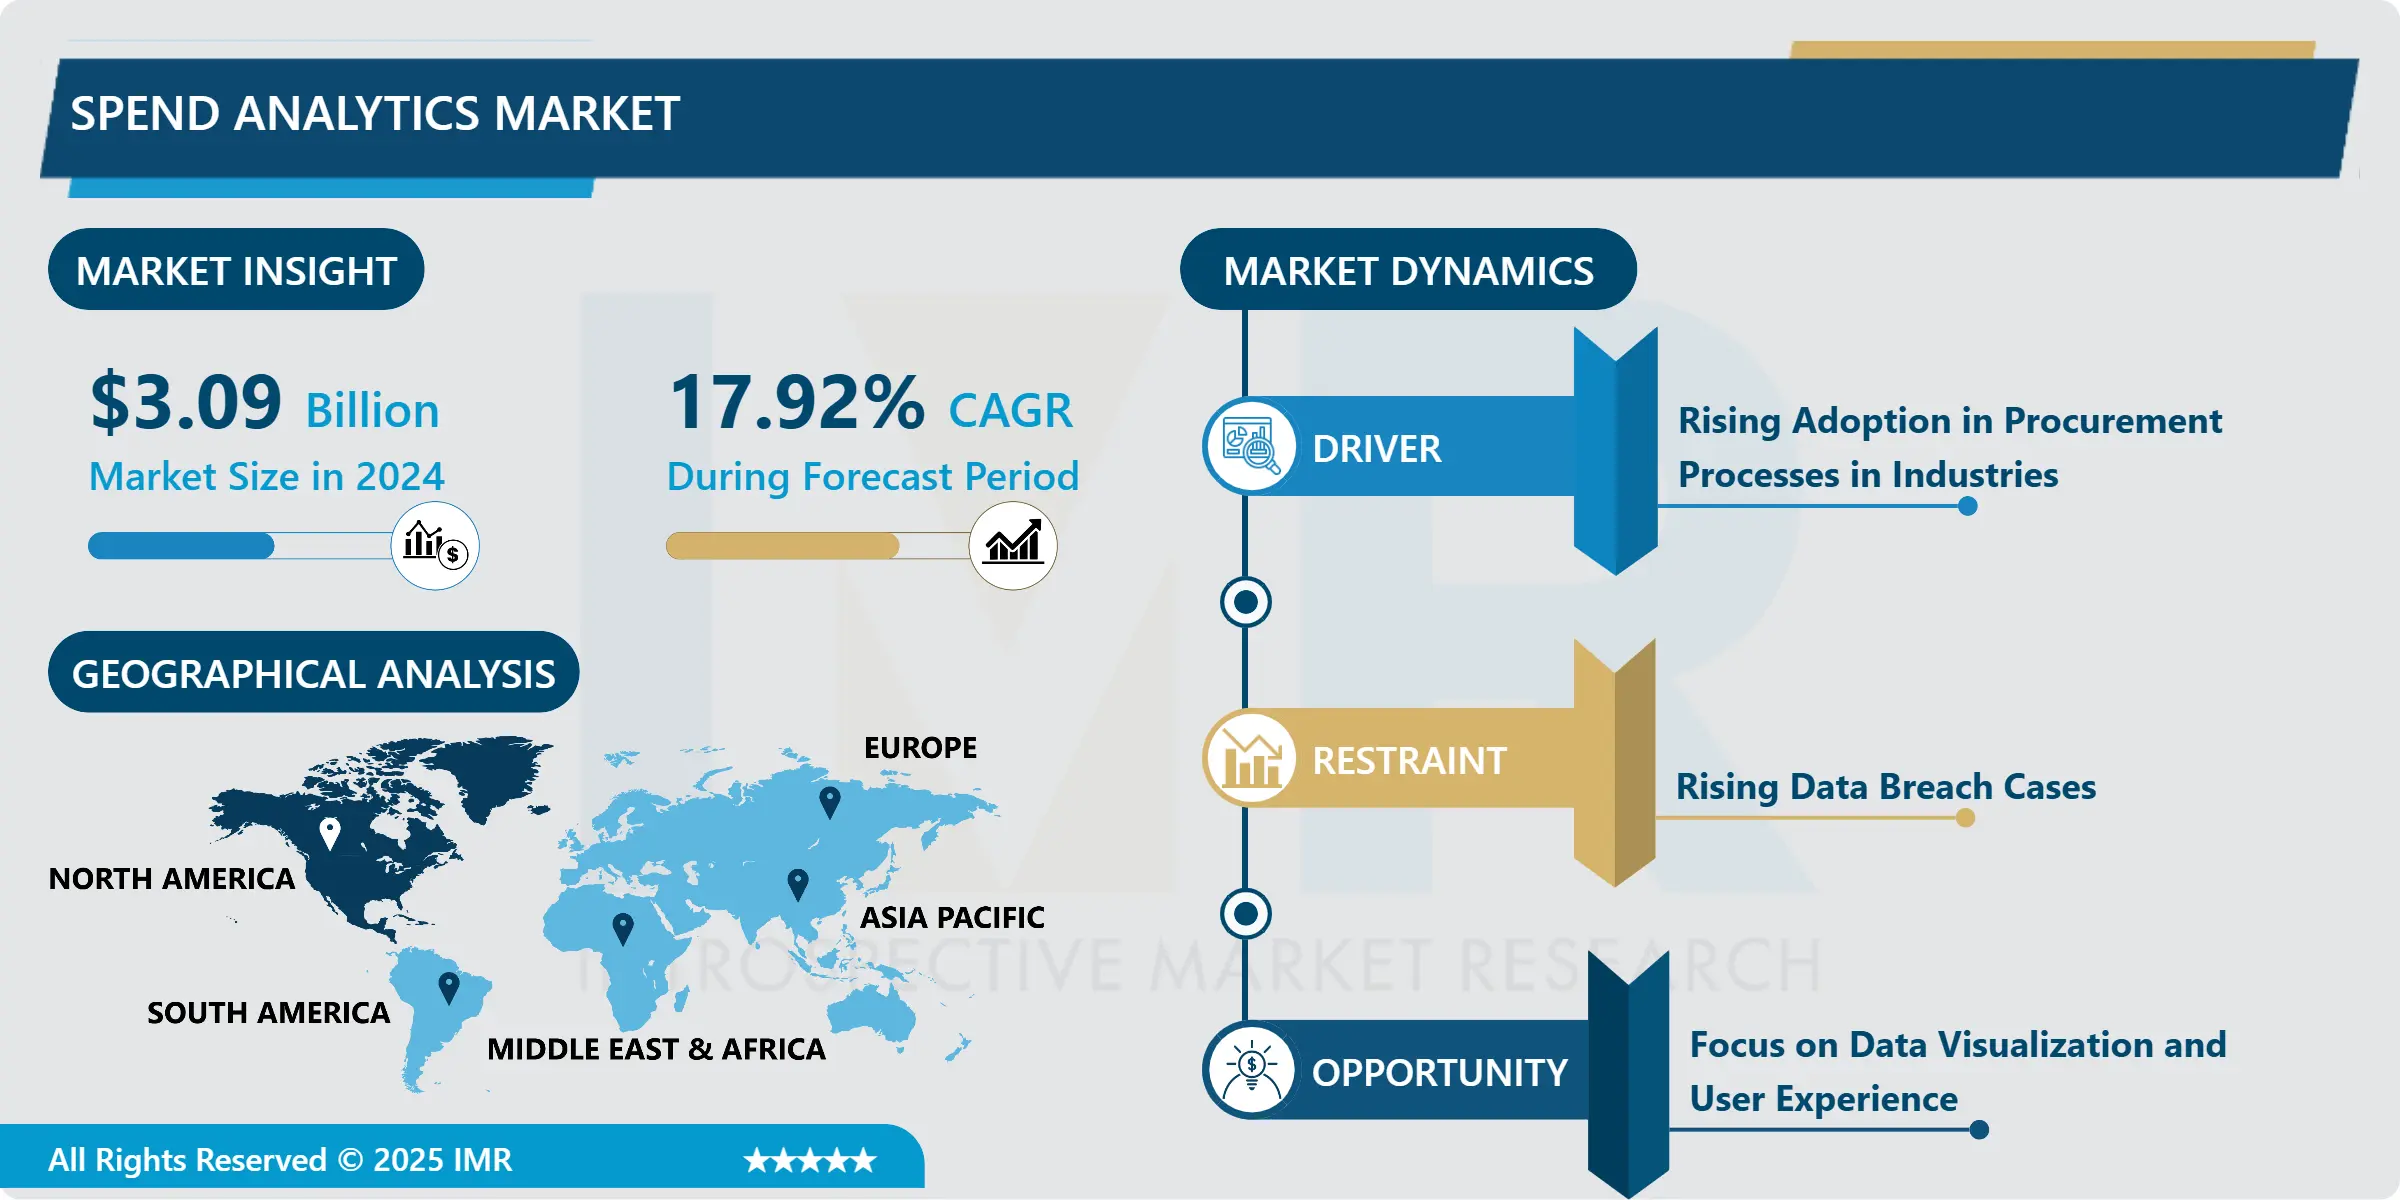
Global Spend Analytics Market Size Was Valued at USD 3.09 Billion in 2024, and is Projected to Reach USD 11.55 Billion by 2032, Growing at a CAGR of 17.92 % From 2025-2032.
Spend analytics involves gathering, categorizing, and examining procurement data to understand an organization's spending habits and costs. Through the utilization of sophisticated analytics methods like data visualization and predictive modeling, spend analytics aids companies in refining procurement tactics, pinpointing areas for cost reduction, and improving overall financial efficacy.
Spend analytics is utilized across various business operations, providing multiple benefits and promising future demand growth. It allows organizations to obtain comprehensive insights into their spending habits and expenses, enabling informed decision-making in procurement and sourcing strategies. Through the analysis of historical spending data, companies can pinpoint opportunities for cost reduction, negotiate improved contracts with suppliers, and streamline purchasing procedures to achieve enhanced efficiency and savings.
it empowers organizations to increase transparency and visibility into their financial transactions, enabling stakeholders to effectively monitor and manage spending. Additionally, by identifying instances of unauthorized spending and non-compliant purchasing behavior, spend analytics aids in mitigating risks and ensuring adherence to regulatory requirements and internal policies. Furthermore, by leveraging advanced analytics methodologies like predictive modeling and machine learning, businesses can anticipate future spending patterns, forecast market fluctuations, and proactively address potential risks and opportunities.
The future demand for spend analytics is expected to be fueled by several factors. The rise of globalization and the digitization of business processes have led to the generation of large volumes of procurement data, necessitating advanced analysis tools to derive actionable insights. Moreover, the increasing adoption of cloud-based analytics platforms and artificial intelligence technologies is democratizing access to spend analytics, making it more accessible and scalable for organizations of all sizes. Furthermore, as businesses continue to prioritize cost optimization, risk management, and compliance with regulations, the demand for sophisticated spend analytics solutions is anticipated to surge, driving innovation and transforming procurement and financial management practices
Spend Analytics Market Trend Analysis
Rising Adoption in Procurement Processes in Industries
- The increased adoption of spend analytics in procurement processes across industries acts as a significant catalyst for market growth. As businesses aim to optimize their procurement strategies and improve operational efficiency, the demand for thorough insights into spending patterns rises. Spend analytics empowers organizations to analyze and comprehend their expenditure data, enabling informed decision-making in areas such as sourcing, vendor selection, and contract negotiation. Through leveraging insights from spend analytics, businesses can uncover opportunities for cost savings, negotiate more favorable terms with suppliers, and mitigate risks linked to inefficient procurement practices.
- Furthermore, the escalating complexity of supply chains and the growing volume of transactional data emphasize the pivotal role of spend analytics in procurement. With the globalization of markets and the expansion of supplier networks, organizations encounter challenges in managing diverse supplier relationships and ensuring compliance with regulations. Spend analytics offers a comprehensive view of spending across the entire procurement lifecycle, empowering organizations to pinpoint inefficiencies, monitor supplier performance, and optimize resource allocation. This heightened visibility and control enable businesses to make data-driven decisions that drive cost reductions and operational excellence.
- Moreover, the ongoing shift towards digital transformation and the adoption of advanced analytics technologies are fueling increased adoption of spend analytics solutions. With the proliferation of cloud-based analytics platforms and artificial intelligence tools, organizations now have access to robust analytical capabilities that were previously inaccessible or costly. This democratization of analytics allows businesses of all sizes to deploy spend analytics solutions, propelling market expansion. As industries increasingly acknowledge the value of data-driven insights in procurement decision-making, the demand for spend analytics is projected to surge, fostering innovation and reshaping procurement practices across diverse sectors.
Focus on Data Visualization and User Experience
- The emphasis on data visualization and user experience stands as a significant opportunity for propelling the expansion of the Spend Analytics Market. As enterprises acknowledge the criticality of actionable insights from procurement data, there emerges an increasing need for intuitive and user-friendly analytics platforms. Data visualization assumes a pivotal role in simplifying intricate datasets and presenting them in visually engaging formats, thereby enabling users to interpret and analyze data more efficiently. Through interactive dashboards, customizable reports, and graphical depictions of spending patterns, analytics solutions elevate user experience and facilitate improved decision-making across organizational domains.
- Moreover, the focus on enhancing user experience transcends data visualization to encompass the overall usability and accessibility of spend analytics platforms. Guided by user-centric design principles, platforms prioritize the development of intuitive interfaces, streamlined workflows, and personalized user experiences tailored to the specific requirements of procurement professionals. By furnishing seamless navigation, intuitive controls, and robust search capabilities, analytics solutions empower users to effortlessly explore data and derive actionable insights with minimal exertion. This user-centric approach fosters heightened adoption and utilization of spend analytics tools within enterprises, driving enhancements in efficiency and cost savings within procurement processes.
- Furthermore, as enterprises increasingly grasp the value of user-friendly analytics solutions, vendors are channeling investments into innovation aimed at augmenting data visualization capabilities and user experience. Integration of advanced features like predictive analytics, natural language processing, and augmented reality interfaces into spend analytics platforms enriches user interactions and decision-making capabilities further. By harnessing emerging technologies and adhering to user-centric design principles, vendors can distinguish their offerings in the market and capitalize on the burgeoning demand for intuitive and impactful spend analytics solutions. the focus on data visualization and user experience presents a significant opportunity for fostering innovation and expansion in the Spend AnalyticsMarket, empowering enterprises to unleash the full potential of their procurement data.
Spend Analytics Market Segment Analysis:
Spend Analytics Market Segmented on the basis of Component, Deployment Model, Analytics Type, Organization Size, Business Function, Industry Vertical, and Region.
By Deployment Model, Cloud segment is expected to dominate the market during the forecast period
- The Cloud segment is positioned to spearhead the expansion of the Spend Analytics Market. As cloud-based solutions gain traction across various industries, there is a growing demand for cloud-centric spend analytics platforms. These platforms offer numerous benefits, such as scalability, accessibility, and cost-effectiveness, making them an appealing option for organizations aiming to streamline their procurement processes. Furthermore, cloud-based spend analytics platforms facilitate real-time data access from any location with internet connectivity, empowering users to make well-informed decisions on the fly.
- Furthermore, cloud-based solutions eliminate the necessity for extensive IT infrastructure and upkeep, thereby reducing upfront expenses and deployment timelines for organizations. This enhanced accessibility and affordability democratizes the availability of spend analytics capabilities, enabling businesses of all scales to utilize advanced analytics tools to optimize their procurement strategies. the Cloud segment is poised for substantial growth within the Spend Analytics Market, propelling innovation and reshaping the landscape of procurement analytics solutions.
By Industry Vertical, Retail segment held the largest share in 2024
- The Retail segment stands out as a leader in propelling the expansion of the Spend Analytics Market. As the retail sector undergoes rapid digitalization and faces heightened competition, there's a growing focus on utilizing data-driven insights to optimize operational efficiency and profitability. Spend analytics solutions are instrumental in empowering retailers to thoroughly analyze their procurement data, refine sourcing strategies, and pinpoint areas for cost reduction.
- Furthermore, retailers encounter distinctive challenges like fluctuating consumer demand, seasonal variations, and intricate supply chains. Spend analytics platforms equip retailers with the necessary tools to efficiently oversee procurement processes, negotiate advantageous supplier terms, and enhance inventory management practices. By leveraging spend analytics, retailers can derive actionable intelligence from their spending patterns, streamline procurement workflows, and ultimately enhance their financial performance. the Retail segment commands the largest portion of the Spend Analytics Market, underscoring the industry's growing appreciation for data-centric decision-making as a catalyst for business success.
Spend Analytics Market Regional Insights:
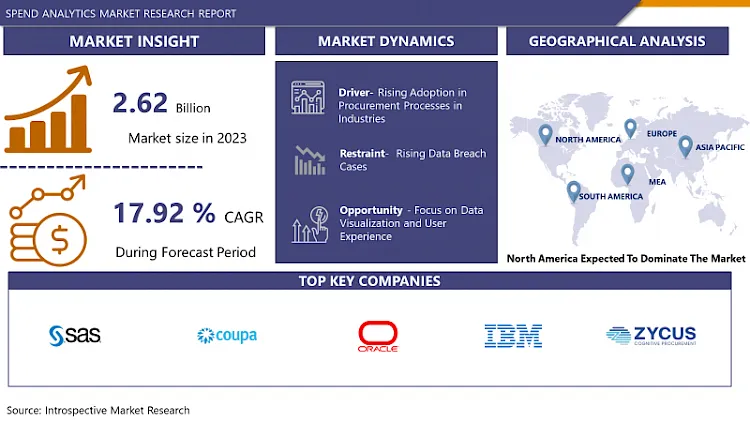
North America is Expected to Dominate the Market Over the Forecast period
- North America is positioned to lead the growth of the Spend Analytics market, supported by its robust economy, advanced technological infrastructure, and widespread adoption of data analytics solutions. The region's diverse business landscape, spanning industries like retail, healthcare, manufacturing, and finance, drives demand for sophisticated spend analytics tools to enhance procurement processes and operational efficiency.
- Furthermore, North America fosters a culture of innovation and entrepreneurship, facilitating the development of cutting-edge analytics technologies. As organizations increasingly value data-driven decision-making, the demand for spend analytics is anticipated to rise across sectors. Stringent regulatory requirements, combined with the imperative for cost optimization and risk management, further accelerate the adoption of spend analytics solutions in the region. North America is poised to shape the future of procurement analytics practices, leading the global Spend Analytics market with its innovation-driven approach.
Spend Analytics Market Top Key Players:
- SAS Institute, Inc. (U.S.)
- IBM Corporation (U.S.)
- Oracle Corporation (U.S.)
- Coupa Software Inc. (U.S.)
- Zycus Inc. (U.S.)
- JAGGAER (U.S.)
- Tradeshift (U.S.)
- Vroozi, Inc. (U.S.)
- Xeeva, Inc. (U.S.)
- Ivalua Inc. (U.S.)
- GEP Worldwide (U.S.)
- Determine Inc. (U.S.)
- BravoSolution SPA (U.S.)
- Proactis Holdings Plc (France)
- SAP SE (Germany)
- Basware Corporation (Finland)
- Proactis (UK)
- Rosslyn Analytics, Ltd. (UK)
- Tejari Solutions
- Empronc Solutions Pvt. Ltd. (India)
- Other Active Players
Key Industry Developments in the Spend Analytics Market:
- In May 2024, IBM and SAP announced their vision for expanding their collaboration, including new generative AI capabilities and industry-specific cloud solutions to help clients unlock business value. John Granger, Senior Vice President of IBM Consulting, stated that IBM and SAP's shared approach to generative AI, built on an open ecosystem, trust, and purpose-built models, would empower clients to optimize business outcomes. The new Value Generation partnership initiative aimed to enable clients to accelerate innovation, gain competitive advantage, and evolve into next-generation enterprises through the use of generative AI.
- In February 2024, Accenture acquired GemSeek, a prominent customer experience analytics provider that aids global businesses in understanding customers through insights, analytics, and AI-powered predictive models. This acquisition highlighted Accenture Song's ongoing investment—the world’s largest tech-powered creative group—in enhancing data and AI capabilities. The goal was to assist clients in growing their businesses and maintaining relevance with customers.
|
Global Spend Analytics Market |
|||
|
Base Year: |
2024 |
Forecast Period: |
2025-2032 |
|
Historical Data: |
2018 to 2023 |
Market Size in 2024: |
USD 3.09 Bn. |
|
Forecast Period 2025-32 CAGR: |
17.92% |
Market Size in 2032: |
USD 11.55 Bn. |
|
Segments Covered: |
By Type |
|
|
|
By Deployment Model |
|
||
|
By Analytics Type |
|
||
|
By Organization Size |
|
||
|
By Business Function |
|
||
|
By Industry Vertical |
|
||
|
By Region |
|
||
|
Key Market Drivers: |
|
||
|
Key Market Restraints: |
|
||
|
Key Opportunities: |
|
||
|
Companies Covered in the report: |
|
||
Chapter 1: Introduction
1.1 Scope and Coverage
Chapter 2:Executive Summary
Chapter 3: Market Landscape
3.1 Market Dynamics
3.1.1 Drivers
3.1.2 Restraints
3.1.3 Opportunities
3.1.4 Challenges
3.2 Market Trend Analysis
3.3 PESTLE Analysis
3.4 Porter's Five Forces Analysis
3.5 Industry Value Chain Analysis
3.6 Ecosystem
3.7 Regulatory Landscape
3.8 Price Trend Analysis
3.9 Patent Analysis
3.10 Technology Evolution
3.11 Investment Pockets
3.12 Import-Export Analysis
Chapter 4: Spend Analytics Market by Type (2018-2032)
4.1 Spend Analytics Market Snapshot and Growth Engine
4.2 Market Overview
4.3 Software
4.3.1 Introduction and Market Overview
4.3.2 Historic and Forecasted Market Size in Value USD and Volume Units
4.3.3 Key Market Trends, Growth Factors, and Opportunities
4.3.4 Geographic Segmentation Analysis
4.4 Services
Chapter 5: Spend Analytics Market by Deployment Model (2018-2032)
5.1 Spend Analytics Market Snapshot and Growth Engine
5.2 Market Overview
5.3 On-Premises
5.3.1 Introduction and Market Overview
5.3.2 Historic and Forecasted Market Size in Value USD and Volume Units
5.3.3 Key Market Trends, Growth Factors, and Opportunities
5.3.4 Geographic Segmentation Analysis
5.4 Cloud
Chapter 6: Spend Analytics Market by Analytics Type (2018-2032)
6.1 Spend Analytics Market Snapshot and Growth Engine
6.2 Market Overview
6.3 Predictive
6.3.1 Introduction and Market Overview
6.3.2 Historic and Forecasted Market Size in Value USD and Volume Units
6.3.3 Key Market Trends, Growth Factors, and Opportunities
6.3.4 Geographic Segmentation Analysis
6.4 Prescriptive
6.5 Descriptive
Chapter 7: Spend Analytics Market by Organization Size (2018-2032)
7.1 Spend Analytics Market Snapshot and Growth Engine
7.2 Market Overview
7.3 Small and Medium Enterprises (SMEs)
7.3.1 Introduction and Market Overview
7.3.2 Historic and Forecasted Market Size in Value USD and Volume Units
7.3.3 Key Market Trends, Growth Factors, and Opportunities
7.3.4 Geographic Segmentation Analysis
7.4 Large Enterprises
Chapter 8: Spend Analytics Market by Business Function (2018-2032)
8.1 Spend Analytics Market Snapshot and Growth Engine
8.2 Market Overview
8.3 Finance
8.3.1 Introduction and Market Overview
8.3.2 Historic and Forecasted Market Size in Value USD and Volume Units
8.3.3 Key Market Trends, Growth Factors, and Opportunities
8.3.4 Geographic Segmentation Analysis
8.4 Information Technology
8.5 Marketing
8.6 Procurement
Chapter 9: Spend Analytics Market by Industry Vertical (2018-2032)
9.1 Spend Analytics Market Snapshot and Growth Engine
9.2 Market Overview
9.3 Manufacturing
9.3.1 Introduction and Market Overview
9.3.2 Historic and Forecasted Market Size in Value USD and Volume Units
9.3.3 Key Market Trends, Growth Factors, and Opportunities
9.3.4 Geographic Segmentation Analysis
9.4 Government and defense
9.5 Retail
9.6 Healthcare and Life Sciences
9.7 BFSI
9.8 Telecommunications and IT
Chapter 10: Company Profiles and Competitive Analysis
10.1 Competitive Landscape
10.1.1 Competitive Benchmarking
10.1.2 Spend Analytics Market Share by Manufacturer (2024)
10.1.3 Industry BCG Matrix
10.1.4 Heat Map Analysis
10.1.5 Mergers and Acquisitions
10.2 COMPLETETAX (UNITED STATES)
10.2.1 Company Overview
10.2.2 Key Executives
10.2.3 Company Snapshot
10.2.4 Role of the Company in the Market
10.2.5 Sustainability and Social Responsibility
10.2.6 Operating Business Segments
10.2.7 Product Portfolio
10.2.8 Business Performance
10.2.9 Key Strategic Moves and Recent Developments
10.2.10 SWOT Analysis
10.3 H&R BLOCK (UNITED STATES)
10.4 JACKSON HEWITT (UNITED STATES)
10.5 LIBERTY TAX (UNITED STATES)
10.6 QUICKBOOKS (UNITED STATES)
10.7 TAXACT (UNITED STATES)
10.8 TAXSLAYER (UNITED STATES)
10.9 TURBOTAX (UNITED STATES)
10.10 OTHERS
10.11
Chapter 11: Global Spend Analytics Market By Region
11.1 Overview
11.2. North America Spend Analytics Market
11.2.1 Key Market Trends, Growth Factors and Opportunities
11.2.2 Top Key Companies
11.2.3 Historic and Forecasted Market Size by Segments
11.2.4 Historic and Forecasted Market Size by Type
11.2.4.1 Software
11.2.4.2 Services
11.2.5 Historic and Forecasted Market Size by Deployment Model
11.2.5.1 On-Premises
11.2.5.2 Cloud
11.2.6 Historic and Forecasted Market Size by Analytics Type
11.2.6.1 Predictive
11.2.6.2 Prescriptive
11.2.6.3 Descriptive
11.2.7 Historic and Forecasted Market Size by Organization Size
11.2.7.1 Small and Medium Enterprises (SMEs)
11.2.7.2 Large Enterprises
11.2.8 Historic and Forecasted Market Size by Business Function
11.2.8.1 Finance
11.2.8.2 Information Technology
11.2.8.3 Marketing
11.2.8.4 Procurement
11.2.9 Historic and Forecasted Market Size by Industry Vertical
11.2.9.1 Manufacturing
11.2.9.2 Government and defense
11.2.9.3 Retail
11.2.9.4 Healthcare and Life Sciences
11.2.9.5 BFSI
11.2.9.6 Telecommunications and IT
11.2.10 Historic and Forecast Market Size by Country
11.2.10.1 US
11.2.10.2 Canada
11.2.10.3 Mexico
11.3. Eastern Europe Spend Analytics Market
11.3.1 Key Market Trends, Growth Factors and Opportunities
11.3.2 Top Key Companies
11.3.3 Historic and Forecasted Market Size by Segments
11.3.4 Historic and Forecasted Market Size by Type
11.3.4.1 Software
11.3.4.2 Services
11.3.5 Historic and Forecasted Market Size by Deployment Model
11.3.5.1 On-Premises
11.3.5.2 Cloud
11.3.6 Historic and Forecasted Market Size by Analytics Type
11.3.6.1 Predictive
11.3.6.2 Prescriptive
11.3.6.3 Descriptive
11.3.7 Historic and Forecasted Market Size by Organization Size
11.3.7.1 Small and Medium Enterprises (SMEs)
11.3.7.2 Large Enterprises
11.3.8 Historic and Forecasted Market Size by Business Function
11.3.8.1 Finance
11.3.8.2 Information Technology
11.3.8.3 Marketing
11.3.8.4 Procurement
11.3.9 Historic and Forecasted Market Size by Industry Vertical
11.3.9.1 Manufacturing
11.3.9.2 Government and defense
11.3.9.3 Retail
11.3.9.4 Healthcare and Life Sciences
11.3.9.5 BFSI
11.3.9.6 Telecommunications and IT
11.3.10 Historic and Forecast Market Size by Country
11.3.10.1 Russia
11.3.10.2 Bulgaria
11.3.10.3 The Czech Republic
11.3.10.4 Hungary
11.3.10.5 Poland
11.3.10.6 Romania
11.3.10.7 Rest of Eastern Europe
11.4. Western Europe Spend Analytics Market
11.4.1 Key Market Trends, Growth Factors and Opportunities
11.4.2 Top Key Companies
11.4.3 Historic and Forecasted Market Size by Segments
11.4.4 Historic and Forecasted Market Size by Type
11.4.4.1 Software
11.4.4.2 Services
11.4.5 Historic and Forecasted Market Size by Deployment Model
11.4.5.1 On-Premises
11.4.5.2 Cloud
11.4.6 Historic and Forecasted Market Size by Analytics Type
11.4.6.1 Predictive
11.4.6.2 Prescriptive
11.4.6.3 Descriptive
11.4.7 Historic and Forecasted Market Size by Organization Size
11.4.7.1 Small and Medium Enterprises (SMEs)
11.4.7.2 Large Enterprises
11.4.8 Historic and Forecasted Market Size by Business Function
11.4.8.1 Finance
11.4.8.2 Information Technology
11.4.8.3 Marketing
11.4.8.4 Procurement
11.4.9 Historic and Forecasted Market Size by Industry Vertical
11.4.9.1 Manufacturing
11.4.9.2 Government and defense
11.4.9.3 Retail
11.4.9.4 Healthcare and Life Sciences
11.4.9.5 BFSI
11.4.9.6 Telecommunications and IT
11.4.10 Historic and Forecast Market Size by Country
11.4.10.1 Germany
11.4.10.2 UK
11.4.10.3 France
11.4.10.4 The Netherlands
11.4.10.5 Italy
11.4.10.6 Spain
11.4.10.7 Rest of Western Europe
11.5. Asia Pacific Spend Analytics Market
11.5.1 Key Market Trends, Growth Factors and Opportunities
11.5.2 Top Key Companies
11.5.3 Historic and Forecasted Market Size by Segments
11.5.4 Historic and Forecasted Market Size by Type
11.5.4.1 Software
11.5.4.2 Services
11.5.5 Historic and Forecasted Market Size by Deployment Model
11.5.5.1 On-Premises
11.5.5.2 Cloud
11.5.6 Historic and Forecasted Market Size by Analytics Type
11.5.6.1 Predictive
11.5.6.2 Prescriptive
11.5.6.3 Descriptive
11.5.7 Historic and Forecasted Market Size by Organization Size
11.5.7.1 Small and Medium Enterprises (SMEs)
11.5.7.2 Large Enterprises
11.5.8 Historic and Forecasted Market Size by Business Function
11.5.8.1 Finance
11.5.8.2 Information Technology
11.5.8.3 Marketing
11.5.8.4 Procurement
11.5.9 Historic and Forecasted Market Size by Industry Vertical
11.5.9.1 Manufacturing
11.5.9.2 Government and defense
11.5.9.3 Retail
11.5.9.4 Healthcare and Life Sciences
11.5.9.5 BFSI
11.5.9.6 Telecommunications and IT
11.5.10 Historic and Forecast Market Size by Country
11.5.10.1 China
11.5.10.2 India
11.5.10.3 Japan
11.5.10.4 South Korea
11.5.10.5 Malaysia
11.5.10.6 Thailand
11.5.10.7 Vietnam
11.5.10.8 The Philippines
11.5.10.9 Australia
11.5.10.10 New Zealand
11.5.10.11 Rest of APAC
11.6. Middle East & Africa Spend Analytics Market
11.6.1 Key Market Trends, Growth Factors and Opportunities
11.6.2 Top Key Companies
11.6.3 Historic and Forecasted Market Size by Segments
11.6.4 Historic and Forecasted Market Size by Type
11.6.4.1 Software
11.6.4.2 Services
11.6.5 Historic and Forecasted Market Size by Deployment Model
11.6.5.1 On-Premises
11.6.5.2 Cloud
11.6.6 Historic and Forecasted Market Size by Analytics Type
11.6.6.1 Predictive
11.6.6.2 Prescriptive
11.6.6.3 Descriptive
11.6.7 Historic and Forecasted Market Size by Organization Size
11.6.7.1 Small and Medium Enterprises (SMEs)
11.6.7.2 Large Enterprises
11.6.8 Historic and Forecasted Market Size by Business Function
11.6.8.1 Finance
11.6.8.2 Information Technology
11.6.8.3 Marketing
11.6.8.4 Procurement
11.6.9 Historic and Forecasted Market Size by Industry Vertical
11.6.9.1 Manufacturing
11.6.9.2 Government and defense
11.6.9.3 Retail
11.6.9.4 Healthcare and Life Sciences
11.6.9.5 BFSI
11.6.9.6 Telecommunications and IT
11.6.10 Historic and Forecast Market Size by Country
11.6.10.1 Turkiye
11.6.10.2 Bahrain
11.6.10.3 Kuwait
11.6.10.4 Saudi Arabia
11.6.10.5 Qatar
11.6.10.6 UAE
11.6.10.7 Israel
11.6.10.8 South Africa
11.7. South America Spend Analytics Market
11.7.1 Key Market Trends, Growth Factors and Opportunities
11.7.2 Top Key Companies
11.7.3 Historic and Forecasted Market Size by Segments
11.7.4 Historic and Forecasted Market Size by Type
11.7.4.1 Software
11.7.4.2 Services
11.7.5 Historic and Forecasted Market Size by Deployment Model
11.7.5.1 On-Premises
11.7.5.2 Cloud
11.7.6 Historic and Forecasted Market Size by Analytics Type
11.7.6.1 Predictive
11.7.6.2 Prescriptive
11.7.6.3 Descriptive
11.7.7 Historic and Forecasted Market Size by Organization Size
11.7.7.1 Small and Medium Enterprises (SMEs)
11.7.7.2 Large Enterprises
11.7.8 Historic and Forecasted Market Size by Business Function
11.7.8.1 Finance
11.7.8.2 Information Technology
11.7.8.3 Marketing
11.7.8.4 Procurement
11.7.9 Historic and Forecasted Market Size by Industry Vertical
11.7.9.1 Manufacturing
11.7.9.2 Government and defense
11.7.9.3 Retail
11.7.9.4 Healthcare and Life Sciences
11.7.9.5 BFSI
11.7.9.6 Telecommunications and IT
11.7.10 Historic and Forecast Market Size by Country
11.7.10.1 Brazil
11.7.10.2 Argentina
11.7.10.3 Rest of SA
Chapter 12 Analyst Viewpoint and Conclusion
12.1 Recommendations and Concluding Analysis
12.2 Potential Market Strategies
Chapter 13 Research Methodology
13.1 Research Process
13.2 Primary Research
13.3 Secondary Research
|
Global Spend Analytics Market |
|||
|
Base Year: |
2024 |
Forecast Period: |
2025-2032 |
|
Historical Data: |
2018 to 2023 |
Market Size in 2024: |
USD 3.09 Bn. |
|
Forecast Period 2025-32 CAGR: |
17.92% |
Market Size in 2032: |
USD 11.55 Bn. |
|
Segments Covered: |
By Type |
|
|
|
By Deployment Model |
|
||
|
By Analytics Type |
|
||
|
By Organization Size |
|
||
|
By Business Function |
|
||
|
By Industry Vertical |
|
||
|
By Region |
|
||
|
Key Market Drivers: |
|
||
|
Key Market Restraints: |
|
||
|
Key Opportunities: |
|
||
|
Companies Covered in the report: |
|
||


