


Global Agriculture Analytics Market Overview
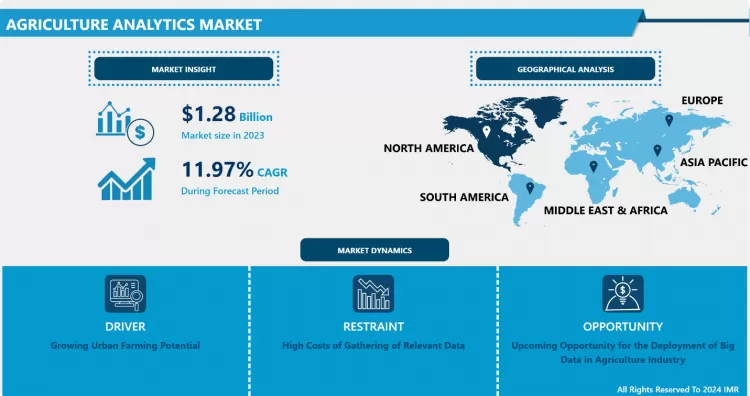
Global Agriculture Analytics Market Size Was Valued at USD 1.28 Billion In 2023 And Is Projected to Reach USD 3.54 Billion By 2032, Growing at A CAGR of 11.97% From 2024 To 2032.
Agricultural analytics is defined as the use of technologies such as IoT, big data, and other analytical tools in the agricultural sector. Smart farming is part of agricultural analytics and a breakthrough application of science and technology across agriculture. It is used widely to understand different aspects of agriculture such as irrigation and cultivation. Various technologies such as IoT, remote sensing application control, GPS, etc., are used in agricultural analytics. Agricultural analytics is designed to improve several farming techniques, using complementary technologies such as drones, satellites, and others to make better decisions. Increased food consumption and the need for fertile land are likely to boost demand. The great potential of urban farming, where people grow vegetables in their gardens and at home, could boost the growth of the market. The ability to feed local communities and the benefits of protecting crops from environmental stresses could bode well for the market. Farmers can use big data and artificial intelligence to increase their potential and significantly increase crop production.

Market Dynamics And Factors For Agriculture Analytics Market
Drivers:
Growing Urban Farming Potential
- Urban farming has become a popular trend around the world in recent decades in terms of growing food both on rooftop gardens & community plots. From providing locally grown crops to urban residents to offering various health benefits, urban farming has many advantages. By monitoring the crops closely, consumers can adhere to the existing government regulations and avoid the overuse of any chemicals in urban farming. This further leads to increased profitability as crops don’t get destroyed by any sort of chemicals, insects, or weeds. With the growing digitalization, the rapid adoption of modern farm practices is highly adopted, which boosts the market growth of agriculture analytics. Urban farming also has a positive impact on the environment in regards to improving air quality and reducing heavy rainfall runoff. Urban farming has the potential to offer a fresher product with less spoilage, and lower transportation emissions than a similar rural operation, which drives the growth of the market. Moreover, by leveraging AI and big data analytics, urban farmers can improve crop efficiency and save as much as they can, manage supply chain issues, maximize the potential of space, and improve profitability. Henceforth, owing to such potential benefits of urban farming, the market of agriculture analytics is expected to witness huge growth over the forecasted period.
Rising Demand for High-quality Food
- According to the United Nations, the world's population is projected to reach 9.8 billion by 2050, with about 83 million people adding to the world's population each year. It is also expected that the demand and consumption of crops for high-quality food, feed, and fuel will grow rapidly. This rising demand for healthy, nutritious, and high-quality food products is encouraging farmers and producers to increase crop production at prescribed times. Further, to meet these growing demands, technology providers all across the world are developing innovative solutions for the agricultural industry intending to enhance crop production and profitability. The use of IoT devices to monitor favorable weather conditions for agriculture, soils, & crops, and to manage livestock, dairy, and other modern practices will generate vast amounts of data, allowing farmers to change their offerings. Moreover, the increasing number of profitable solutions due to advances in big data, IoT, and cloud computing has a positive impact on the market growth. Therefore, the rapid rise in population accompanied by huge demand for high-quality food and increasing farmers' interest in implementing data-driven decision-making techniques are boosting the growth of the agricultural analytics market.
Restraints:
High Costs of Gathering of Relevant Data
- Adoption of satellite analytics can cushion the market demand, but the high costs of collection of relevant data as well as a huge initial capital investment are likely to hamper the market growth of agriculture analytics. The utilization of tractors & drones for navigation and mapping is very costly and can increase crop production rates. The high cost of gathering such precise data is the major factor restraining the market growth. AI technology requires high initial investments, skilled farmers, and specific farming tools, for gathering precise field data. Huge investments in GPS, GIS, and drones to collect data for variable rate application technology from satellites and other GPS devices are expensive which may limit their usage. Also, owing to the high cost of AI-based farming, as it contains data acquisition for geospatial data, the agriculture analytics market is expected to witness slow growth.
Opportunity:
Upcoming Opportunity for the Deployment of Big Data in Agriculture Industry
- Big data offers potential growth opportunities by truly revolutionizing the agricultural sector. The growth can be attributed only to having a cloud-based ecosystem along with appropriate software & tools to integrate data sources. Additionally, to cater to the pressures of growing food demand and climate change, major players are seeking assistance from technology experts such as IoT, analytics, big data, and cloud computing. Moreover, the capability of Big Data to track physical items, gather real-time data, as well as predict future scenarios can offer profitable opportunities in farming practices. Big data provides farmers with detailed data on rainfall patterns, fertilizer requirements, water cycles, etc., enabling them to make better smart decisions. The right decisions ultimately improve farm yields and thus can create a positive impact on the agriculture analytics market. Major players in the market also opt for such advanced technologies, which are projected to boost the market. For instance, Companies like John Deere have majorly integrated sensors in their agriculture equipment and deployed big data applications that will help them to better fleet management. Big Data is also helpful in optimizing the usage and ensuring the long-term health of farm equipment, and thus, deploying it in the agriculture industry will create great opportunities in the upcoming years.
Challenges:
Lack of an API Economy & Data Standards in Agriculture
- Application programming interfaces (APIs) have become a major factor in operational efficiency, scalability, and profitability for most organizations. Unfortunately, many organizations lack the adaption of API economy, and API security expertise, thus leading to downplaying the API-related risks or cyberattacks. Even the largest organizations with large security budgets are not safe from such types of attacks. This lack of expertise and absolute lack of API economics pose a major challenge to the growth of the agricultural analytics market. Moreover, the development and adaptation of various data standards is a key component of agricultural solutions. Data standards help define the structure and format of information sent and received between two or more devices. Technology has provided many tools to help farmers irrigate their land more efficiently, but due to the lack of data standards in agriculture, the growth of this market can be stunted. Merging precision farming technologies often provide various benefits in tracking their products, but the lack of data standards & interoperability between suppliers & manufacturers, create crucial challenges as dissimilar platforms and products began to multiply.
Segmentation Analysis Of Agriculture Analytics Market
- By Component, the solution segment is estimated to dominate the growth of the agriculture analytics market. The rising need for several agribusinesses to effectively analyze and collect critical farm-related data for maximizing crop production, and better decision-making is the major factor propelling the growth of this segment. Analytics solutions for agriculture enable farmers to correlate a wide range of data to gain valuable insights and improve crop productivity, further driving the market growth. The software segment is expected to grow rapidly, and this growth will be driven primarily by the ability of agricultural analytics software to manage agricultural costs and transactions and enable varied IoT devices to perform their tasks efficiently.
- By Deployment, cloud-based is the major dominating segment of the agriculture analytics market. The rapid growth of this segment is primarily due to easy access, reliable security, low maintenance, and affordability. The major advantages of the cloud provider concerning SaaS, IaaS, and PaaS for agricultural analytics contribute to the huge growth of this segment. Moreover, an increasing number of innovative solutions due to advances in big data, cloud computing, and IoT are expected to have a positive impact on the market growth.
- By Application, the livestock analytics segment is expected to dominate the agriculture analytics market. Agricultural analytics solutions and services help livestock producers make better decisions by gathering real-time information about animals and driving multiple livestock processes such as behavior monitoring and management, milk harvesting, feeding management, heat stress management, calf management, breed management, cattle sorting, and genetic management. Mismanagement of animals following their diet and tracking can cost farmers a major loss. Farmers are therefore investing in analytical solutions that help them manage the livestock production process for high-quality production, thereby boosting the growth of this segment.
Regional Analysis Of Agriculture Analytics Market
- North America is the major region that dominates the growth of the agriculture analytics market. Technological advances in traditional farming activities and improvements in farming techniques in the countries of the region are estimated to boost the growth of the regional agricultural analytics market. The huge rise in the adoption of big data IoT sensors on large farms in countries in the region, resulting in improved crop yields and efficiencies, is a major factor contributing to the rapidly growing demand for agricultural analytics. Moreover, the increasing need among farmers, traders, and distributors to enhance agricultural supply chain management with an intent to minimize waste and excess inventories propels the increased use of agricultural analytics in the North American region. Additionally, the presence of key market players such as Deere & Company, Trimble, IBM, Oracle, and Iteris is anticipated to boost the market growth of agricultural analytics in the North American region.
- The Asia Pacific is the fastest-growing region of the agriculture analytics market. This growth is largely driven by a rapidly developing economy, rapid growth in disposable incomes, high-scale infrastructure development, the presence of a tech-savvy & millennial population in the region, increasing adoption of smartphones & cloud computing, huge government support, and a developing sense of environmental responsibility. Growing food demand driven by population growth in major countries in the Asia Pacific region is boosting the steady adoption of advanced technologies such as Big data, IoT, etc., in the agricultural sector. Moreover, the increasing initiatives by the governments in this region to use advanced technologies in agriculture to maximize crop production is another factor cushioning the demand for agricultural analytics. The growing need for accurate local weather forecasts to help farmers prepare for extreme weather is further estimated to drive the market growth of agriculture analytics in the Asia Pacific region.
Top Key Players Covered In Agriculture Analytics Market
- Deere & Company (US)
- IBM (US)
- SAP SE (Germany)
- Trimble(US)
- Monsanto (US)
- Oracle (US)
- Accenture (Ireland)
- Iteris (US)
- Taranis (Israel)
- Agribotix (US)
- Agrivi (UK)
- DTN (US)
- aWhere (US)
- Conservis Corporation (US)
- DeLaval (Sweden)
- FBN (US)
- Farmers Edge (US)
- GEOSYS (US)
- Granular (US)
- Gro Intelligence (US), and other major players.
Key Industry Development In The Agriculture Analytics Market
- In March 2023, IBM announced a partnership with The Climate Corporation, a subsidiary of Monsanto, to develop and market a new agriculture analytics solution. The solution will use IBM's Watson IoT platform to collect and analyze data from a variety of sources, including weather data, soil data, and crop data. The data will be used to help farmers make better decisions about how to manage their crops.
- In January 2023, John Deere and Nutrien Ag Solutions partnered on digital connectivity. This connectivity enables both companies to better serve growers by optimizing logistics and enabling variable rate agronomic recommendations to be seamlessly transferred to their equipment for execution.
|
Global Agriculture Analytics Market |
|||
|
Base Year: |
2023 |
Forecast Period: |
2024-2032 |
|
Historical Data: |
2017 to 2023 |
Market Size in 2023: |
USD 1.28 Bn. |
|
Forecast Period 2024-32 CAGR: |
11.97% |
Market Size in 2032: |
USD 3.54 Bn. |
|
Segments Covered: |
By Component |
|
|
|
By Deployment |
|
||
|
By Application |
|
||
|
By Region |
|
||
|
Key Market Drivers: |
|
||
|
Key Market Restraints: |
|
||
|
Key Opportunities: |
|
||
|
Companies Covered in the report: |
|
||
1.1 Scope and Coverage
Chapter 2:Executive Summary
Chapter 3: Market Landscape
3.1 Market Dynamics
3.1.1 Drivers
3.1.2 Restraints
3.1.3 Opportunities
3.1.4 Challenges
3.2 Market Trend Analysis
3.3 PESTLE Analysis
3.4 Porter's Five Forces Analysis
3.5 Industry Value Chain Analysis
3.6 Ecosystem
3.7 Regulatory Landscape
3.8 Price Trend Analysis
3.9 Patent Analysis
3.10 Technology Evolution
3.11 Investment Pockets
3.12 Import-Export Analysis
Chapter 4: Agriculture Analytics Market by Component (2018-2032)
4.1 Agriculture Analytics Market Snapshot and Growth Engine
4.2 Market Overview
4.3 Solutions
4.3.1 Introduction and Market Overview
4.3.2 Historic and Forecasted Market Size in Value USD and Volume Units
4.3.3 Key Market Trends, Growth Factors, and Opportunities
4.3.4 Geographic Segmentation Analysis
4.4 Services
Chapter 5: Agriculture Analytics Market by Deployment (2018-2032)
5.1 Agriculture Analytics Market Snapshot and Growth Engine
5.2 Market Overview
5.3 On-Premise
5.3.1 Introduction and Market Overview
5.3.2 Historic and Forecasted Market Size in Value USD and Volume Units
5.3.3 Key Market Trends, Growth Factors, and Opportunities
5.3.4 Geographic Segmentation Analysis
5.4 Cloud-based
Chapter 6: Agriculture Analytics Market by Application (2018-2032)
6.1 Agriculture Analytics Market Snapshot and Growth Engine
6.2 Market Overview
6.3 Farm Analytics
6.3.1 Introduction and Market Overview
6.3.2 Historic and Forecasted Market Size in Value USD and Volume Units
6.3.3 Key Market Trends, Growth Factors, and Opportunities
6.3.4 Geographic Segmentation Analysis
6.4 Livestock Analytics
6.5 Aquaculture Analytics
6.6 Others
Chapter 7: Company Profiles and Competitive Analysis
7.1 Competitive Landscape
7.1.1 Competitive Benchmarking
7.1.2 Agriculture Analytics Market Share by Manufacturer (2024)
7.1.3 Industry BCG Matrix
7.1.4 Heat Map Analysis
7.1.5 Mergers and Acquisitions
7.2 PHILIPS SONICARE
7.2.1 Company Overview
7.2.2 Key Executives
7.2.3 Company Snapshot
7.2.4 Role of the Company in the Market
7.2.5 Sustainability and Social Responsibility
7.2.6 Operating Business Segments
7.2.7 Product Portfolio
7.2.8 Business Performance
7.2.9 Key Strategic Moves and Recent Developments
7.2.10 SWOT Analysis
7.3 ORAL-B
7.4 COLGATE
7.5 FAIRYWILL
7.6 WATERPIK
7.7 FOREO
7.8 BRUSH BABY
7.9 SMILEY360
7.10 HISMILE
7.11 QUIP
7.12 TEETH WHITENING PRODUCTS
7.13 JIANGXI SEVENFOLD
7.14 OCLEAN
7.15 PROWHITE
7.16 CARESONO
7.17 ELEKTA
7.18 BRUSHJET
7.19 BITE
7.20 SABLE
7.21 XIAOMI
7.22 AND
Chapter 8: Global Agriculture Analytics Market By Region
8.1 Overview
8.2. North America Agriculture Analytics Market
8.2.1 Key Market Trends, Growth Factors and Opportunities
8.2.2 Top Key Companies
8.2.3 Historic and Forecasted Market Size by Segments
8.2.4 Historic and Forecasted Market Size by Component
8.2.4.1 Solutions
8.2.4.2 Services
8.2.5 Historic and Forecasted Market Size by Deployment
8.2.5.1 On-Premise
8.2.5.2 Cloud-based
8.2.6 Historic and Forecasted Market Size by Application
8.2.6.1 Farm Analytics
8.2.6.2 Livestock Analytics
8.2.6.3 Aquaculture Analytics
8.2.6.4 Others
8.2.7 Historic and Forecast Market Size by Country
8.2.7.1 US
8.2.7.2 Canada
8.2.7.3 Mexico
8.3. Eastern Europe Agriculture Analytics Market
8.3.1 Key Market Trends, Growth Factors and Opportunities
8.3.2 Top Key Companies
8.3.3 Historic and Forecasted Market Size by Segments
8.3.4 Historic and Forecasted Market Size by Component
8.3.4.1 Solutions
8.3.4.2 Services
8.3.5 Historic and Forecasted Market Size by Deployment
8.3.5.1 On-Premise
8.3.5.2 Cloud-based
8.3.6 Historic and Forecasted Market Size by Application
8.3.6.1 Farm Analytics
8.3.6.2 Livestock Analytics
8.3.6.3 Aquaculture Analytics
8.3.6.4 Others
8.3.7 Historic and Forecast Market Size by Country
8.3.7.1 Russia
8.3.7.2 Bulgaria
8.3.7.3 The Czech Republic
8.3.7.4 Hungary
8.3.7.5 Poland
8.3.7.6 Romania
8.3.7.7 Rest of Eastern Europe
8.4. Western Europe Agriculture Analytics Market
8.4.1 Key Market Trends, Growth Factors and Opportunities
8.4.2 Top Key Companies
8.4.3 Historic and Forecasted Market Size by Segments
8.4.4 Historic and Forecasted Market Size by Component
8.4.4.1 Solutions
8.4.4.2 Services
8.4.5 Historic and Forecasted Market Size by Deployment
8.4.5.1 On-Premise
8.4.5.2 Cloud-based
8.4.6 Historic and Forecasted Market Size by Application
8.4.6.1 Farm Analytics
8.4.6.2 Livestock Analytics
8.4.6.3 Aquaculture Analytics
8.4.6.4 Others
8.4.7 Historic and Forecast Market Size by Country
8.4.7.1 Germany
8.4.7.2 UK
8.4.7.3 France
8.4.7.4 The Netherlands
8.4.7.5 Italy
8.4.7.6 Spain
8.4.7.7 Rest of Western Europe
8.5. Asia Pacific Agriculture Analytics Market
8.5.1 Key Market Trends, Growth Factors and Opportunities
8.5.2 Top Key Companies
8.5.3 Historic and Forecasted Market Size by Segments
8.5.4 Historic and Forecasted Market Size by Component
8.5.4.1 Solutions
8.5.4.2 Services
8.5.5 Historic and Forecasted Market Size by Deployment
8.5.5.1 On-Premise
8.5.5.2 Cloud-based
8.5.6 Historic and Forecasted Market Size by Application
8.5.6.1 Farm Analytics
8.5.6.2 Livestock Analytics
8.5.6.3 Aquaculture Analytics
8.5.6.4 Others
8.5.7 Historic and Forecast Market Size by Country
8.5.7.1 China
8.5.7.2 India
8.5.7.3 Japan
8.5.7.4 South Korea
8.5.7.5 Malaysia
8.5.7.6 Thailand
8.5.7.7 Vietnam
8.5.7.8 The Philippines
8.5.7.9 Australia
8.5.7.10 New Zealand
8.5.7.11 Rest of APAC
8.6. Middle East & Africa Agriculture Analytics Market
8.6.1 Key Market Trends, Growth Factors and Opportunities
8.6.2 Top Key Companies
8.6.3 Historic and Forecasted Market Size by Segments
8.6.4 Historic and Forecasted Market Size by Component
8.6.4.1 Solutions
8.6.4.2 Services
8.6.5 Historic and Forecasted Market Size by Deployment
8.6.5.1 On-Premise
8.6.5.2 Cloud-based
8.6.6 Historic and Forecasted Market Size by Application
8.6.6.1 Farm Analytics
8.6.6.2 Livestock Analytics
8.6.6.3 Aquaculture Analytics
8.6.6.4 Others
8.6.7 Historic and Forecast Market Size by Country
8.6.7.1 Turkiye
8.6.7.2 Bahrain
8.6.7.3 Kuwait
8.6.7.4 Saudi Arabia
8.6.7.5 Qatar
8.6.7.6 UAE
8.6.7.7 Israel
8.6.7.8 South Africa
8.7. South America Agriculture Analytics Market
8.7.1 Key Market Trends, Growth Factors and Opportunities
8.7.2 Top Key Companies
8.7.3 Historic and Forecasted Market Size by Segments
8.7.4 Historic and Forecasted Market Size by Component
8.7.4.1 Solutions
8.7.4.2 Services
8.7.5 Historic and Forecasted Market Size by Deployment
8.7.5.1 On-Premise
8.7.5.2 Cloud-based
8.7.6 Historic and Forecasted Market Size by Application
8.7.6.1 Farm Analytics
8.7.6.2 Livestock Analytics
8.7.6.3 Aquaculture Analytics
8.7.6.4 Others
8.7.7 Historic and Forecast Market Size by Country
8.7.7.1 Brazil
8.7.7.2 Argentina
8.7.7.3 Rest of SA
Chapter 9 Analyst Viewpoint and Conclusion
9.1 Recommendations and Concluding Analysis
9.2 Potential Market Strategies
Chapter 10 Research Methodology
10.1 Research Process
10.2 Primary Research
10.3 Secondary Research
|
Global Agriculture Analytics Market |
|||
|
Base Year: |
2023 |
Forecast Period: |
2024-2032 |
|
Historical Data: |
2017 to 2023 |
Market Size in 2023: |
USD 1.28 Bn. |
|
Forecast Period 2024-32 CAGR: |
11.97% |
Market Size in 2032: |
USD 3.54 Bn. |
|
Segments Covered: |
By Component |
|
|
|
By Deployment |
|
||
|
By Application |
|
||
|
By Region |
|
||
|
Key Market Drivers: |
|
||
|
Key Market Restraints: |
|
||
|
Key Opportunities: |
|
||
|
Companies Covered in the report: |
|
||
Frequently Asked Questions :
The forecast period in the Agriculture Analytics Market research report is 2024-2032.
Deere & Company (US), IBM (US), SAP SE (Germany), Trimble (US), Monsanto (US), Oracle (US), Accenture (Ireland), Iteris (US), Taranis (Israel), Agribotix (US), Agrivi (UK), DTN (US), aWhere (US), Conservis Corporation (US), DeLaval (Sweden), FBN (US), Farmers Edge (US), GEOSYS (US), Granular (US), Gro Intelligence (US), and other major players.
The Agriculture Analytics Market is segmented into component, deployment, application, and region. By Component, the market is categorized into Solutions, Services. By Deployment, the market is categorized into On-Premise, Cloud-based. By Application, the market is categorized into Farm Analytics, Livestock Analytics, Aquaculture Analytics, Others. By region, it is analyzed across North America (US; Canada; Mexico), Europe (Germany; U.K.; France; Italy; Russia; Spain, etc.), Asia-Pacific (China; India; Japan; Southeast Asia, etc.), South America (Brazil; Argentina, etc.), Middle East & Africa (Saudi Arabia; South Africa, etc.).
Agricultural analytics is defined as the use of technologies such as IoT, big data, and other analytical tools in the agricultural sector.
Global Agriculture Analytics Market Size Was Valued at USD 1.28 Billion In 2023 And Is Projected to Reach USD 3.54 Billion By 2032, Growing at A CAGR of 11.97% From 2024 To 2032.


