


Smart Materials Handling Solutions Market Synopsis
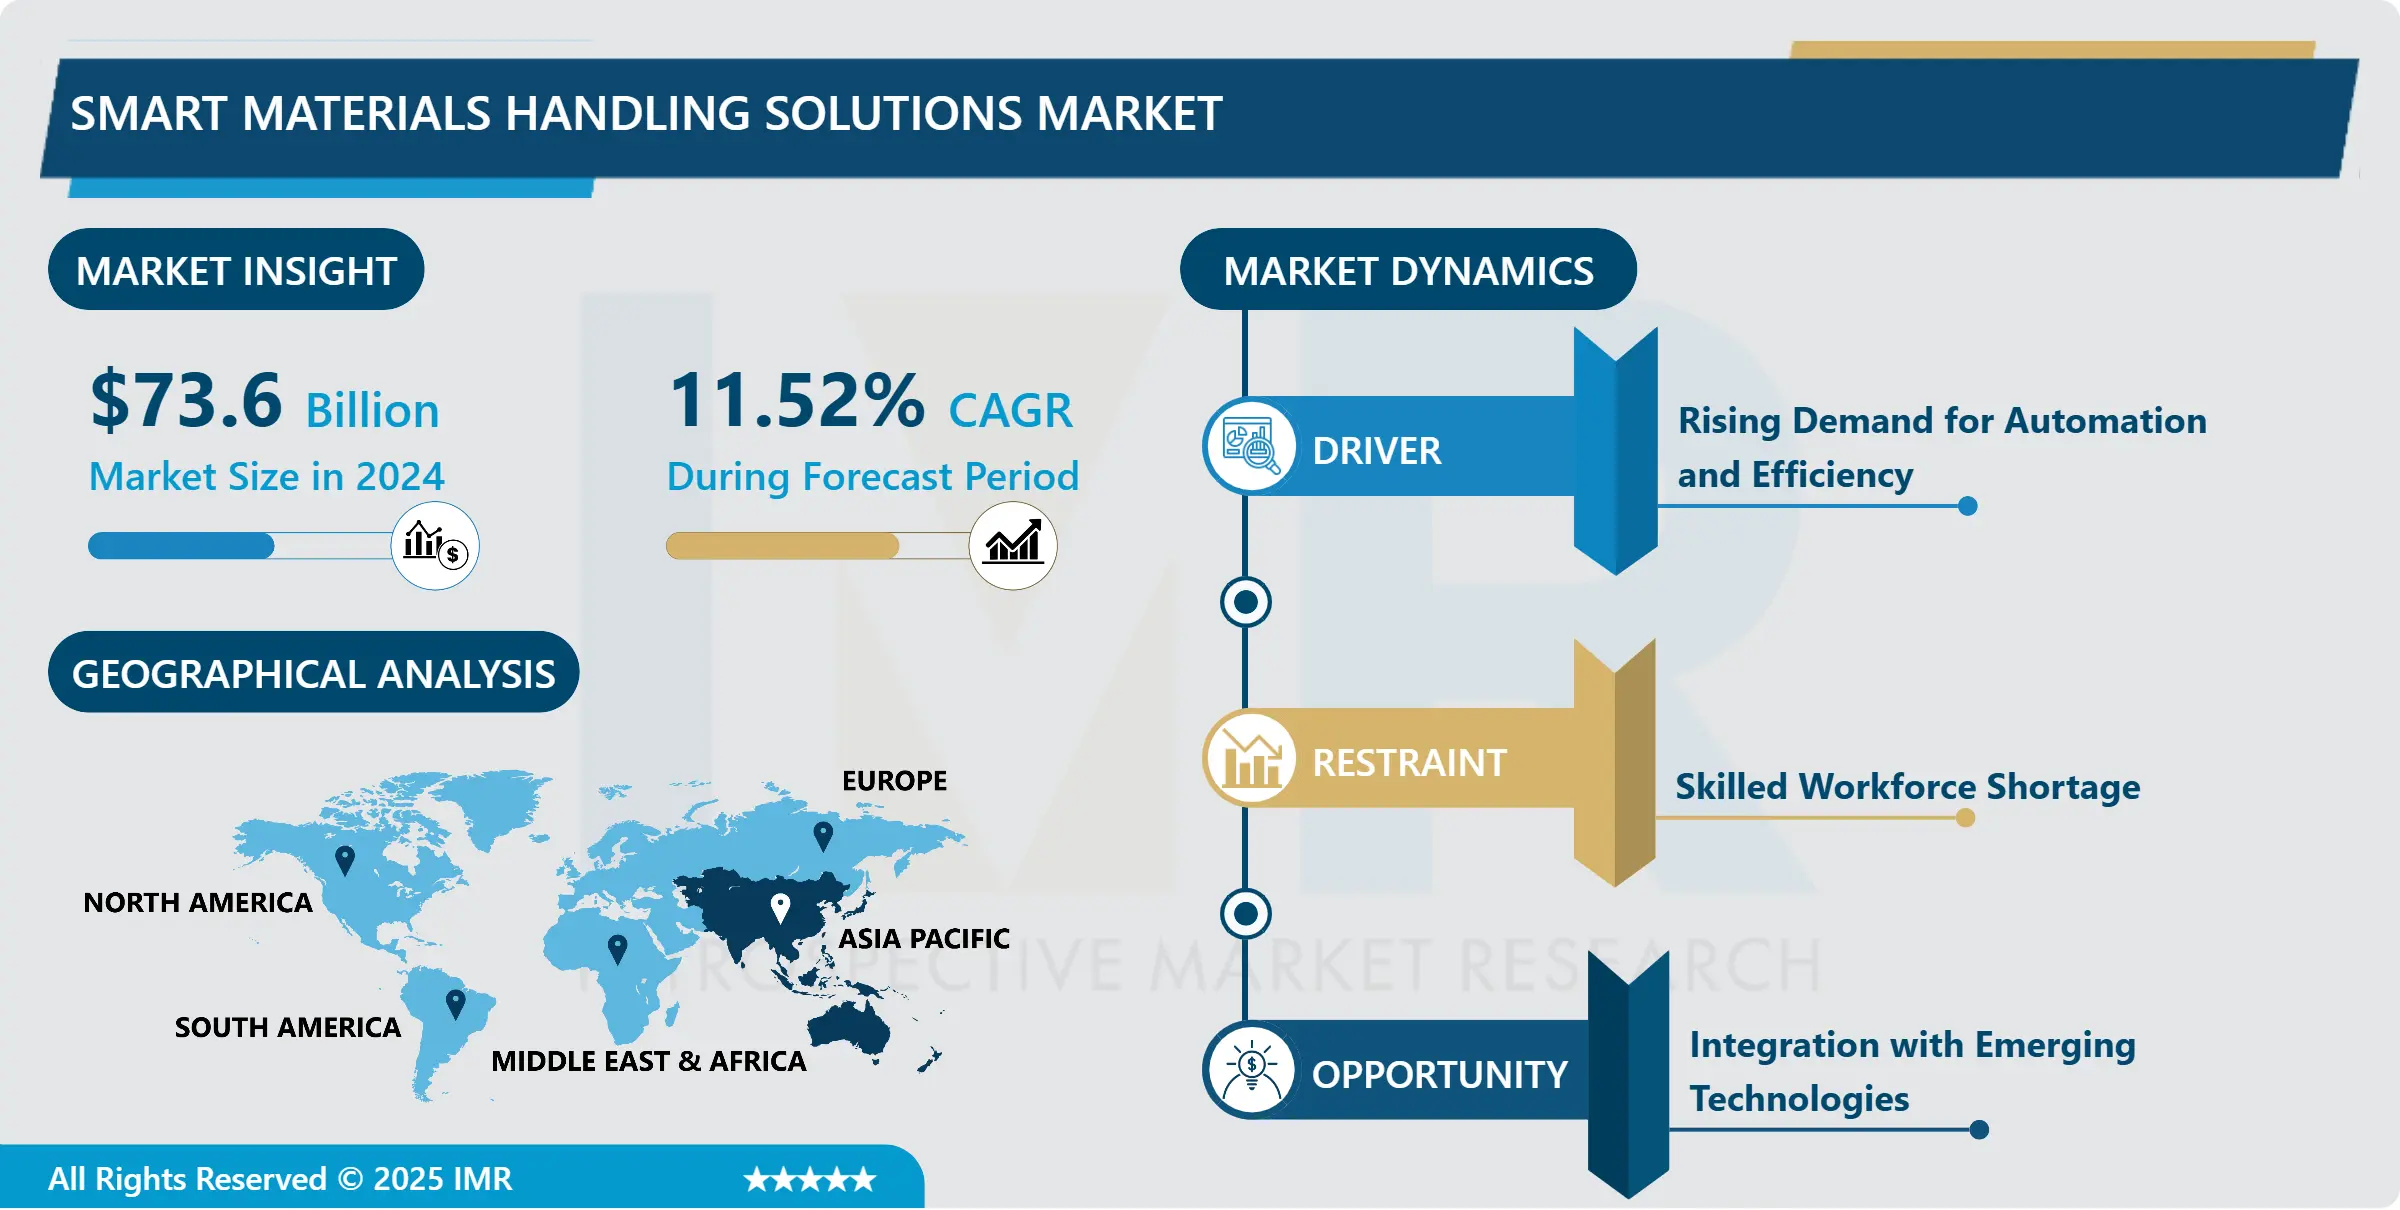
Global Smart Materials Handling Solutions Market Size Was Valued at USD 73.6 Billion in 2024, and is Projected to Reach USD 176.08 Billion by 2032, Growing at a CAGR of 11.52% From 2025-2032.
Smart materials handling solutions encompass cutting-edge technologies and systems engineered to automate and streamline the transport, storage, and retrieval of goods across diverse industries. Employing sophisticated sensors, robotics, and artificial intelligence, these solutions elevate operational efficiency, precision, and safety throughout the material handling and distribution processes within the supply chain.
Smart materials handling solutions have applications across diverse industries, transforming logistics and supply chain operations. These cutting-edge technologies are deployed in warehouses, manufacturing facilities, distribution centers, and transportation hubs to automate and optimize the movement, storage, and retrieval of goods. Through the integration of advanced sensors, robotics, and artificial intelligence, these solutions enhance efficiency, accuracy, and safety in material handling processes, ultimately boosting overall productivity and slashing operational costs.
They empower organizations to streamline workflows and achieve heightened levels of operational efficiency by automating repetitive tasks and minimizing manual labor. Secondly, these solutions bolster accuracy and precision in material handling operations, mitigating errors and reducing the risk of damage to goods. Moreover, smart materials handling solutions enhance workplace safety by diminishing the need for manual lifting and handling of heavy or hazardous materials, thus decreasing the likelihood of workplace accidents and injuries.
There is anticipated significant growth in the demand for smart materials handling solutions. As industries continue to prioritize efficiency, productivity, and safety in their operations, the adoption of these advanced technologies is poised to become increasingly widespread. Furthermore, with the ongoing trends towards digitalization and automation across industries, there will be an expanding need for smart materials handling solutions to bolster agile and responsive supply chain management. Technological advancements, such as the Internet of Things (IoT) and machine learning, will further elevate the capabilities and efficacy of these solutions, propelling continued growth and innovation in the materials handling field.

Smart Materials Handling Solutions Market Trend Analysis:
Rising Demand for Automation and Efficiency
- The surging demand for automation and efficiency emerges as a primary driver propelling the growth of the Smart Materials Handling Solutions market. Industries across various sectors, including manufacturing, logistics, and e-commerce, are increasingly turning to smart materials handling solutions to streamline their operations and enhance productivity. These innovative technologies leverage advanced sensors, robotics, and artificial intelligence to automate tasks such as material movement, storage, and retrieval, thereby reducing manual labor and minimizing errors in handling processes.
- Furthermore, the quest for improved operational efficiency is pushing organizations to adopt smart materials handling solutions to optimize their workflows. By automating repetitive tasks and integrating real-time data analytics, these solutions enable companies to achieve higher levels of efficiency, accuracy, and cost-effectiveness in their material handling operations. Additionally, smart materials handling solutions offer scalability and flexibility, allowing businesses to adapt to changing demands and maintain a competitive edge in dynamic market landscape.
- The demand for automation and efficiency in material handling is expected to continue driving the growth of the Smart Materials Handling Solutions market. As industries strive to improve productivity, reduce operational costs, and enhance customer satisfaction, the adoption of these innovative technologies will become increasingly widespread. Moreover, advancements in technology, such as the Internet of Things (IoT) and machine learning, will further enhance the capabilities and functionalities of smart materials handling solutions, fueling their adoption and contributing to market expansion in the foreseeable future.
Integration with Emerging Technologies
- The integration with emerging technologies presents a substantial opportunity for propelling the Smart Materials Handling Solutions market forward. As industries progress and adopt digital transformation, there emerges a pressing need to amalgamate smart materials handling solutions with emerging technologies to unlock novel capabilities and efficiencies. Innovations such as the Internet of Things (IoT), artificial intelligence (AI), and machine learning hold vast potential for augmenting the functionality and efficacy of materials handling systems.
- A pivotal opportunity lies in harnessing IoT-enabled sensors and devices to establish interconnected material handling systems capable of gathering and analyzing real-time data. By outfitting material handling equipment with sensors, organizations can glean valuable insights into variables such as inventory levels, equipment utilization, and operational efficiency. This data-centric approach empowers proactive decision-making and the streamlining of material handling processes, ultimately culminating in heightened productivity and reduced costs
- Moreover, the incorporation of AI and machine learning algorithms into smart materials handling solutions unveils new avenues for predictive maintenance, autonomous operation, and adaptive control. AI-driven systems possess the capability to scrutinize extensive datasets, identify patterns, prognosticate equipment failures, and refine workflow algorithms in real-time. This not only mitigates downtime and maintenance expenditures but also amplifies the agility and responsiveness of material handling operations to dynamic market conditions. As enterprises increasingly acknowledge the potential of amalgamating emerging technologies with smart materials handling solutions, the market stands poised for substantial growth and innovation in the foreseeable future.
Smart Materials Handling Solutions Market Segment Analysis:
Smart Materials Handling Solutions Market Segmented on the basis of Type, Industry and Region
By Industry, Automotive Systems segment is expected to dominate the market during the forecast period
- The Smart Materials Handling Solutions Market is set to be led by the Automotive Chain segment. As the automotive industry progressively adopts automation and efficiency-boosting technologies in its manufacturing and logistics activities, there's a heightened demand for smart materials handling solutions. These solutions incorporate cutting-edge innovations like automated guided vehicles (AGVs), robotic arms, and sensor-equipped conveyor systems, all powered by artificial intelligence to optimize material handling within automotive facilities and warehouses.
- Furthermore, the Automotive Chain segment reaps benefits from the increasing focus on lean manufacturing practices and just-in-time inventory management within the automotive sector. Smart materials handling solutions empower automotive manufacturers to streamline production processes, curtail waste, and enhance overall operational efficiency. By harnessing these advanced technologies, automotive companies can bolster their competitiveness, trim costs, and align with the evolving market demands, thereby propelling the growth of the Smart Materials Handling Solutions Market within the Automotive Chain segment
By Type, Storage and Staging Equipment segment held the largest share in 2024
- The Storage and Staging Equipment segment is set to lead the expansion of the Smart Materials Handling Solutions Market. This sector comprises various solutions aimed at optimizing the storage and staging processes within warehouses and distribution centers. With supply chains becoming increasingly intricate and the demand for efficient inventory management growing, there is a rising need for intelligent storage and staging equipment.
- These solutions encompass automated storage systems like vertical lift modules and automated storage and retrieval systems (AS/RS), along with advanced staging equipment such as conveyor systems and sortation systems. By harnessing technologies like robotics, sensors, and data analytics, these solutions empower organizations to maximize the utilization of storage space, enhance inventory visibility, and improve order fulfillment procedures. As companies endeavor to meet the requirements of e-commerce and omnichannel distribution, the Storage and Staging Equipment segment is anticipated to maintain its pivotal role in propelling the growth of the Smart Materials Handling Solutions Market.
Smart Materials Handling Solutions Market Regional Insights:
Asia Pacific is Expected to Dominate the Market Over the Forecast period
- Asia Pacific is poised to emerge as the leading region propelling the expansion of the Smart Materials Handling Solutions market. The region's rapid industrialization, urbanization, and the burgeoning e-commerce sector are driving a surging demand for efficient logistics and material handling solutions. Notably, countries such as China, India, and Japan are witnessing substantial investments in infrastructure development and automation technologies, further catalyzing market growth.
- Furthermore, the escalating adoption of smart manufacturing practices and Industry 4.0 initiatives across diverse industries in Asia Pacific is spurring the need for advanced materials handling solutions. Companies operating in sectors like automotive, electronics, retail, and e-commerce are actively investing in cutting-edge technologies such as robotics, automation, and data analytics to streamline operations and bolster productivity. Consequently, Asia Pacific is anticipated to assert dominance in the Smart Materials Handling Solutions market, presenting lucrative prospects for manufacturers and service providers across the region.
Smart Materials Handling Solutions Market Top Key Players:
- Honeywell International, Inc. (U.S.)
- Transbotics Corporation (U.S.)
- Seegrid Corporation (U.S.)
- Kion Group AG (Germany)
- Beumer Group GmbH (Germany)
- SSI Schaefer Group (Germany)
- Swisslog Holding AG (Switzerland)
- Vanderlande Industries B.V (Netherland)
- Knapp AG (Austria)
- Fives Group (France)
- Dematic Limited (UK)
- Mecalux, S.A. (Spain)
- Daifuku Co., Ltd. (Japan)
- Murata Manufacturing Co., Ltd. (Japan)
- Other Active Players.
Key Industry Developments in the Smart Materials Handling Solutions Market:
- In March 2024, Movu Robotics, a leading provider of warehouse automation solutions globally, partnered with Bastian Solutions, a Toyota Advanced Logistics company. This collaboration allowed Bastian to incorporate Movu’s range of flexible robotics technologies into its global automation solutions, including the North American market. The announcement solidified Bastian's ability to provide customers with the advantages of Movu's portfolio of flexible robotics solutions.
- In November 2023, KPI Solutions, a prominent provider of supply chain consulting, software, and automation solutions, forged a strategic alliance with Movu Robotics, previously known as Stow Robotics, a renowned global leader in warehouse automation. This partnership aimed to combine KPI's expertise in supply chain optimization with Movu Robotics' innovative warehouse automation solutions.
|
Global Smart Materials Handling Solutions Market |
|||
|
Base Year: |
2024 |
Forecast Period: |
2025-2032 |
|
Historical Data: |
2018 to 2023 |
Market Size in 2024: |
USD 73.6 Billion. |
|
Forecast Period 2025-32 CAGR: |
11.52% |
Market Size in 2032: |
USD 176.08 Billion. |
|
Segments Covered: |
By Type |
|
|
|
By Industry |
|
||
|
By Region |
|
||
|
Key Market Drivers: |
|
||
|
Key Market Restraints: |
|
||
|
Key Opportunities: |
|
||
|
Companies Covered in the report: |
|
||
Chapter 1: Introduction
1.1 Scope and Coverage
Chapter 2:Executive Summary
Chapter 3: Market Landscape
3.1 Market Dynamics
3.1.1 Drivers
3.1.2 Restraints
3.1.3 Opportunities
3.1.4 Challenges
3.2 Market Trend Analysis
3.3 PESTLE Analysis
3.4 Porter's Five Forces Analysis
3.5 Industry Value Chain Analysis
3.6 Ecosystem
3.7 Regulatory Landscape
3.8 Price Trend Analysis
3.9 Patent Analysis
3.10 Technology Evolution
3.11 Investment Pockets
3.12 Import-Export Analysis
Chapter 4: Smart Materials Handling Solutions Market by Type (2018-2032)
4.1 Smart Materials Handling Solutions Market Snapshot and Growth Engine
4.2 Market Overview
4.3 Storage and Staging Equipment
4.3.1 Introduction and Market Overview
4.3.2 Historic and Forecasted Market Size in Value USD and Volume Units
4.3.3 Key Market Trends, Growth Factors, and Opportunities
4.3.4 Geographic Segmentation Analysis
4.4 Transportation Devices
4.5 Picking Units
4.6 Sortation Systems
4.7 Information Management Systems
Chapter 5: Smart Materials Handling Solutions Market by Application (2018-2032)
5.1 Smart Materials Handling Solutions Market Snapshot and Growth Engine
5.2 Market Overview
5.3 Manufacturing
5.3.1 Introduction and Market Overview
5.3.2 Historic and Forecasted Market Size in Value USD and Volume Units
5.3.3 Key Market Trends, Growth Factors, and Opportunities
5.3.4 Geographic Segmentation Analysis
5.4 Warehousing & Logistics
5.5 E-commerce
5.6 Automotive
5.7 Food and Beverage
5.8 Healthcare
Chapter 6: Company Profiles and Competitive Analysis
6.1 Competitive Landscape
6.1.1 Competitive Benchmarking
6.1.2 Smart Materials Handling Solutions Market Share by Manufacturer (2024)
6.1.3 Industry BCG Matrix
6.1.4 Heat Map Analysis
6.1.5 Mergers and Acquisitions
6.2 ?PWC (UK)
6.2.1 Company Overview
6.2.2 Key Executives
6.2.3 Company Snapshot
6.2.4 Role of the Company in the Market
6.2.5 Sustainability and Social Responsibility
6.2.6 Operating Business Segments
6.2.7 Product Portfolio
6.2.8 Business Performance
6.2.9 Key Strategic Moves and Recent Developments
6.2.10 SWOT Analysis
6.3 L.E.K CONSULTING (UK)
6.4 ROLAND BERGER (GERMANY)
6.5 SPORT BUSINESS PARTNERS (AUSTRALIA)
6.6 DELOITTE (UK)
6.7 KPMG (NETHERLANDS)
6.8 MCKINSEY AND COMPANY (USA)
6.9 WILKINSON SPORTS ADVISORY (UK)
6.10 ASCELA (INDIA)
6.11 EY (UK)
6.12 BOSTON CONSULTING GROUP (USA)
6.13 OTHER KEY PLAYERS
6.14
Chapter 7: Global Smart Materials Handling Solutions Market By Region
7.1 Overview
7.2. North America Smart Materials Handling Solutions Market
7.2.1 Key Market Trends, Growth Factors and Opportunities
7.2.2 Top Key Companies
7.2.3 Historic and Forecasted Market Size by Segments
7.2.4 Historic and Forecasted Market Size by Type
7.2.4.1 Storage and Staging Equipment
7.2.4.2 Transportation Devices
7.2.4.3 Picking Units
7.2.4.4 Sortation Systems
7.2.4.5 Information Management Systems
7.2.5 Historic and Forecasted Market Size by Application
7.2.5.1 Manufacturing
7.2.5.2 Warehousing & Logistics
7.2.5.3 E-commerce
7.2.5.4 Automotive
7.2.5.5 Food and Beverage
7.2.5.6 Healthcare
7.2.6 Historic and Forecast Market Size by Country
7.2.6.1 US
7.2.6.2 Canada
7.2.6.3 Mexico
7.3. Eastern Europe Smart Materials Handling Solutions Market
7.3.1 Key Market Trends, Growth Factors and Opportunities
7.3.2 Top Key Companies
7.3.3 Historic and Forecasted Market Size by Segments
7.3.4 Historic and Forecasted Market Size by Type
7.3.4.1 Storage and Staging Equipment
7.3.4.2 Transportation Devices
7.3.4.3 Picking Units
7.3.4.4 Sortation Systems
7.3.4.5 Information Management Systems
7.3.5 Historic and Forecasted Market Size by Application
7.3.5.1 Manufacturing
7.3.5.2 Warehousing & Logistics
7.3.5.3 E-commerce
7.3.5.4 Automotive
7.3.5.5 Food and Beverage
7.3.5.6 Healthcare
7.3.6 Historic and Forecast Market Size by Country
7.3.6.1 Russia
7.3.6.2 Bulgaria
7.3.6.3 The Czech Republic
7.3.6.4 Hungary
7.3.6.5 Poland
7.3.6.6 Romania
7.3.6.7 Rest of Eastern Europe
7.4. Western Europe Smart Materials Handling Solutions Market
7.4.1 Key Market Trends, Growth Factors and Opportunities
7.4.2 Top Key Companies
7.4.3 Historic and Forecasted Market Size by Segments
7.4.4 Historic and Forecasted Market Size by Type
7.4.4.1 Storage and Staging Equipment
7.4.4.2 Transportation Devices
7.4.4.3 Picking Units
7.4.4.4 Sortation Systems
7.4.4.5 Information Management Systems
7.4.5 Historic and Forecasted Market Size by Application
7.4.5.1 Manufacturing
7.4.5.2 Warehousing & Logistics
7.4.5.3 E-commerce
7.4.5.4 Automotive
7.4.5.5 Food and Beverage
7.4.5.6 Healthcare
7.4.6 Historic and Forecast Market Size by Country
7.4.6.1 Germany
7.4.6.2 UK
7.4.6.3 France
7.4.6.4 The Netherlands
7.4.6.5 Italy
7.4.6.6 Spain
7.4.6.7 Rest of Western Europe
7.5. Asia Pacific Smart Materials Handling Solutions Market
7.5.1 Key Market Trends, Growth Factors and Opportunities
7.5.2 Top Key Companies
7.5.3 Historic and Forecasted Market Size by Segments
7.5.4 Historic and Forecasted Market Size by Type
7.5.4.1 Storage and Staging Equipment
7.5.4.2 Transportation Devices
7.5.4.3 Picking Units
7.5.4.4 Sortation Systems
7.5.4.5 Information Management Systems
7.5.5 Historic and Forecasted Market Size by Application
7.5.5.1 Manufacturing
7.5.5.2 Warehousing & Logistics
7.5.5.3 E-commerce
7.5.5.4 Automotive
7.5.5.5 Food and Beverage
7.5.5.6 Healthcare
7.5.6 Historic and Forecast Market Size by Country
7.5.6.1 China
7.5.6.2 India
7.5.6.3 Japan
7.5.6.4 South Korea
7.5.6.5 Malaysia
7.5.6.6 Thailand
7.5.6.7 Vietnam
7.5.6.8 The Philippines
7.5.6.9 Australia
7.5.6.10 New Zealand
7.5.6.11 Rest of APAC
7.6. Middle East & Africa Smart Materials Handling Solutions Market
7.6.1 Key Market Trends, Growth Factors and Opportunities
7.6.2 Top Key Companies
7.6.3 Historic and Forecasted Market Size by Segments
7.6.4 Historic and Forecasted Market Size by Type
7.6.4.1 Storage and Staging Equipment
7.6.4.2 Transportation Devices
7.6.4.3 Picking Units
7.6.4.4 Sortation Systems
7.6.4.5 Information Management Systems
7.6.5 Historic and Forecasted Market Size by Application
7.6.5.1 Manufacturing
7.6.5.2 Warehousing & Logistics
7.6.5.3 E-commerce
7.6.5.4 Automotive
7.6.5.5 Food and Beverage
7.6.5.6 Healthcare
7.6.6 Historic and Forecast Market Size by Country
7.6.6.1 Turkiye
7.6.6.2 Bahrain
7.6.6.3 Kuwait
7.6.6.4 Saudi Arabia
7.6.6.5 Qatar
7.6.6.6 UAE
7.6.6.7 Israel
7.6.6.8 South Africa
7.7. South America Smart Materials Handling Solutions Market
7.7.1 Key Market Trends, Growth Factors and Opportunities
7.7.2 Top Key Companies
7.7.3 Historic and Forecasted Market Size by Segments
7.7.4 Historic and Forecasted Market Size by Type
7.7.4.1 Storage and Staging Equipment
7.7.4.2 Transportation Devices
7.7.4.3 Picking Units
7.7.4.4 Sortation Systems
7.7.4.5 Information Management Systems
7.7.5 Historic and Forecasted Market Size by Application
7.7.5.1 Manufacturing
7.7.5.2 Warehousing & Logistics
7.7.5.3 E-commerce
7.7.5.4 Automotive
7.7.5.5 Food and Beverage
7.7.5.6 Healthcare
7.7.6 Historic and Forecast Market Size by Country
7.7.6.1 Brazil
7.7.6.2 Argentina
7.7.6.3 Rest of SA
Chapter 8 Analyst Viewpoint and Conclusion
8.1 Recommendations and Concluding Analysis
8.2 Potential Market Strategies
Chapter 9 Research Methodology
9.1 Research Process
9.2 Primary Research
9.3 Secondary Research
|
Global Smart Materials Handling Solutions Market |
|||
|
Base Year: |
2024 |
Forecast Period: |
2025-2032 |
|
Historical Data: |
2018 to 2023 |
Market Size in 2024: |
USD 73.6 Billion. |
|
Forecast Period 2025-32 CAGR: |
11.52% |
Market Size in 2032: |
USD 176.08 Billion. |
|
Segments Covered: |
By Type |
|
|
|
By Industry |
|
||
|
By Region |
|
||
|
Key Market Drivers: |
|
||
|
Key Market Restraints: |
|
||
|
Key Opportunities: |
|
||
|
Companies Covered in the report: |
|
||


