


Digital Advertising Market Synopsis
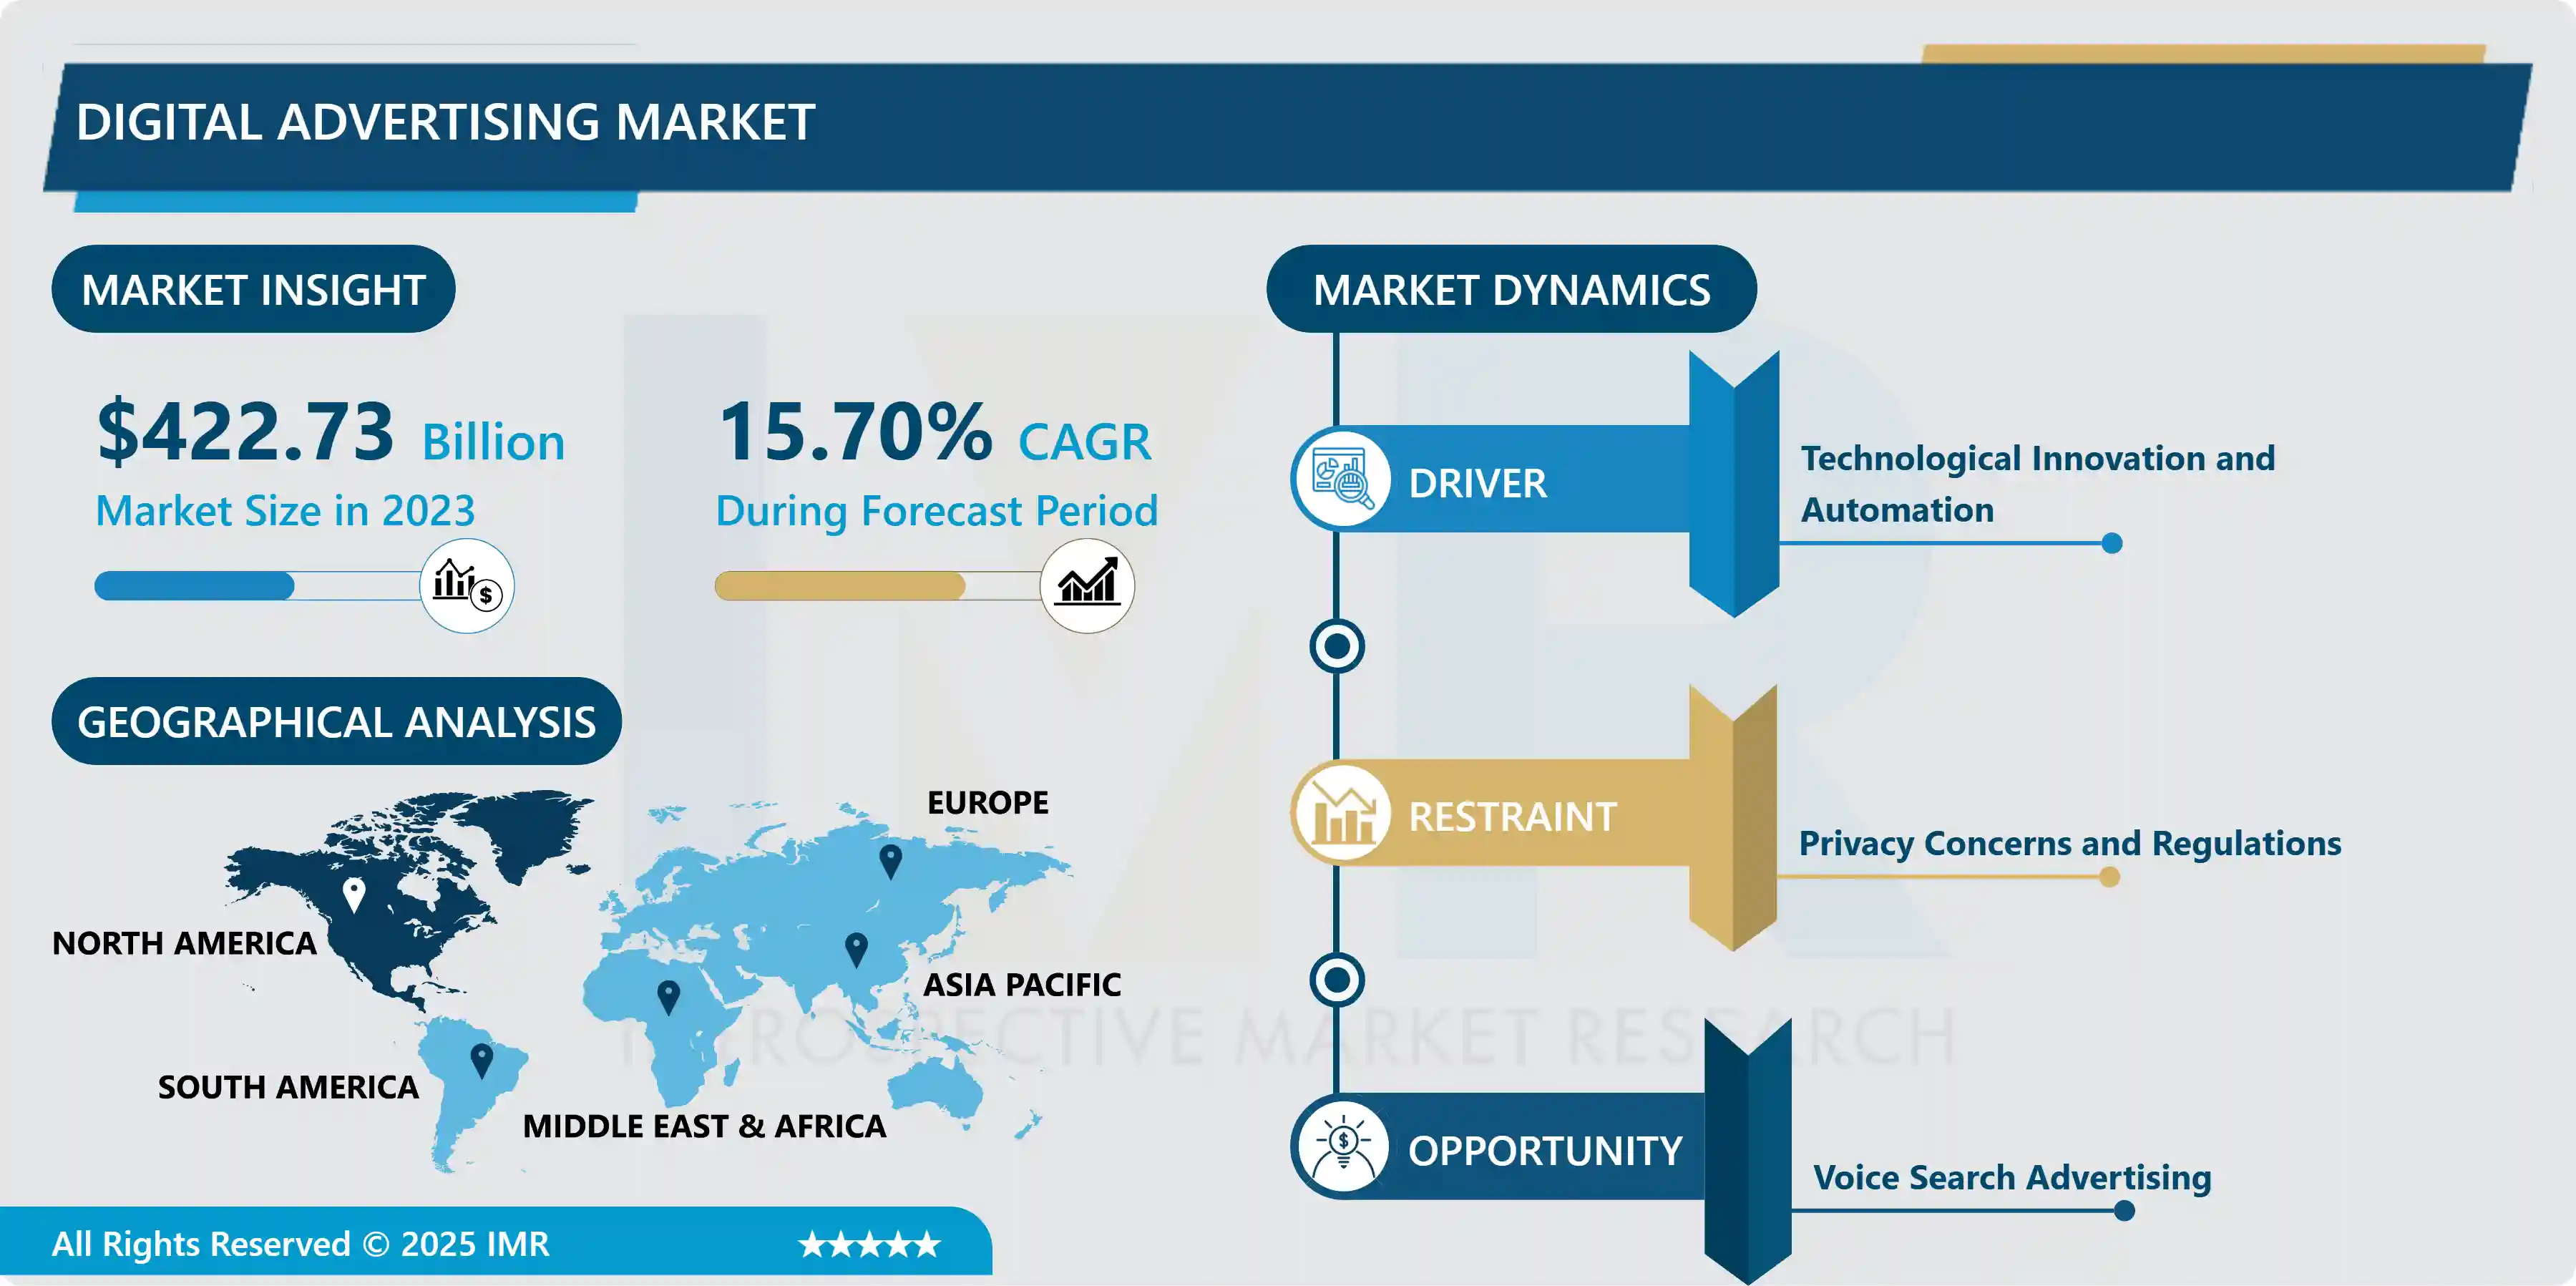
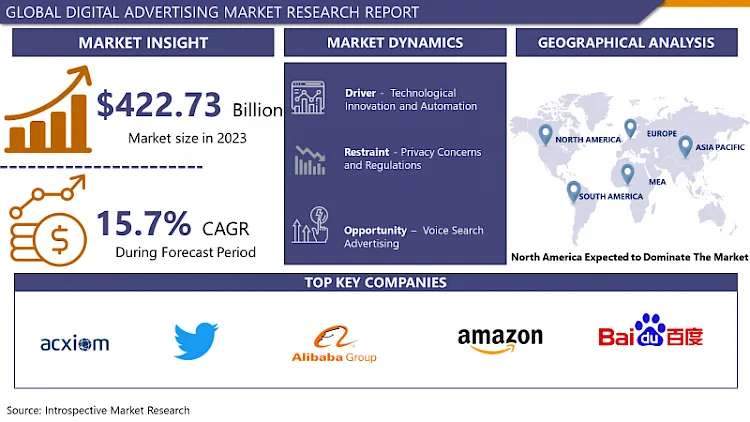
Digital Advertising Market Size Was Valued at USD 422.73 Billion in 2023 and is Projected to Reach USD 1570.59 Billion by 2032, Growing at a CAGR of 15.7% From 2024-2032.
Digital advertising deals with the marketing of products or services and brands through online media for instance sponsored sites, social networks, search engine, e-mail and portable applications. It involves many types of advertisements such as display ads, search AdWords, social media ads, emails, and many other expecting to capture the market audiences and get attention through internet markets.
- There are vast opportunities for growth of digital advertising during the passed years thanks to rapid expansion of internet connection all over the world and the usage of the Internet as the main tool for a business. This is a fast-growing industry that contains all types of ads such as display ads, social media ads, Search engine marketing, video ads and the more newly, native ads. New technological advancements such as the emergence of big data analytic sophisticated the nature of advertisement and change its methodology of how disperse and engage the audiences.
- The increase in the use of the internet as a channel for reaching customers and the rise in the use of social media platforms are some of the factors that have been instrumental in the growth of the digital advertising market. The internet has become a hub for people to spend their time and has forced advertiserurb to allocate more shares of marketing budget to the internet in order to deliver messages effectively to the potential consumers. This trend continues to go up, especially because of the increased use of mobile devices boosting the mobile advertising spend.
- Besides, the development of advertising technologies, which consistently advances and provides precise information that meets the expectations of digital advertising users. For example, programmatic advertising has come up as a revolution that uses automation to transact advertise inventories in real-time bidding. This has not only made the processes more effective but also helped the targeting abilities which let the advertisement to be placed in front of the customers at the opportune time and on the most appropriate medium.
- Internet sites such as face book, twitter, etc. are primary features of online advertising since they act as social sites where by advertisers get a large following base and advance targeting tools. Social sites such as Facebook, Instagram, Twitter, and LinkedIn target users online and offer advanced advertising techniques based on users’ information. Influencer marketing has also emerged within the extended digital advertising environment to involve brands sharing their products or services through social media influencers.
- Another form of digital advertisement that has taken root and a major force within the digital advertisement world is video advertisement. Globally, audiences are glued to their screens watching the latest videos posted on YouTube, TikTok, and streaming services, which gives advertisers just as many chances to get in touch with customers through appealing videos. Connected TV and Over-The-Top platforms have augmented the scope of video advertising; more especially, video advertisers can now reach users who are consuming content through Internet-enabled television inputs or devices.
- The following are the challenges and concerns that emerged from the studies focusing on the digital advertising market: Ad fraud, viewability challenges, and insecurity concerning brand safety remain prevalent and important problems for the industry, which does not meet advertiser expectations and demands higher transparency and effectiveness of the ad platforms and publishers. Furthermore, customer data protection laws including the GDPR and CCPA have limited the collection and utilization of consumers’ data, thus requiring organizations to approach customers and track them cautiously.
- Future perspectives suggest that the market of digital adverting will only expand further, primarily due to constant advancements of technology, changing consumer behaviors, and the increasing role of web-based media as tools within the marketing communications mix. Nevertheless, new challenges appear, including the constant changes in the governing regulations and ongoing disputes over data privacy and sharing as the foundation on which the industry develops and evolves must be earned by proving its ability to benefit all parties involved, including advertisers and consumers.
Digital Advertising Market Trend Analysis
Rising Dominance of Video Advertising
- In the context of heightened attention to the changes in the distribution of consumers’ attention in digital media, one trend has been especially noticeable: the ascendancy of video advertising. Currently, internet users are hardly leaving the video content untouched across websites, social spaces, and applications, and this has been a perfect area of influence for advertisers to reach audiences conventionally. Video advertising targets another communication platform that is engaging and more captivating than other types of advertising, especially for those firms that want to capture their audiences’ attention with striking visual images. In addition, virtually all social media, streaming services, and websites have also gotten better at hosting and playing videos hence offering multiple avenues to reach out to a certain target market.
- The ability of video to grab attention, communicate brand messages, and evoke purchase response has contributed to the increase in its adoption, and an increasing percentage of the total advertisement expenditure is revised to be spent on video. It is for this reason that it is imperative that this trend will continue to persist, as advances in technology continue to prove the indispensability of video advertising as an integral component of any marketing campaign.
Voice Search Advertising
- Voice search advertising is a relatively emerging category within a massive digital advertisement market, which signifies a rising trend of voice-controlled technologies in one people’s daily routine. Lately, with the rise of smart voice assistants like Siri, Alexa and Google Assistant, advertisers have come to realize that it would be important to adapt their current strategies to accommodate voice search queries. This includes ensuring that the advertisement content is sensitive to the conversational tone and context achieved through voice out of which techniques such as natural language processing and long-tail keyword targeting.
- While voice search helps users find information and make purchases, businesses reply on voice advertising to increase their brand awareness and user interactions in the context of alternatively developing technology. AI & ML extension add more value to the personalization & optimization aspect of the voice ad campaigns which helps the advertiser in targeting the audience in the most effective way. Therefore, there is a higher probability that voice search advertising will continue to create a more significant impact on digital advertising, thus providing brands with new chances as users shift towards voice-first experiences.
Digital Advertising Market Segment Analysis:
Digital Advertising Market Segmented based on Type, Platform Pricing Model and Industry Vertical.
By Type, Social Media segment is expected to dominate the market during the forecast period
- As the digital advertising market has been segmented by type, it is possible to establish that various kinds of platforms are observed in this context and they all have some certain function on the market. Social media still stands tall as an essential tool for advertising, The vast and unique options available are specific targeting based on users’ data and their engagement activity. Specifically, Facebook, Instagram, and Twitter can be considered examples of platforms that are actively improving the ad algorithms so that advertisers can use helpful strategies for reaching out to the target audience. The leaders include Google, which continues to hold the primary position with its pay-per-click advertising scheme and advanced targeting techniques dictated by user intent.
- Video advertising based on YouTube and TikTok makes a strong focus on the tendency of growing video consumption and provides higher advertisement impact. However, others types which have also now risen to prominence include influencer marketing and programmatic, which are also bringing about notable effects, therefore not singularizing digital advertising space. This is important because as the market changes, and the use of mobile technology develops and consumer behaviour changes, it is necessary for the advertisement to understand the differences between each type to adapt and optimize or strategy and thus, the ROI.
By End Use Sector , Hospital segment held the largest share in 2023
- In the context of huge tendentious changes in the digital advertising market, the distribution of advertising messages on different levels and channels is one of the key factors contributing to the customers’ interactions and brands’ exposure. And what has remained especially prominent in this space is the mobile platforms, which have become especially popular with new generations of devices, namely the smartphones. Mobile advertising has quickly gained popularity because most people own mobile devices due to its close proximity nature to the consumer where this device has found a more intimate position in consumers life then web. Desktop platforms are expected to stay relevant but will witness a decline in its usage compared to mobile devices; however, they are essential as they can be vital for specific user groups and business sectors where the screen size of devices or elaborated interaction is indispensable.
- Furthermore, desktop advertising can be beneficial in relative terms of visibility and shares if the content formats that have to be promoted require more time to be read or studied and might be more complicated, for instance, a large article, a multiple-element ad campaign, etc. While mobiles are small and easy to carry but have small screen, desktops have large screen but are not portable, laptops are portable with large screen and and also have powerful processors due to which; many types of advertisers come in this to reach different types of audiences in different conditions. Ad contextual advertising strategies present a complex interaction within diverse spheres of digital advertising; therefore, the differences and peculiarities of advertising in different devices: mobile, desktops, and laptops are important for advertisers to embrace while developing the appropriate strategies that will deliver a specific message to the targeted consumers with great appeal that will spur them to the intended action.
Digital Advertising Market Regional Insights:
North America is Expected to Dominate the Market Over the Forecast period
- In terms of the components of the market, it has also predicted that North America will continue its reign in the overall digital advertising market in the coming years. This is narrowed down to a number of factors such as the technological development in the region, the high levels of computer and internet usage among the consumers and the increased use in devices that are connected to the Internet. Furthermore, North America has a developed environment for digital advertising platforms, tech leaders, and emerging new ventures, which help the North American market to remain constantly progressive.
- Also, the region is home to some of the most significant vendors who have invested more resources in research and development, thus propelling the growth of digital advertising solutions. As more companies continue to embrace the use of digital platforms as key communication tools to get a hold of their audiences in the most efficient and effective manner, the market for digital advertising services in North America is projected to sustain its growth, making the region a leading giant in this young and evolving segment of the commerce industry.
Active Key Players in the Digital Advertising Market
- Acxiom Corporation -(US)
- Twitter Inc (US)
- Alibaba Group Holding Limited (CN)
- Amazon.com Inc. (US)
- Baidu Inc. – (China)
- Dentsu International – (Japan)
- Eniro AB – (Sweden)
- Epsilon Data Management LLC - (US)
- Facebook Inc. - (US)
- Google Inc. - (US)
- IAC/InterActiveCorp. - (US)
- Microsoft Corporation - (US)
- LinkedIn Corporation - (US)
- Sohu.com Inc. –( China)
- SXM Media - (US)
- Tencent Holdings Ltd. –( China)
- TradeDoubler AB – (Sweden)
- Xaxis LLC - (US)
- Verizon Media - (US)
- Other Key Players
|
Digital Advertising Market |
|||
|
Base Year: |
2023 |
Forecast Period: |
2024-2032 |
|
Historical Data: |
2017 to 2023 |
Market Size in 2023: |
USD 422.73 Bn |
|
Forecast Period 2024-32 CAGR: |
15.7% |
Market Size in 2032: |
USD 1570.59 Bn |
|
Segments Covered: |
By Type |
|
|
|
By Platform |
|
||
|
By Pricing Model |
|
||
|
By Industry Vertical |
|
||
|
By Region |
|
||
|
Key Market Drivers: |
|
||
|
Key Market Restraints: |
|
||
|
Key Opportunities: |
|
||
|
Companies Covered in the report: |
|
||
Chapter 1: Introduction
1.1 Scope and Coverage
Chapter 2:Executive Summary
Chapter 3: Market Landscape
3.1 Market Dynamics
3.1.1 Drivers
3.1.2 Restraints
3.1.3 Opportunities
3.1.4 Challenges
3.2 Market Trend Analysis
3.3 PESTLE Analysis
3.4 Porter's Five Forces Analysis
3.5 Industry Value Chain Analysis
3.6 Ecosystem
3.7 Regulatory Landscape
3.8 Price Trend Analysis
3.9 Patent Analysis
3.10 Technology Evolution
3.11 Investment Pockets
3.12 Import-Export Analysis
Chapter 4: Digital Advertising Market by Type (2018-2032)
4.1 Digital Advertising Market Snapshot and Growth Engine
4.2 Market Overview
4.3 Social Media
4.3.1 Introduction and Market Overview
4.3.2 Historic and Forecasted Market Size in Value USD and Volume Units
4.3.3 Key Market Trends, Growth Factors, and Opportunities
4.3.4 Geographic Segmentation Analysis
4.4 Search Engine
4.5 Video
4.6 Others
Chapter 5: Digital Advertising Market by Platform (2018-2032)
5.1 Digital Advertising Market Snapshot and Growth Engine
5.2 Market Overview
5.3 Mobile
5.3.1 Introduction and Market Overview
5.3.2 Historic and Forecasted Market Size in Value USD and Volume Units
5.3.3 Key Market Trends, Growth Factors, and Opportunities
5.3.4 Geographic Segmentation Analysis
5.4 Desktop
5.5 Laptop
Chapter 6: Digital Advertising Market by Pricing Model (2018-2032)
6.1 Digital Advertising Market Snapshot and Growth Engine
6.2 Market Overview
6.3 Cost Per Thousand (CPM)/Cost-Per-Mille (CPM)
6.3.1 Introduction and Market Overview
6.3.2 Historic and Forecasted Market Size in Value USD and Volume Units
6.3.3 Key Market Trends, Growth Factors, and Opportunities
6.3.4 Geographic Segmentation Analysis
6.4 Performance Based Advertising
6.5 Hybrid
6.6 Others
Chapter 7: Digital Advertising Market by Industry Vertical (2018-2032)
7.1 Digital Advertising Market Snapshot and Growth Engine
7.2 Market Overview
7.3 Retail & Consumer Goods
7.3.1 Introduction and Market Overview
7.3.2 Historic and Forecasted Market Size in Value USD and Volume Units
7.3.3 Key Market Trends, Growth Factors, and Opportunities
7.3.4 Geographic Segmentation Analysis
7.4 Automotive
7.5 Healthcare
7.6 Media & Entertainment
7.7 Education
7.8 Transport & Tourism
7.9 BFSI
7.10 IT & Telecom
7.11 Others
Chapter 8: Company Profiles and Competitive Analysis
8.1 Competitive Landscape
8.1.1 Competitive Benchmarking
8.1.2 Digital Advertising Market Share by Manufacturer (2024)
8.1.3 Industry BCG Matrix
8.1.4 Heat Map Analysis
8.1.5 Mergers and Acquisitions
8.2 CERA SANITARYWARE LIMITED (INDIA)
8.2.1 Company Overview
8.2.2 Key Executives
8.2.3 Company Snapshot
8.2.4 Role of the Company in the Market
8.2.5 Sustainability and Social Responsibility
8.2.6 Operating Business Segments
8.2.7 Product Portfolio
8.2.8 Business Performance
8.2.9 Key Strategic Moves and Recent Developments
8.2.10 SWOT Analysis
8.3 PARRYWARE LIMITED (INDIA)
8.4 JAQUAR (INDIA)
8.5 HINDWARE HOMES LIMITED (INDIA)
8.6 H & R JOHNSON (INDIA) LTD (INDIA)
8.7 AMERICAN STANDARD (UNITED STATES)
8.8 DORNBRACHT (GERMANY)
8.9 KOHLER (UNITED STATES)
8.10 HANSA GMBH (GERMANY)
8.11 DELTA (UNITED STATES)
8.12 VILLEROY & BOCH (GERMANY)
8.13 RAK CERAMICS (UNITED ARAB EMIRATES)
8.14 ???????OTHERS
Chapter 9: Global Digital Advertising Market By Region
9.1 Overview
9.2. North America Digital Advertising Market
9.2.1 Key Market Trends, Growth Factors and Opportunities
9.2.2 Top Key Companies
9.2.3 Historic and Forecasted Market Size by Segments
9.2.4 Historic and Forecasted Market Size by Type
9.2.4.1 Social Media
9.2.4.2 Search Engine
9.2.4.3 Video
9.2.4.4 Others
9.2.5 Historic and Forecasted Market Size by Platform
9.2.5.1 Mobile
9.2.5.2 Desktop
9.2.5.3 Laptop
9.2.6 Historic and Forecasted Market Size by Pricing Model
9.2.6.1 Cost Per Thousand (CPM)/Cost-Per-Mille (CPM)
9.2.6.2 Performance Based Advertising
9.2.6.3 Hybrid
9.2.6.4 Others
9.2.7 Historic and Forecasted Market Size by Industry Vertical
9.2.7.1 Retail & Consumer Goods
9.2.7.2 Automotive
9.2.7.3 Healthcare
9.2.7.4 Media & Entertainment
9.2.7.5 Education
9.2.7.6 Transport & Tourism
9.2.7.7 BFSI
9.2.7.8 IT & Telecom
9.2.7.9 Others
9.2.8 Historic and Forecast Market Size by Country
9.2.8.1 US
9.2.8.2 Canada
9.2.8.3 Mexico
9.3. Eastern Europe Digital Advertising Market
9.3.1 Key Market Trends, Growth Factors and Opportunities
9.3.2 Top Key Companies
9.3.3 Historic and Forecasted Market Size by Segments
9.3.4 Historic and Forecasted Market Size by Type
9.3.4.1 Social Media
9.3.4.2 Search Engine
9.3.4.3 Video
9.3.4.4 Others
9.3.5 Historic and Forecasted Market Size by Platform
9.3.5.1 Mobile
9.3.5.2 Desktop
9.3.5.3 Laptop
9.3.6 Historic and Forecasted Market Size by Pricing Model
9.3.6.1 Cost Per Thousand (CPM)/Cost-Per-Mille (CPM)
9.3.6.2 Performance Based Advertising
9.3.6.3 Hybrid
9.3.6.4 Others
9.3.7 Historic and Forecasted Market Size by Industry Vertical
9.3.7.1 Retail & Consumer Goods
9.3.7.2 Automotive
9.3.7.3 Healthcare
9.3.7.4 Media & Entertainment
9.3.7.5 Education
9.3.7.6 Transport & Tourism
9.3.7.7 BFSI
9.3.7.8 IT & Telecom
9.3.7.9 Others
9.3.8 Historic and Forecast Market Size by Country
9.3.8.1 Russia
9.3.8.2 Bulgaria
9.3.8.3 The Czech Republic
9.3.8.4 Hungary
9.3.8.5 Poland
9.3.8.6 Romania
9.3.8.7 Rest of Eastern Europe
9.4. Western Europe Digital Advertising Market
9.4.1 Key Market Trends, Growth Factors and Opportunities
9.4.2 Top Key Companies
9.4.3 Historic and Forecasted Market Size by Segments
9.4.4 Historic and Forecasted Market Size by Type
9.4.4.1 Social Media
9.4.4.2 Search Engine
9.4.4.3 Video
9.4.4.4 Others
9.4.5 Historic and Forecasted Market Size by Platform
9.4.5.1 Mobile
9.4.5.2 Desktop
9.4.5.3 Laptop
9.4.6 Historic and Forecasted Market Size by Pricing Model
9.4.6.1 Cost Per Thousand (CPM)/Cost-Per-Mille (CPM)
9.4.6.2 Performance Based Advertising
9.4.6.3 Hybrid
9.4.6.4 Others
9.4.7 Historic and Forecasted Market Size by Industry Vertical
9.4.7.1 Retail & Consumer Goods
9.4.7.2 Automotive
9.4.7.3 Healthcare
9.4.7.4 Media & Entertainment
9.4.7.5 Education
9.4.7.6 Transport & Tourism
9.4.7.7 BFSI
9.4.7.8 IT & Telecom
9.4.7.9 Others
9.4.8 Historic and Forecast Market Size by Country
9.4.8.1 Germany
9.4.8.2 UK
9.4.8.3 France
9.4.8.4 The Netherlands
9.4.8.5 Italy
9.4.8.6 Spain
9.4.8.7 Rest of Western Europe
9.5. Asia Pacific Digital Advertising Market
9.5.1 Key Market Trends, Growth Factors and Opportunities
9.5.2 Top Key Companies
9.5.3 Historic and Forecasted Market Size by Segments
9.5.4 Historic and Forecasted Market Size by Type
9.5.4.1 Social Media
9.5.4.2 Search Engine
9.5.4.3 Video
9.5.4.4 Others
9.5.5 Historic and Forecasted Market Size by Platform
9.5.5.1 Mobile
9.5.5.2 Desktop
9.5.5.3 Laptop
9.5.6 Historic and Forecasted Market Size by Pricing Model
9.5.6.1 Cost Per Thousand (CPM)/Cost-Per-Mille (CPM)
9.5.6.2 Performance Based Advertising
9.5.6.3 Hybrid
9.5.6.4 Others
9.5.7 Historic and Forecasted Market Size by Industry Vertical
9.5.7.1 Retail & Consumer Goods
9.5.7.2 Automotive
9.5.7.3 Healthcare
9.5.7.4 Media & Entertainment
9.5.7.5 Education
9.5.7.6 Transport & Tourism
9.5.7.7 BFSI
9.5.7.8 IT & Telecom
9.5.7.9 Others
9.5.8 Historic and Forecast Market Size by Country
9.5.8.1 China
9.5.8.2 India
9.5.8.3 Japan
9.5.8.4 South Korea
9.5.8.5 Malaysia
9.5.8.6 Thailand
9.5.8.7 Vietnam
9.5.8.8 The Philippines
9.5.8.9 Australia
9.5.8.10 New Zealand
9.5.8.11 Rest of APAC
9.6. Middle East & Africa Digital Advertising Market
9.6.1 Key Market Trends, Growth Factors and Opportunities
9.6.2 Top Key Companies
9.6.3 Historic and Forecasted Market Size by Segments
9.6.4 Historic and Forecasted Market Size by Type
9.6.4.1 Social Media
9.6.4.2 Search Engine
9.6.4.3 Video
9.6.4.4 Others
9.6.5 Historic and Forecasted Market Size by Platform
9.6.5.1 Mobile
9.6.5.2 Desktop
9.6.5.3 Laptop
9.6.6 Historic and Forecasted Market Size by Pricing Model
9.6.6.1 Cost Per Thousand (CPM)/Cost-Per-Mille (CPM)
9.6.6.2 Performance Based Advertising
9.6.6.3 Hybrid
9.6.6.4 Others
9.6.7 Historic and Forecasted Market Size by Industry Vertical
9.6.7.1 Retail & Consumer Goods
9.6.7.2 Automotive
9.6.7.3 Healthcare
9.6.7.4 Media & Entertainment
9.6.7.5 Education
9.6.7.6 Transport & Tourism
9.6.7.7 BFSI
9.6.7.8 IT & Telecom
9.6.7.9 Others
9.6.8 Historic and Forecast Market Size by Country
9.6.8.1 Turkiye
9.6.8.2 Bahrain
9.6.8.3 Kuwait
9.6.8.4 Saudi Arabia
9.6.8.5 Qatar
9.6.8.6 UAE
9.6.8.7 Israel
9.6.8.8 South Africa
9.7. South America Digital Advertising Market
9.7.1 Key Market Trends, Growth Factors and Opportunities
9.7.2 Top Key Companies
9.7.3 Historic and Forecasted Market Size by Segments
9.7.4 Historic and Forecasted Market Size by Type
9.7.4.1 Social Media
9.7.4.2 Search Engine
9.7.4.3 Video
9.7.4.4 Others
9.7.5 Historic and Forecasted Market Size by Platform
9.7.5.1 Mobile
9.7.5.2 Desktop
9.7.5.3 Laptop
9.7.6 Historic and Forecasted Market Size by Pricing Model
9.7.6.1 Cost Per Thousand (CPM)/Cost-Per-Mille (CPM)
9.7.6.2 Performance Based Advertising
9.7.6.3 Hybrid
9.7.6.4 Others
9.7.7 Historic and Forecasted Market Size by Industry Vertical
9.7.7.1 Retail & Consumer Goods
9.7.7.2 Automotive
9.7.7.3 Healthcare
9.7.7.4 Media & Entertainment
9.7.7.5 Education
9.7.7.6 Transport & Tourism
9.7.7.7 BFSI
9.7.7.8 IT & Telecom
9.7.7.9 Others
9.7.8 Historic and Forecast Market Size by Country
9.7.8.1 Brazil
9.7.8.2 Argentina
9.7.8.3 Rest of SA
Chapter 10 Analyst Viewpoint and Conclusion
10.1 Recommendations and Concluding Analysis
10.2 Potential Market Strategies
Chapter 11 Research Methodology
11.1 Research Process
11.2 Primary Research
11.3 Secondary Research
|
Digital Advertising Market |
|||
|
Base Year: |
2023 |
Forecast Period: |
2024-2032 |
|
Historical Data: |
2017 to 2023 |
Market Size in 2023: |
USD 422.73 Bn |
|
Forecast Period 2024-32 CAGR: |
15.7% |
Market Size in 2032: |
USD 1570.59 Bn |
|
Segments Covered: |
By Type |
|
|
|
By Platform |
|
||
|
By Pricing Model |
|
||
|
By Industry Vertical |
|
||
|
By Region |
|
||
|
Key Market Drivers: |
|
||
|
Key Market Restraints: |
|
||
|
Key Opportunities: |
|
||
|
Companies Covered in the report: |
|
||


