


Ecotourism Market Synopsis
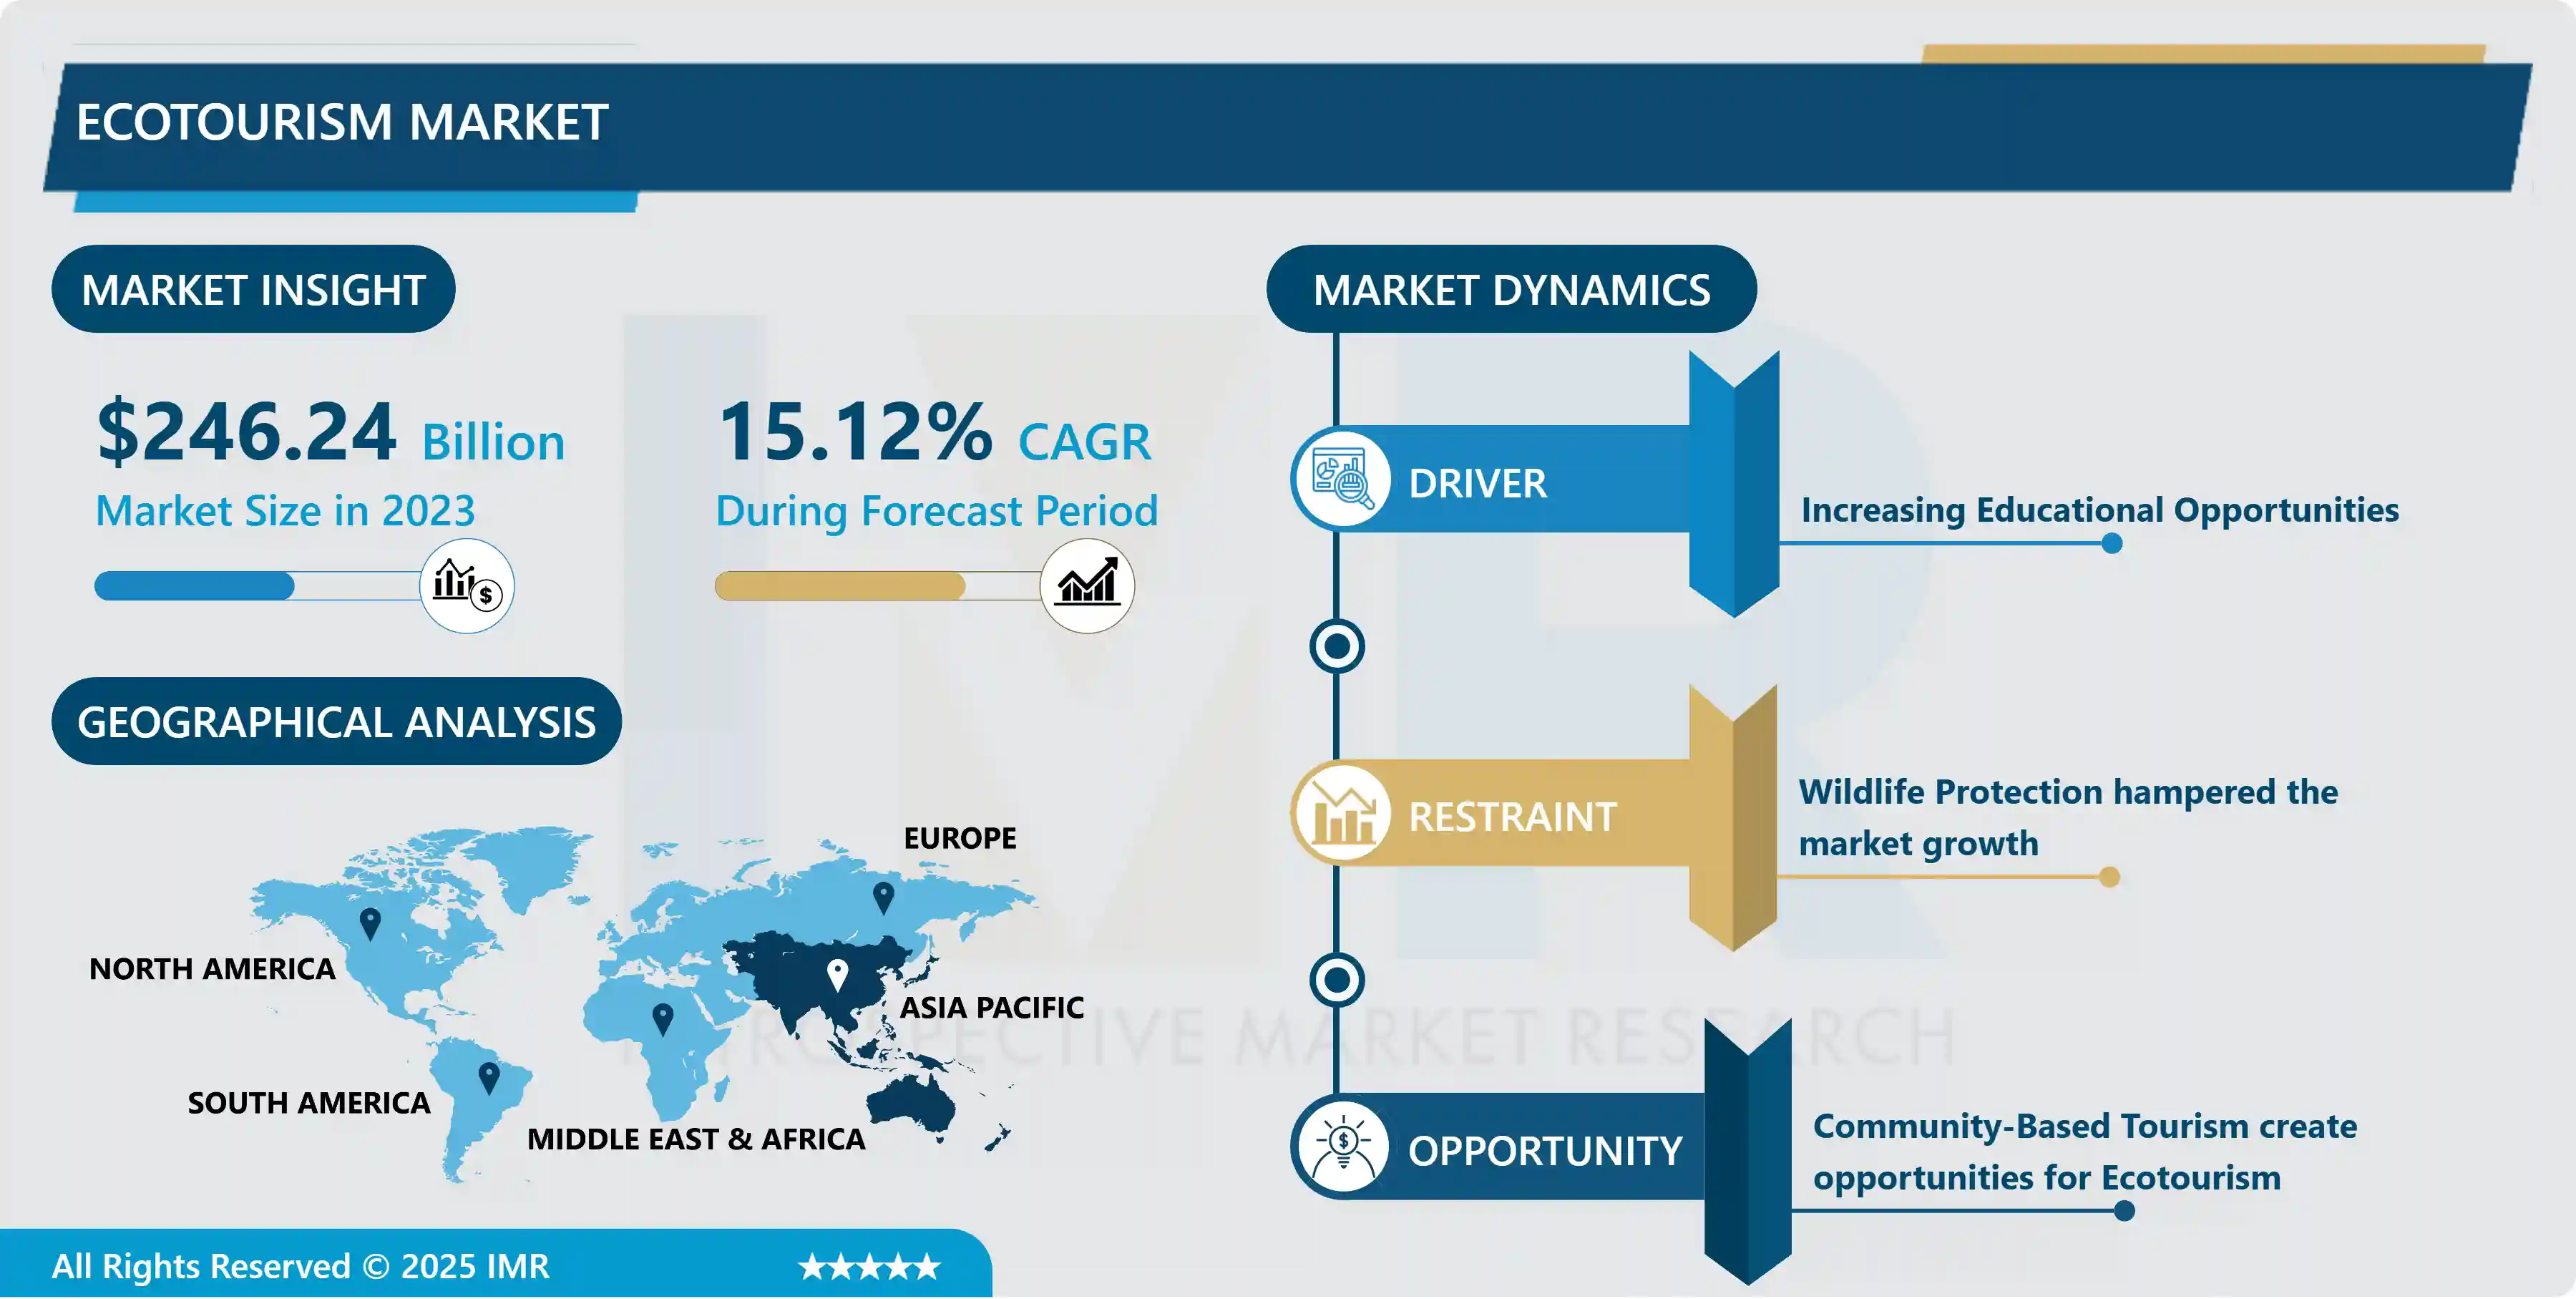
ECOTOURISM Market Size Was Valued at USD 246.24 Billion in 2023, and is Projected to Reach USD 874.41 Billion by 2032, Growing at a CAGR of 15.12 % From 2024-2032.
Ecotourism is a sustainable form of travel that prioritizes the conservation of natural environments and promotes responsible tourism practices. Unlike traditional tourism, which can often harm ecosystems and exploit local communities, ecotourism aims to benefit both the environment and local populations.
Local communities play a vital role in ecotourism, as it often generates income and employment opportunities for them. By involving indigenous people and residents in tourism activities, it helps preserve cultural traditions and creates incentives for protecting their surroundings.
Furthermore, ecotourism promotes education and awareness about conservation issues. Travelers have the opportunity to learn about ecosystems, wildlife, and environmental challenges, leading to a greater understanding of the importance of protecting these resources.
Increased global awareness of environmental issues such as climate change, deforestation, and species extinction has led to a growing interest in sustainable and eco-friendly travel options. Governments and international organizations have introduced regulations and incentives to promote sustainable tourism, encouraging the growth of the ecotourism sector.
 Ecotourism Market Trend Analysis
Increasing Educational Opportunities
- Educational opportunities can be a driving factor in promoting ecotourism. Ecotourism is a sustainable form of travel that focuses on preserving natural environments and supporting local communities. When destinations offer educational experiences, it not only enriches the traveler's journey but also fosters a deeper understanding and appreciation for the environment.
- Additionally, educational institutions can partner with ecotourism destinations to create hands-on learning experiences. Field trips, workshops, and research opportunities allow students to immerse themselves in the local environment while contributing to its preservation. This collaboration not only enhances the educational experience but also supports the economic sustainability of the region.
- Moreover, ecotourism-driven educational initiatives can lead to the development of eco-conscious travelers. Tourists who gain knowledge about conservation and sustainable living are more likely to make informed choices in their daily lives, from reducing their carbon footprint to supporting ethical tourism practices.
Wildlife Protection hampered the market growth
- Wildlife protection often pose challenges to the flourishing ecotourism industry. While ecotourism can promote conservation by generating revenue for local communities, improper management can inadvertently harm delicate ecosystems. Striking the right balance between visitor access and preservation is essential.
- Stringent regulations, like restricted visitor numbers and designated pathways, can deter illegal activities and habitat disturbance. Excessive restrictions may discourage tourists and hinder economic benefits. To navigate this delicate balance, effective enforcement and education are crucial. Raising awareness about the importance of responsible ecotourism ensures visitors actively participate in conservation efforts. Ultimately, collaborative efforts between government bodies, conservationists, and the tourism industry can promote wildlife protection and sustainable ecotourism, preserving nature's wonders for generations to come.
Community-Based Tourism create opportunities for Ecotourism
- Community-based ecotourism is a sustainable travel approach that integrates local communities into the conservation and tourism processes. It empowers indigenous people and residents to actively participate in, benefit from, and protect their natural environments.
- This model ensures that tourism practices are environmentally responsible, socially inclusive, and economically viable. Visitors engage in activities such as guided hikes, wildlife observation, and cultural exchanges, all while contributing to the preservation of fragile ecosystems.
- Community-based ecotourism supports biodiversity conservation and also fosters cultural exchange, creating a win-win situation for both tourists and host communities. It is a powerful tool for promoting sustainable development and environmental stewardship, promoting the harmonious coexistence of people and nature.
Ecotourism Market Segment Analysis:
Ecotourism Market is segmented based on Activity Type, Traveler Type, Age Group, and Sales Channel. By Activity Type, the Land segment is expected to dominate the market during the forecast period.
- Land-based ecotourism destinations often boast diverse landscapes, such as forests, mountains, deserts, and coastal areas. This diversity can appeal to a wide range of travelers with different interests and preferences.
- Land-based destinations are typically more accessible to a broader spectrum of travelers compared to marine or underwater destinations. Most people can access land-based attractions more easily, leading to a potentially larger customer base. Many travelers are drawn to ecotourism for the opportunity to observe and interact with wildlife in their natural habitats. Land destinations often provide excellent opportunities for wildlife viewing, such as safaris in national parks or birdwatching in forests.
- Land-based ecotourism can also offer rich cultural experiences as travelers interact with local communities and learn about their traditions, customs, and sustainable practices. Land-based destinations often have better infrastructure in terms of accommodations, transportation, and visitor facilities, making them more convenient for travelers.
By Age Group, Generation Y segment held the largest share
- Generation Y has grown up in a world increasingly aware of environmental issues. They tend to be more environmentally conscious and are concerned about climate change, deforestation, and biodiversity loss. This heightened awareness makes them more likely to seek out eco-friendly travel options.
- Generation Y place a high value on sustainability and responsible tourism. They are more likely to choose accommodations, activities, and destinations that prioritize environmental and social responsibility. This aligns with the core principles of ecotourism.
- Generation Y are digital natives who rely heavily on technology for travel planning. They use social media, online reviews, and travel apps to research and book their trips. This makes it easier for them to discover and choose ecotourism options, as they can easily find information and reviews online.
Ecotourism Market Regional Insights:
Asia Pacific is Expected to Dominate the Market Over the Forecast period
- The Asia-Pacific region is the world's most diverse and ecologically significant landscapes, including tropical rainforests, coral reefs, deserts, mountains, and wildlife habitats. Tourists are drawn to these unique and pristine natural environments, making it an attractive destination for ecotourism.
- India have rich cultural traditions and indigenous communities that offer unique and authentic experiences for ecotourists. Visitors can engage with local cultures, learn about traditional ecological knowledge, and witness sustainable practices. Governments and local communities have recognized the economic potential of ecotourism. By promoting sustainable tourism practices, they can generate income and employment opportunities, particularly in rural and less-developed areas.
- Ecotourism often goes hand-in-hand with conservation efforts. Many organizations and governments in the region have taken steps to protect and preserve their natural resources, recognizing that these assets are essential for the long-term viability of their tourism industry.

COVID-19 Impact Analysis on Ecotourism Market:
- The impact of COVID-19 on ecotourism has been significant, with both short-term disruptions and potential long-term changes to the industry. Ecotourism, which focuses on sustainable travel to natural areas, has faced unique challenges during the pandemic.
- COVID-19 led to widespread travel restrictions and lockdowns, severely affecting international and domestic tourism. Many ecotourism destinations depend on international visitors, and these restrictions led to a sharp decline in tourist arrivals.
- The economic recession caused by the pandemic affected people's disposable income, leading to reduced spending on travel and tourism. This impacted ecotourism operators and local communities dependent on tourism income.
- Tourists became more concerned about their health and safety, which affected their willingness to travel. Ecotourism, often involving remote or less-developed destinations, faced additional challenges in providing adequate healthcare infrastructure and ensuring visitor safety.
Ecotourism Market Top Key Players:
- Frosch International TravelInc. (US)
- Expedia Group Inc. (US)
- Black Kite tour PLC (US)
- Gondwana Ecotours (US)
- Discover Corps (US)
- ROW Adventures (US)
- Natural Habitat Adventures (US)
- Cheesemans’ Ecology Safaris (US)
- Kind Traveler (US)
- Travel Leaders Group LLC (New York)
- G Adventures (Canada)
- Responsible Travel (UK)
- Steppes discovery (UK)
- Undiscovered Mountains Ltd (UK)
- Adventure Alternative (UK)
- Intrepid Group Limited (Australia)
- Small World Journeys Pty Ltd (Australia)
- Kipepeo (India)
- Spiti Ecosphere (India)
- andBeyond (South Africa)
- Aracari Travel (Peru)
- Rickshaw Travel Group (Tanzania)
- BCD Travel (Netherlands)
Key Industry Developments in the Ecotourism Market:
- In May 2023, Frosch International Travel has acquired Valerie Wilson Travel, a move that brings together two New York City-based agencies run by two generations families that built their respective brands into multimillion-dollar travel businesses. The Acquisition helped to grow and start, became the luxury travel industry.
- In September 2022, Expedia Group announced its new global social impact and sustainability strategy to advance a travel ecosystem that is responsible, open, and accessible to all. Combining the company’s mission, purpose, and values with its traveler-centric mindset, the Open World social impact and sustainability strategy is focused on three priorities – increasing access for underserved travelers, democratizing the travel economy, and innovating sustainable solutions for the future of travel.
|
Ecotourism Market |
||||
|
Base Year: |
2023 |
Forecast Period: |
2024-2032 |
|
|
Historical Data: |
2017 to 2023 |
Market Size in 2023: |
USD 246.24 Bn. |
|
|
CAGR (2024-2032) : |
15.12% |
Market Size in 2032: |
USD 874.41 Bn. |
|
|
Segments Covered: |
By Activity Type |
|
|
|
|
By Traveler Type |
|
|
||
|
By Age Group |
|
|
||
|
By Sales Channel |
|
|
||
|
By Region |
|
|
||
|
Key Market Drivers: |
|
|||
|
Key Market Restraints: |
|
|||
|
Key Opportunities: |
|
|||
|
Companies Covered in the Report: |
Frosch International Travel Inc. (US), Expedia Group Inc. (US), Black Kite tour PLC (US), Gondwana Ecotours (US), Discover Corps (US), and Other Major Players. |
|||
Chapter 1: Introduction
1.1 Scope and Coverage
Chapter 2:Executive Summary
Chapter 3: Market Landscape
3.1 Market Dynamics
3.1.1 Drivers
3.1.2 Restraints
3.1.3 Opportunities
3.1.4 Challenges
3.2 Market Trend Analysis
3.3 PESTLE Analysis
3.4 Porter's Five Forces Analysis
3.5 Industry Value Chain Analysis
3.6 Ecosystem
3.7 Regulatory Landscape
3.8 Price Trend Analysis
3.9 Patent Analysis
3.10 Technology Evolution
3.11 Investment Pockets
3.12 Import-Export Analysis
Chapter 4: Ecotourism Market by Activity Type (2018-2032)
4.1 Ecotourism Market Snapshot and Growth Engine
4.2 Market Overview
4.3 Land
4.3.1 Introduction and Market Overview
4.3.2 Historic and Forecasted Market Size in Value USD and Volume Units
4.3.3 Key Market Trends, Growth Factors, and Opportunities
4.3.4 Geographic Segmentation Analysis
4.4 Marine
Chapter 5: Ecotourism Market by Traveler Type (2018-2032)
5.1 Ecotourism Market Snapshot and Growth Engine
5.2 Market Overview
5.3 Solo
5.3.1 Introduction and Market Overview
5.3.2 Historic and Forecasted Market Size in Value USD and Volume Units
5.3.3 Key Market Trends, Growth Factors, and Opportunities
5.3.4 Geographic Segmentation Analysis
5.4 Groups
Chapter 6: Ecotourism Market by Age Group (2018-2032)
6.1 Ecotourism Market Snapshot and Growth Engine
6.2 Market Overview
6.3 Generation X
6.3.1 Introduction and Market Overview
6.3.2 Historic and Forecasted Market Size in Value USD and Volume Units
6.3.3 Key Market Trends, Growth Factors, and Opportunities
6.3.4 Geographic Segmentation Analysis
6.4 Generation Y
6.5 Generation Z
Chapter 7: Ecotourism Market by Sales Channel (2018-2032)
7.1 Ecotourism Market Snapshot and Growth Engine
7.2 Market Overview
7.3 Travel Agents
7.3.1 Introduction and Market Overview
7.3.2 Historic and Forecasted Market Size in Value USD and Volume Units
7.3.3 Key Market Trends, Growth Factors, and Opportunities
7.3.4 Geographic Segmentation Analysis
7.4 Direct
Chapter 8: Company Profiles and Competitive Analysis
8.1 Competitive Landscape
8.1.1 Competitive Benchmarking
8.1.2 Ecotourism Market Share by Manufacturer (2024)
8.1.3 Industry BCG Matrix
8.1.4 Heat Map Analysis
8.1.5 Mergers and Acquisitions
8.2 VITOL (SWITZERLAND)
8.2.1 Company Overview
8.2.2 Key Executives
8.2.3 Company Snapshot
8.2.4 Role of the Company in the Market
8.2.5 Sustainability and Social Responsibility
8.2.6 Operating Business Segments
8.2.7 Product Portfolio
8.2.8 Business Performance
8.2.9 Key Strategic Moves and Recent Developments
8.2.10 SWOT Analysis
8.3 EXXON MOBIL (U.S.)
8.4 CHEVRON CORPORATION (U.S.)
8.5 SHELL PLC (U.K.)
8.6 INDIAN OIL CORPORATION LIMITED (INDIA)
8.7 TOTAL ENERGIES SE (FRANCE)
8.8 BP PLC (U.K.)
8.9 VALERO ENERGY CORPORATION (U.S.)
8.10 MARATHON PETROLEUM CORPORATION (U.S.)
8.11 WORLD FUEL SERVICES CORPORATION (U.S.)
8.12 ESSAR OIL(UK) LIMITED (U.K.)
8.13 BHARAT PETROLEUM CORPORATION LIMITED (INDIA)
8.14 ROSNEFT DEUTSCHLAND GMBH (GERMANY)
8.15 LUKOIL (RUSSIA)
8.16 CHINA AVIATION OIL (SINGAPORE)
8.17 CORPORATION LTD (SINGAPORE)
8.18 VIVA ENERGY GROUP (AUSTRALIA)
8.19 Q8AVIATION (U.K.)
8.20 PT PERTAMINA (PERSERO) (INDONESIA)
8.21 ADNOC (ABU DHABI NATIONAL OIL COMPANY)
8.22 DISTRIBUTION (UNITED ARAB EMIRATES)
8.23 NESTE (FINLAND)
Chapter 9: Global Ecotourism Market By Region
9.1 Overview
9.2. North America Ecotourism Market
9.2.1 Key Market Trends, Growth Factors and Opportunities
9.2.2 Top Key Companies
9.2.3 Historic and Forecasted Market Size by Segments
9.2.4 Historic and Forecasted Market Size by Activity Type
9.2.4.1 Land
9.2.4.2 Marine
9.2.5 Historic and Forecasted Market Size by Traveler Type
9.2.5.1 Solo
9.2.5.2 Groups
9.2.6 Historic and Forecasted Market Size by Age Group
9.2.6.1 Generation X
9.2.6.2 Generation Y
9.2.6.3 Generation Z
9.2.7 Historic and Forecasted Market Size by Sales Channel
9.2.7.1 Travel Agents
9.2.7.2 Direct
9.2.8 Historic and Forecast Market Size by Country
9.2.8.1 US
9.2.8.2 Canada
9.2.8.3 Mexico
9.3. Eastern Europe Ecotourism Market
9.3.1 Key Market Trends, Growth Factors and Opportunities
9.3.2 Top Key Companies
9.3.3 Historic and Forecasted Market Size by Segments
9.3.4 Historic and Forecasted Market Size by Activity Type
9.3.4.1 Land
9.3.4.2 Marine
9.3.5 Historic and Forecasted Market Size by Traveler Type
9.3.5.1 Solo
9.3.5.2 Groups
9.3.6 Historic and Forecasted Market Size by Age Group
9.3.6.1 Generation X
9.3.6.2 Generation Y
9.3.6.3 Generation Z
9.3.7 Historic and Forecasted Market Size by Sales Channel
9.3.7.1 Travel Agents
9.3.7.2 Direct
9.3.8 Historic and Forecast Market Size by Country
9.3.8.1 Russia
9.3.8.2 Bulgaria
9.3.8.3 The Czech Republic
9.3.8.4 Hungary
9.3.8.5 Poland
9.3.8.6 Romania
9.3.8.7 Rest of Eastern Europe
9.4. Western Europe Ecotourism Market
9.4.1 Key Market Trends, Growth Factors and Opportunities
9.4.2 Top Key Companies
9.4.3 Historic and Forecasted Market Size by Segments
9.4.4 Historic and Forecasted Market Size by Activity Type
9.4.4.1 Land
9.4.4.2 Marine
9.4.5 Historic and Forecasted Market Size by Traveler Type
9.4.5.1 Solo
9.4.5.2 Groups
9.4.6 Historic and Forecasted Market Size by Age Group
9.4.6.1 Generation X
9.4.6.2 Generation Y
9.4.6.3 Generation Z
9.4.7 Historic and Forecasted Market Size by Sales Channel
9.4.7.1 Travel Agents
9.4.7.2 Direct
9.4.8 Historic and Forecast Market Size by Country
9.4.8.1 Germany
9.4.8.2 UK
9.4.8.3 France
9.4.8.4 The Netherlands
9.4.8.5 Italy
9.4.8.6 Spain
9.4.8.7 Rest of Western Europe
9.5. Asia Pacific Ecotourism Market
9.5.1 Key Market Trends, Growth Factors and Opportunities
9.5.2 Top Key Companies
9.5.3 Historic and Forecasted Market Size by Segments
9.5.4 Historic and Forecasted Market Size by Activity Type
9.5.4.1 Land
9.5.4.2 Marine
9.5.5 Historic and Forecasted Market Size by Traveler Type
9.5.5.1 Solo
9.5.5.2 Groups
9.5.6 Historic and Forecasted Market Size by Age Group
9.5.6.1 Generation X
9.5.6.2 Generation Y
9.5.6.3 Generation Z
9.5.7 Historic and Forecasted Market Size by Sales Channel
9.5.7.1 Travel Agents
9.5.7.2 Direct
9.5.8 Historic and Forecast Market Size by Country
9.5.8.1 China
9.5.8.2 India
9.5.8.3 Japan
9.5.8.4 South Korea
9.5.8.5 Malaysia
9.5.8.6 Thailand
9.5.8.7 Vietnam
9.5.8.8 The Philippines
9.5.8.9 Australia
9.5.8.10 New Zealand
9.5.8.11 Rest of APAC
9.6. Middle East & Africa Ecotourism Market
9.6.1 Key Market Trends, Growth Factors and Opportunities
9.6.2 Top Key Companies
9.6.3 Historic and Forecasted Market Size by Segments
9.6.4 Historic and Forecasted Market Size by Activity Type
9.6.4.1 Land
9.6.4.2 Marine
9.6.5 Historic and Forecasted Market Size by Traveler Type
9.6.5.1 Solo
9.6.5.2 Groups
9.6.6 Historic and Forecasted Market Size by Age Group
9.6.6.1 Generation X
9.6.6.2 Generation Y
9.6.6.3 Generation Z
9.6.7 Historic and Forecasted Market Size by Sales Channel
9.6.7.1 Travel Agents
9.6.7.2 Direct
9.6.8 Historic and Forecast Market Size by Country
9.6.8.1 Turkiye
9.6.8.2 Bahrain
9.6.8.3 Kuwait
9.6.8.4 Saudi Arabia
9.6.8.5 Qatar
9.6.8.6 UAE
9.6.8.7 Israel
9.6.8.8 South Africa
9.7. South America Ecotourism Market
9.7.1 Key Market Trends, Growth Factors and Opportunities
9.7.2 Top Key Companies
9.7.3 Historic and Forecasted Market Size by Segments
9.7.4 Historic and Forecasted Market Size by Activity Type
9.7.4.1 Land
9.7.4.2 Marine
9.7.5 Historic and Forecasted Market Size by Traveler Type
9.7.5.1 Solo
9.7.5.2 Groups
9.7.6 Historic and Forecasted Market Size by Age Group
9.7.6.1 Generation X
9.7.6.2 Generation Y
9.7.6.3 Generation Z
9.7.7 Historic and Forecasted Market Size by Sales Channel
9.7.7.1 Travel Agents
9.7.7.2 Direct
9.7.8 Historic and Forecast Market Size by Country
9.7.8.1 Brazil
9.7.8.2 Argentina
9.7.8.3 Rest of SA
Chapter 10 Analyst Viewpoint and Conclusion
10.1 Recommendations and Concluding Analysis
10.2 Potential Market Strategies
Chapter 11 Research Methodology
11.1 Research Process
11.2 Primary Research
11.3 Secondary Research
|
Ecotourism Market |
||||
|
Base Year: |
2023 |
Forecast Period: |
2024-2032 |
|
|
Historical Data: |
2017 to 2023 |
Market Size in 2023: |
USD 246.24 Bn. |
|
|
CAGR (2024-2032) : |
15.12% |
Market Size in 2032: |
USD 874.41 Bn. |
|
|
Segments Covered: |
By Activity Type |
|
|
|
|
By Traveler Type |
|
|
||
|
By Age Group |
|
|
||
|
By Sales Channel |
|
|
||
|
By Region |
|
|
||
|
Key Market Drivers: |
|
|||
|
Key Market Restraints: |
|
|||
|
Key Opportunities: |
|
|||
|
Companies Covered in the Report: |
Frosch International Travel Inc. (US), Expedia Group Inc. (US), Black Kite tour PLC (US), Gondwana Ecotours (US), Discover Corps (US), and Other Major Players. |
|||


