


Mobile Money Market Synopsis
Mobile Money Market was valued at USD 9.35 Billion in 2023 and is expected to reach USD 91.98 Billion by the year 2032, at a CAGR of 28.92%.
The term "mobile money" describes financial services and transactions that can be performed using a mobile device, such as a smartphone or tablet. These services could be directly linked to a bank account or not.
Mobile money is cash that is generated through digital means. In digital payments, both the payer and the payee send and receive money digitally. It is also known as electronic payment. Real money is not included in mobile money. Mobile money is the term used to describe non-cash transactions made through digital platforms, according to industry standards. Additionally, Near-Field Communication (NFC) in mobile payment technology efficiently transmits encrypted data to the Point of Sale (POS) devices directly and instantly.
An important factor accelerating market growth is the expansion of government initiatives to support the cashless economy. Other factors include an increase in the adoption of digital payment-based business models by organizations, improvement in the efficiency of mobile money transactions, and increased overall spending, all of which can encourage businesses to invest in developing new mobile payment technologies. Additionally, growing flexibility in using mobile money to draw in more business, an increase in NFC-enabled handset availability, and increased R&D activity in the market will all lead to new opportunities for the mobile money market during the aforementioned forecast period.

 The Mobile Money Market Trend Analysis
Rise in the Use of Digital Payment-Based Business Models
- An electronic payment, also known as a digital payment, is one that moves money from one payment account to another through a digital device or channel. The landscape of mobile money services is changing due to an increase in the adoption of digital payment-based solutions like mobile wallets, UPI, and card payments. Additionally, by integrating these facilities with banking operations, they are better able to visualize data, respond to customer inquiries, and make challenging data accessible.
- Additionally, mobile applications offer end users real-time insights and aid in enhancing network security, accelerating digital businesses, and improving customer experience. Numerous opportunities for players in the mobile money market are anticipated to arise as a result of the increasing adoption of such initiatives. Key businesses concentrate on concluding alliances and collaborations with other participants to introduce advanced solutions based on fundamental technologies like AI and others.
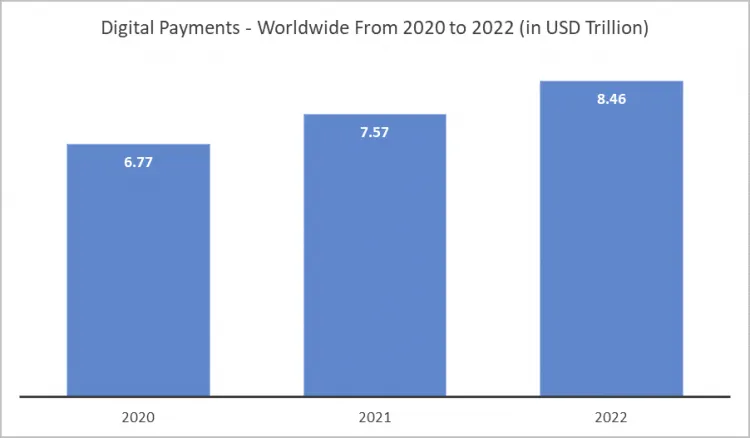
- The projected US$8.4 trillion in total transaction value in the digital payments market for 2022 is expected to be a significant growth driver for the mobile money market. This astounding statistic emphasizes the fundamental shift in consumer behavior and corporate strategies toward embracing digital payment solutions.
- Mobile money services become an essential component of consumers' financial ecosystems as they depend more and more on digital payments for a variety of transactions, from retail purchases to utility bill payments. Mobile money platforms are a popular option for people looking for effective and hassle-free payment options due to the convenience, accessibility, and security they provide.
Increasing Government Initiatives to Promote a Cashless Economy
- The government's growing initiatives to encourage a cashless society offer the mobile money market a sizable opportunity. Governments all over the world are becoming aware of the benefits of shifting from an economy that is primarily based on cash to one that relies on digital payment solutions. Increased transparency, decreased tax evasion, improved financial inclusion, and increased overall economic efficiency are just a few advantages of this change.
- Governments are actively promoting the use of digital payment methods among their citizens through a variety of initiatives, including incentives, subsidies, and awareness-raising campaigns. To encourage people and businesses to use mobile money services and other electronic payment platforms, these initiatives frequently offer financial incentives or discounts for transactions made through digital channels. The promotion of cashless transactions also supports broader economic objectives because it lowers the cost of producing and disseminating physical currency, reduces the dangers of using fake money, and promotes a more transparent and accountable financial ecosystem.
Mobile Money Market Segmentation Analysis
Mobile Money market segments cover the Payment Type, Nature of Payment, Transaction Mode, Application, and Industry Vertical. By Application, the Money Transfers, segment is anticipated to dominate the Market Over the Forecast period.
- Over the forecast period, the Mobile Money Market's Money Transfers segment is anticipated to firmly establish its dominance. Several factors support this projection, but the main ones are the rising reliance on off-net transfers, cash-in/cash-out transactions, and international remittances. Particularly in developed countries, the rising cost of real estate has increased the demand for quick and affordable money transfer services. The significant diaspora of people from developing countries who live abroad in more developed economies also encourages the use of money transfer apps.
- Banks and other financial institutions have historically been crucial in facilitating money transfers. However, there has been a noticeable shift toward carrying out these transactions via mobile phones as society continues to embrace and integrate new technologies into daily life. In addition to providing more convenience, the switch to mobile-based money transfers also expands the market for these services, making a wider range of people eligible to use them. Therefore, it is anticipated that in the future, the Money Transfers segment will retain its dominance and continue to propel the growth of the Mobile Money Market.
Mobile Money Market Regional Analysis
Asia Pacific is Expected to Dominate the Market Over the Forecast Period.
- Over the forecast period, the Asia-Pacific (APAC) region is likely to become the dominant force in the mobile money market. Several important factors that highlight the region's remarkable growth trajectory in mobile money adoption can be linked to this anticipated dominance. Due to the high penetration of smartphones, APAC is leading the way in embracing mobile payment solutions. Because there are so many smartphones in the area, operators have an ideal platform to launch and run advanced mobile wallet services, which are becoming more and more crucial to residents' daily lives. Additionally, the rapid expansion of e-commerce in APAC has significantly increased the use of electronic payment methods, such as mobile money services.
- A sizeable portion of the population lacks direct access to traditional financial services due to the region's large population and developing economies. Traditional banking frequently has high operational costs and finds it difficult to expand into outlying and rural areas. Mobile-based solutions, on the other hand, provide a more affordable option that can cater to a wide range of people, promoting financial inclusion by connecting underserved communities to economic opportunities.
- The statistics show that mobile money is expanding rapidly in the region, according to the GSMA's Mobile Economy Asia Pacific 2022 report. The region is expanding exponentially, with 86 active mobile money services, 328 million registered accounts in East Asia and the Pacific by the end of 2021, and 283 million in South Asia. The fact that these regions' combined transaction value is getting close to $300 billion further emphasizes APAC's growing dominance in the mobile money market.
Top Key Players Covered in The Mobile Money Market
- Google (US)
- FIS (US)
- Paypal (US)
- Mastercard (US)
- Fiserve (US)
- Global Payments (US)
- Square (US)
- Amazon (US)
- Apple (US)
- T- T-Mobile (US)
- Western Union Holdings (US)
- Vodafone (UK)
- Orange (France)
- Samsung (South Korea)
- Gemalto (Netherlands)
- Alipay (China)
- MTN (South Africa)
- PAYTM (India)
- VISA (US)
- Tencent (China)
- Airtel (India)
- Comviva (India), and Other Major Players
Key Industry Developments in the Mobile Money Market
- In January 2024, Hitachi Payment Solutions and Yes Bank partnered to launch Hitachi Money Spot Plus in India. The financial inclusion business will operate with a strong focus in Tier 3 and Tier 6 towns across the country.
- In August 2023, Safaricom launched M-Pesa mobile money service in Ethiopia. Safaricom's M-Pesa mobile money service is a boost to the Kenyan telecoms operator as it seeks to kickstart growth in one of Africa's biggest economies.
- In April 2023, Africell launched its ‘Afrimoney’ mobile money service in Angola in collaboration with the National Bank of Angola (BNA) following a pilot phase, declaring that the new platform will boost the country’s economy by digitizing its informal economy and ‘unlocking’ the unbanked population.
|
Mobile Money Market |
|||
|
Base Year: |
2023 |
Forecast Period: |
2024-2032 |
|
Historical Data: |
2017 to 2023 |
Market Size in 2023: |
USD 9.35 Bn. |
|
Forecast Period 2024-32 CAGR: |
28.92% |
Market Size in 2032: |
USD 91.98 Bn. |
|
Segments Covered: |
By Payment Type |
|
|
|
By Nature of Payment |
|
||
|
By Transaction Mode |
|
||
|
By Application |
|
||
|
By Industry Vertical |
|
||
|
By Region |
|
||
|
Key Market Drivers: |
|
||
|
Key Market Restraints: |
|
||
|
Key Opportunities: |
|
||
|
Companies Covered in the Report: |
|
||
Chapter 1: Introduction
1.1 Scope and Coverage
Chapter 2:Executive Summary
Chapter 3: Market Landscape
3.1 Market Dynamics
3.1.1 Drivers
3.1.2 Restraints
3.1.3 Opportunities
3.1.4 Challenges
3.2 Market Trend Analysis
3.3 PESTLE Analysis
3.4 Porter's Five Forces Analysis
3.5 Industry Value Chain Analysis
3.6 Ecosystem
3.7 Regulatory Landscape
3.8 Price Trend Analysis
3.9 Patent Analysis
3.10 Technology Evolution
3.11 Investment Pockets
3.12 Import-Export Analysis
Chapter 4: Mobile Money Market by Payment Type (2018-2032)
4.1 Mobile Money Market Snapshot and Growth Engine
4.2 Market Overview
4.3 Remote Payment
4.3.1 Introduction and Market Overview
4.3.2 Historic and Forecasted Market Size in Value USD and Volume Units
4.3.3 Key Market Trends, Growth Factors, and Opportunities
4.3.4 Geographic Segmentation Analysis
4.4 Proximity Payment
Chapter 5: Mobile Money Market by Nature of Payment (2018-2032)
5.1 Mobile Money Market Snapshot and Growth Engine
5.2 Market Overview
5.3 Person to Person (P2P)
5.3.1 Introduction and Market Overview
5.3.2 Historic and Forecasted Market Size in Value USD and Volume Units
5.3.3 Key Market Trends, Growth Factors, and Opportunities
5.3.4 Geographic Segmentation Analysis
5.4 Person to Business (P2B)
5.5 Business to Person (B2P)
5.6 Business to Business (B2B)
Chapter 6: Mobile Money Market by Transaction Mode (2018-2032)
6.1 Mobile Money Market Snapshot and Growth Engine
6.2 Market Overview
6.3 NFC/Smart card
6.3.1 Introduction and Market Overview
6.3.2 Historic and Forecasted Market Size in Value USD and Volume Units
6.3.3 Key Market Trends, Growth Factors, and Opportunities
6.3.4 Geographic Segmentation Analysis
6.4 Point of Sale (POS)
6.5 Mobile Apps
6.6 QR codes
Chapter 7: Mobile Money Market by Application (2018-2032)
7.1 Mobile Money Market Snapshot and Growth Engine
7.2 Market Overview
7.3 Money Transfers
7.3.1 Introduction and Market Overview
7.3.2 Historic and Forecasted Market Size in Value USD and Volume Units
7.3.3 Key Market Trends, Growth Factors, and Opportunities
7.3.4 Geographic Segmentation Analysis
7.4 Transfer and Top-Ups
7.5 Bill Payments
7.6 Airtime Travel and Ticketing
7.7 Other
Chapter 8: Mobile Money Market by Industry Vertical (2018-2032)
8.1 Mobile Money Market Snapshot and Growth Engine
8.2 Market Overview
8.3 BFSI
8.3.1 Introduction and Market Overview
8.3.2 Historic and Forecasted Market Size in Value USD and Volume Units
8.3.3 Key Market Trends, Growth Factors, and Opportunities
8.3.4 Geographic Segmentation Analysis
8.4 Telecom and IT
8.5 Healthcare
8.6 Media and Entertainment
8.7 Retail
8.8 Other
Chapter 9: Company Profiles and Competitive Analysis
9.1 Competitive Landscape
9.1.1 Competitive Benchmarking
9.1.2 Mobile Money Market Share by Manufacturer (2024)
9.1.3 Industry BCG Matrix
9.1.4 Heat Map Analysis
9.1.5 Mergers and Acquisitions
9.2 ESTÉE LAUDER COMPANIES (US)
9.2.1 Company Overview
9.2.2 Key Executives
9.2.3 Company Snapshot
9.2.4 Role of the Company in the Market
9.2.5 Sustainability and Social Responsibility
9.2.6 Operating Business Segments
9.2.7 Product Portfolio
9.2.8 Business Performance
9.2.9 Key Strategic Moves and Recent Developments
9.2.10 SWOT Analysis
9.3 REVLON INC. (US)
9.4 COTY INC. (US)
9.5 MARY KAY INC. (US)
9.6 NU SKIN ENTERPRISES INC. (US)
9.7 OLAY (PROCTER & GAMBLE) (US)
9.8 NEUTROGENA (JOHNSON & JOHNSON) (US)
9.9 ELIZABETH ARDEN INC. (US)
9.10 PROCTER & GAMBLE (US)
9.11 JOHNSON & JOHNSON (US)
9.12 CLINIQUE (ESTÉE LAUDER COMPANIES) (US)
9.13 BEIERSDORF AG (GERMANY)
9.14 THE BODY SHOP INTERNATIONAL LIMITED (UK)
9.15 AVON PRODUCTS INC. (UK)
9.16 L'ORÉAL (FRANCE)
9.17 CLARINS GROUP (FRANCE)
9.18 LANCÔME (L'ORÉAL) (FRANCE)
9.19 CHANEL (FRANCE)
9.20 GARNIER (L'ORÉAL) (FRANCE)
9.21 UNILEVER (UNITED KINGDOM/NETHERLANDS)
9.22 ORIFLAME COSMETICS GLOBAL S.A. (SWEDEN)
9.23 KAO CORPORATION (JAPAN)
9.24 SK-II (PROCTER & GAMBLE) (JAPAN)
9.25 SHISEIDO COMPANY
9.26 LIMITED (JAPAN)
9.27 AMOREPACIFIC CORPORATION (SOUTH KOREA)
9.28
Chapter 10: Global Mobile Money Market By Region
10.1 Overview
10.2. North America Mobile Money Market
10.2.1 Key Market Trends, Growth Factors and Opportunities
10.2.2 Top Key Companies
10.2.3 Historic and Forecasted Market Size by Segments
10.2.4 Historic and Forecasted Market Size by Payment Type
10.2.4.1 Remote Payment
10.2.4.2 Proximity Payment
10.2.5 Historic and Forecasted Market Size by Nature of Payment
10.2.5.1 Person to Person (P2P)
10.2.5.2 Person to Business (P2B)
10.2.5.3 Business to Person (B2P)
10.2.5.4 Business to Business (B2B)
10.2.6 Historic and Forecasted Market Size by Transaction Mode
10.2.6.1 NFC/Smart card
10.2.6.2 Point of Sale (POS)
10.2.6.3 Mobile Apps
10.2.6.4 QR codes
10.2.7 Historic and Forecasted Market Size by Application
10.2.7.1 Money Transfers
10.2.7.2 Transfer and Top-Ups
10.2.7.3 Bill Payments
10.2.7.4 Airtime Travel and Ticketing
10.2.7.5 Other
10.2.8 Historic and Forecasted Market Size by Industry Vertical
10.2.8.1 BFSI
10.2.8.2 Telecom and IT
10.2.8.3 Healthcare
10.2.8.4 Media and Entertainment
10.2.8.5 Retail
10.2.8.6 Other
10.2.9 Historic and Forecast Market Size by Country
10.2.9.1 US
10.2.9.2 Canada
10.2.9.3 Mexico
10.3. Eastern Europe Mobile Money Market
10.3.1 Key Market Trends, Growth Factors and Opportunities
10.3.2 Top Key Companies
10.3.3 Historic and Forecasted Market Size by Segments
10.3.4 Historic and Forecasted Market Size by Payment Type
10.3.4.1 Remote Payment
10.3.4.2 Proximity Payment
10.3.5 Historic and Forecasted Market Size by Nature of Payment
10.3.5.1 Person to Person (P2P)
10.3.5.2 Person to Business (P2B)
10.3.5.3 Business to Person (B2P)
10.3.5.4 Business to Business (B2B)
10.3.6 Historic and Forecasted Market Size by Transaction Mode
10.3.6.1 NFC/Smart card
10.3.6.2 Point of Sale (POS)
10.3.6.3 Mobile Apps
10.3.6.4 QR codes
10.3.7 Historic and Forecasted Market Size by Application
10.3.7.1 Money Transfers
10.3.7.2 Transfer and Top-Ups
10.3.7.3 Bill Payments
10.3.7.4 Airtime Travel and Ticketing
10.3.7.5 Other
10.3.8 Historic and Forecasted Market Size by Industry Vertical
10.3.8.1 BFSI
10.3.8.2 Telecom and IT
10.3.8.3 Healthcare
10.3.8.4 Media and Entertainment
10.3.8.5 Retail
10.3.8.6 Other
10.3.9 Historic and Forecast Market Size by Country
10.3.9.1 Russia
10.3.9.2 Bulgaria
10.3.9.3 The Czech Republic
10.3.9.4 Hungary
10.3.9.5 Poland
10.3.9.6 Romania
10.3.9.7 Rest of Eastern Europe
10.4. Western Europe Mobile Money Market
10.4.1 Key Market Trends, Growth Factors and Opportunities
10.4.2 Top Key Companies
10.4.3 Historic and Forecasted Market Size by Segments
10.4.4 Historic and Forecasted Market Size by Payment Type
10.4.4.1 Remote Payment
10.4.4.2 Proximity Payment
10.4.5 Historic and Forecasted Market Size by Nature of Payment
10.4.5.1 Person to Person (P2P)
10.4.5.2 Person to Business (P2B)
10.4.5.3 Business to Person (B2P)
10.4.5.4 Business to Business (B2B)
10.4.6 Historic and Forecasted Market Size by Transaction Mode
10.4.6.1 NFC/Smart card
10.4.6.2 Point of Sale (POS)
10.4.6.3 Mobile Apps
10.4.6.4 QR codes
10.4.7 Historic and Forecasted Market Size by Application
10.4.7.1 Money Transfers
10.4.7.2 Transfer and Top-Ups
10.4.7.3 Bill Payments
10.4.7.4 Airtime Travel and Ticketing
10.4.7.5 Other
10.4.8 Historic and Forecasted Market Size by Industry Vertical
10.4.8.1 BFSI
10.4.8.2 Telecom and IT
10.4.8.3 Healthcare
10.4.8.4 Media and Entertainment
10.4.8.5 Retail
10.4.8.6 Other
10.4.9 Historic and Forecast Market Size by Country
10.4.9.1 Germany
10.4.9.2 UK
10.4.9.3 France
10.4.9.4 The Netherlands
10.4.9.5 Italy
10.4.9.6 Spain
10.4.9.7 Rest of Western Europe
10.5. Asia Pacific Mobile Money Market
10.5.1 Key Market Trends, Growth Factors and Opportunities
10.5.2 Top Key Companies
10.5.3 Historic and Forecasted Market Size by Segments
10.5.4 Historic and Forecasted Market Size by Payment Type
10.5.4.1 Remote Payment
10.5.4.2 Proximity Payment
10.5.5 Historic and Forecasted Market Size by Nature of Payment
10.5.5.1 Person to Person (P2P)
10.5.5.2 Person to Business (P2B)
10.5.5.3 Business to Person (B2P)
10.5.5.4 Business to Business (B2B)
10.5.6 Historic and Forecasted Market Size by Transaction Mode
10.5.6.1 NFC/Smart card
10.5.6.2 Point of Sale (POS)
10.5.6.3 Mobile Apps
10.5.6.4 QR codes
10.5.7 Historic and Forecasted Market Size by Application
10.5.7.1 Money Transfers
10.5.7.2 Transfer and Top-Ups
10.5.7.3 Bill Payments
10.5.7.4 Airtime Travel and Ticketing
10.5.7.5 Other
10.5.8 Historic and Forecasted Market Size by Industry Vertical
10.5.8.1 BFSI
10.5.8.2 Telecom and IT
10.5.8.3 Healthcare
10.5.8.4 Media and Entertainment
10.5.8.5 Retail
10.5.8.6 Other
10.5.9 Historic and Forecast Market Size by Country
10.5.9.1 China
10.5.9.2 India
10.5.9.3 Japan
10.5.9.4 South Korea
10.5.9.5 Malaysia
10.5.9.6 Thailand
10.5.9.7 Vietnam
10.5.9.8 The Philippines
10.5.9.9 Australia
10.5.9.10 New Zealand
10.5.9.11 Rest of APAC
10.6. Middle East & Africa Mobile Money Market
10.6.1 Key Market Trends, Growth Factors and Opportunities
10.6.2 Top Key Companies
10.6.3 Historic and Forecasted Market Size by Segments
10.6.4 Historic and Forecasted Market Size by Payment Type
10.6.4.1 Remote Payment
10.6.4.2 Proximity Payment
10.6.5 Historic and Forecasted Market Size by Nature of Payment
10.6.5.1 Person to Person (P2P)
10.6.5.2 Person to Business (P2B)
10.6.5.3 Business to Person (B2P)
10.6.5.4 Business to Business (B2B)
10.6.6 Historic and Forecasted Market Size by Transaction Mode
10.6.6.1 NFC/Smart card
10.6.6.2 Point of Sale (POS)
10.6.6.3 Mobile Apps
10.6.6.4 QR codes
10.6.7 Historic and Forecasted Market Size by Application
10.6.7.1 Money Transfers
10.6.7.2 Transfer and Top-Ups
10.6.7.3 Bill Payments
10.6.7.4 Airtime Travel and Ticketing
10.6.7.5 Other
10.6.8 Historic and Forecasted Market Size by Industry Vertical
10.6.8.1 BFSI
10.6.8.2 Telecom and IT
10.6.8.3 Healthcare
10.6.8.4 Media and Entertainment
10.6.8.5 Retail
10.6.8.6 Other
10.6.9 Historic and Forecast Market Size by Country
10.6.9.1 Turkiye
10.6.9.2 Bahrain
10.6.9.3 Kuwait
10.6.9.4 Saudi Arabia
10.6.9.5 Qatar
10.6.9.6 UAE
10.6.9.7 Israel
10.6.9.8 South Africa
10.7. South America Mobile Money Market
10.7.1 Key Market Trends, Growth Factors and Opportunities
10.7.2 Top Key Companies
10.7.3 Historic and Forecasted Market Size by Segments
10.7.4 Historic and Forecasted Market Size by Payment Type
10.7.4.1 Remote Payment
10.7.4.2 Proximity Payment
10.7.5 Historic and Forecasted Market Size by Nature of Payment
10.7.5.1 Person to Person (P2P)
10.7.5.2 Person to Business (P2B)
10.7.5.3 Business to Person (B2P)
10.7.5.4 Business to Business (B2B)
10.7.6 Historic and Forecasted Market Size by Transaction Mode
10.7.6.1 NFC/Smart card
10.7.6.2 Point of Sale (POS)
10.7.6.3 Mobile Apps
10.7.6.4 QR codes
10.7.7 Historic and Forecasted Market Size by Application
10.7.7.1 Money Transfers
10.7.7.2 Transfer and Top-Ups
10.7.7.3 Bill Payments
10.7.7.4 Airtime Travel and Ticketing
10.7.7.5 Other
10.7.8 Historic and Forecasted Market Size by Industry Vertical
10.7.8.1 BFSI
10.7.8.2 Telecom and IT
10.7.8.3 Healthcare
10.7.8.4 Media and Entertainment
10.7.8.5 Retail
10.7.8.6 Other
10.7.9 Historic and Forecast Market Size by Country
10.7.9.1 Brazil
10.7.9.2 Argentina
10.7.9.3 Rest of SA
Chapter 11 Analyst Viewpoint and Conclusion
11.1 Recommendations and Concluding Analysis
11.2 Potential Market Strategies
Chapter 12 Research Methodology
12.1 Research Process
12.2 Primary Research
12.3 Secondary Research
|
Mobile Money Market |
|||
|
Base Year: |
2023 |
Forecast Period: |
2024-2032 |
|
Historical Data: |
2017 to 2023 |
Market Size in 2023: |
USD 9.35 Bn. |
|
Forecast Period 2024-32 CAGR: |
28.92% |
Market Size in 2032: |
USD 91.98 Bn. |
|
Segments Covered: |
By Payment Type |
|
|
|
By Nature of Payment |
|
||
|
By Transaction Mode |
|
||
|
By Application |
|
||
|
By Industry Vertical |
|
||
|
By Region |
|
||
|
Key Market Drivers: |
|
||
|
Key Market Restraints: |
|
||
|
Key Opportunities: |
|
||
|
Companies Covered in the Report: |
|
||


