


Global Home Insurance Market Synopsis
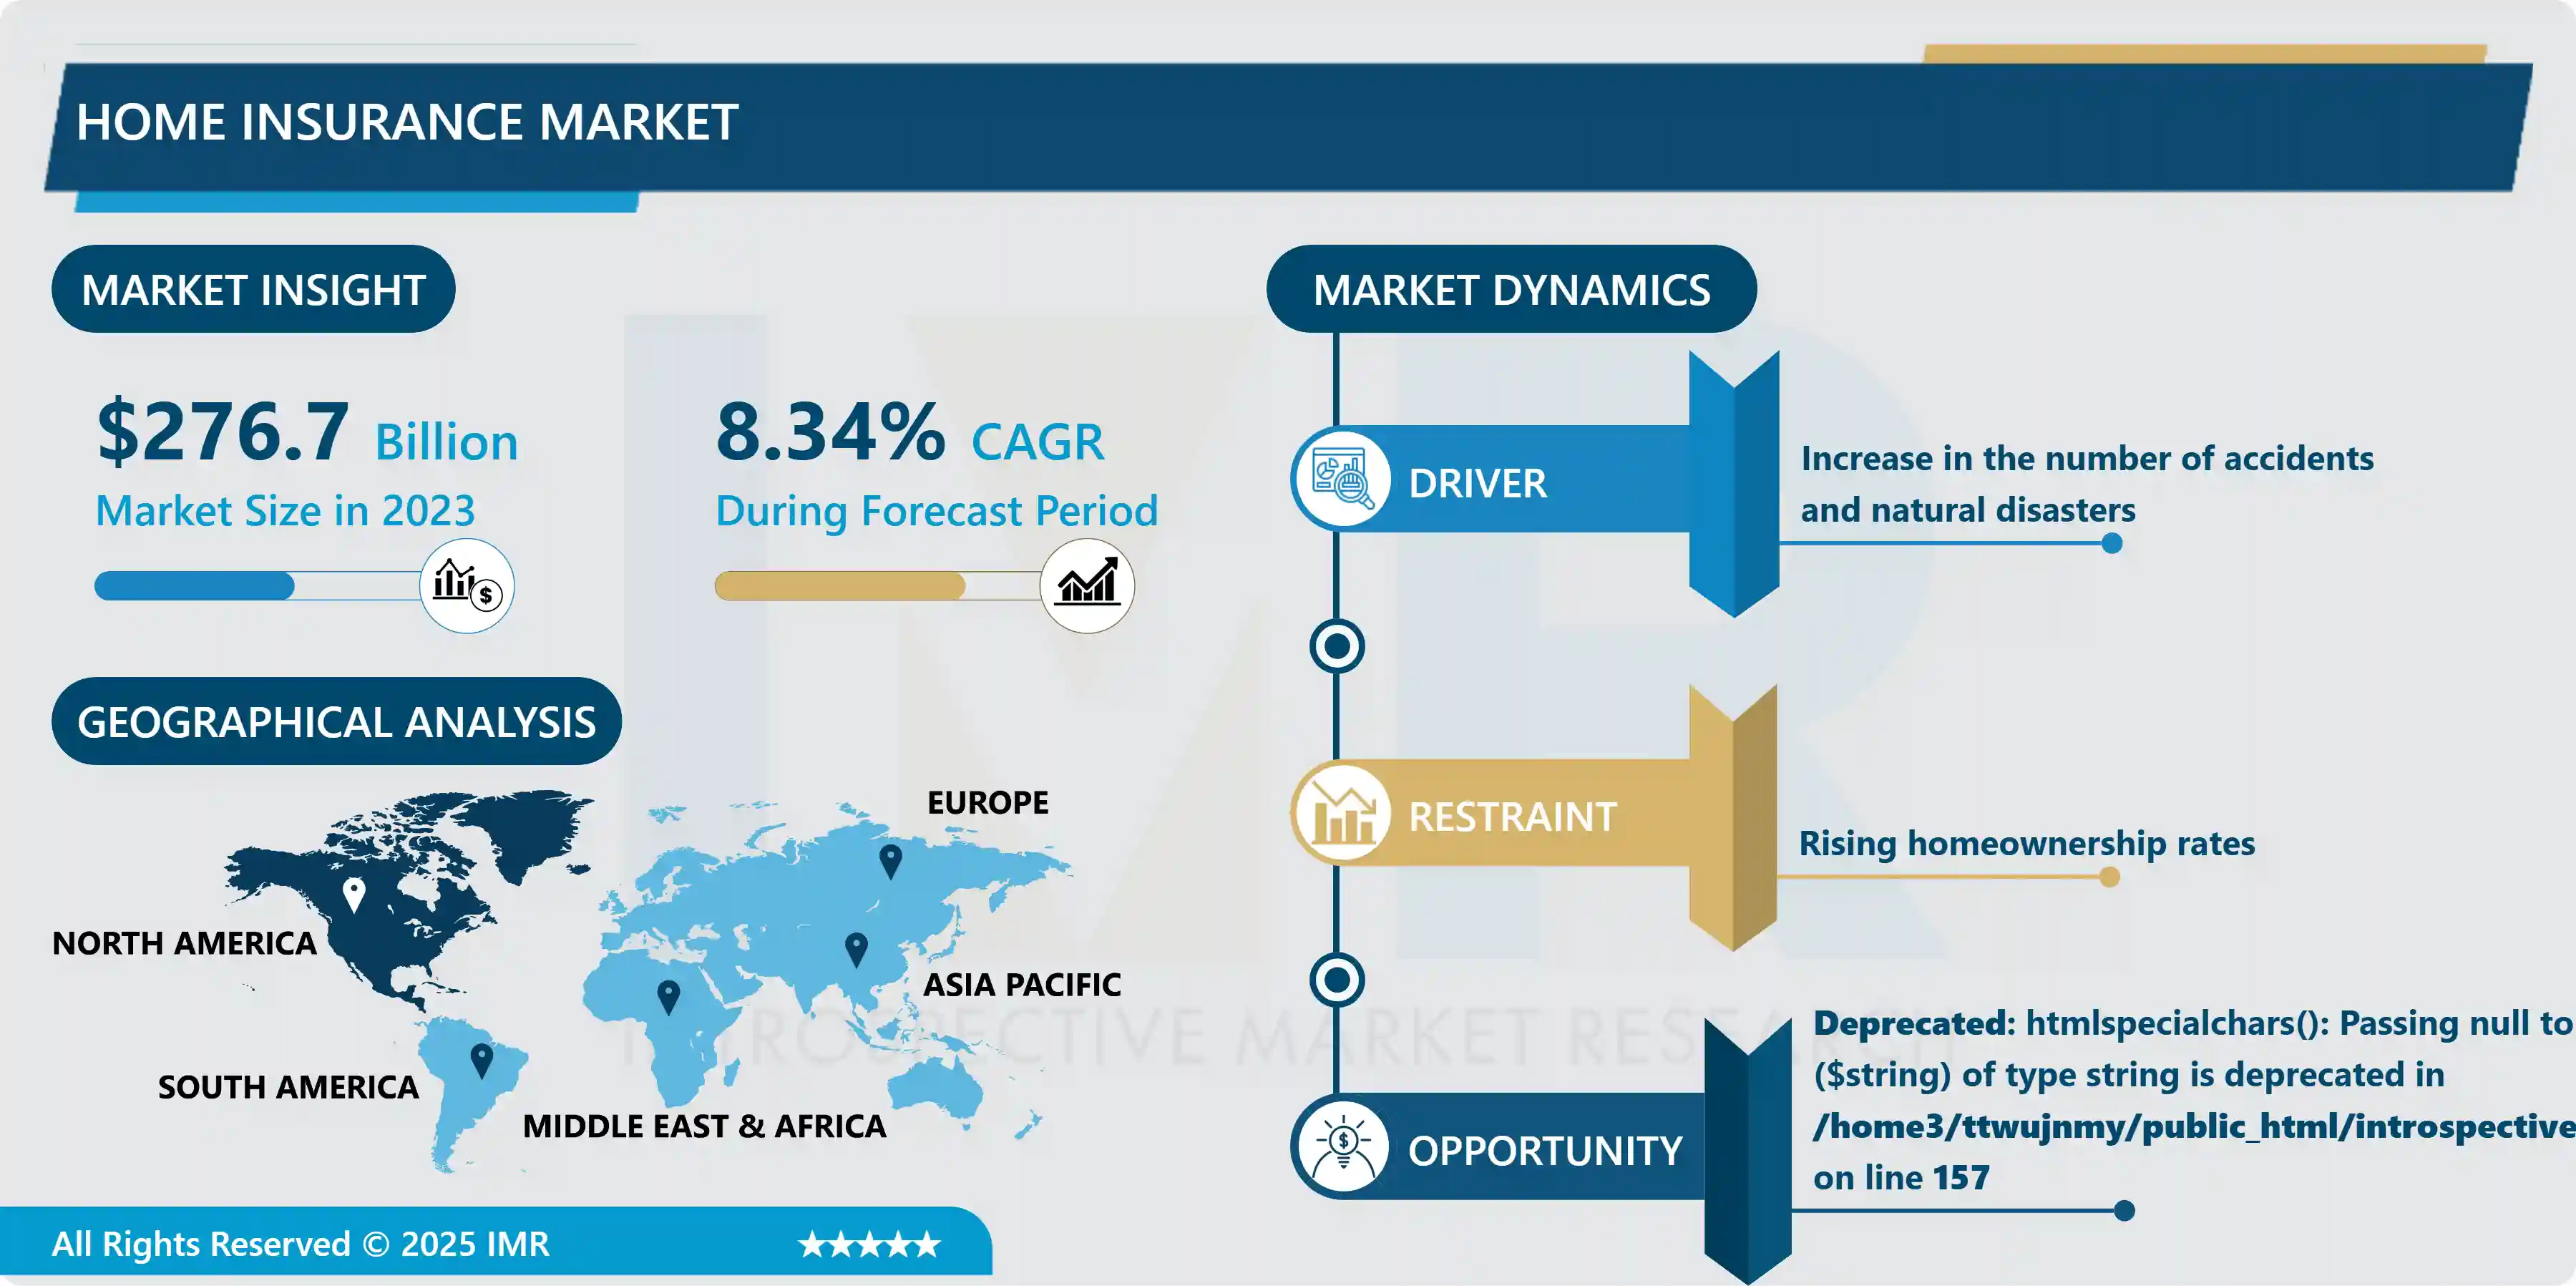
Global Home Insurance Market Size Was Valued at USD 276.70 Billion in 2023 and is Projected to Reach USD 569 Billion by 2032, Growing at a CAGR of 8.34% From 2024-2032.
Home insurance also referred to as called homeowners insurance or hazard insurance is property insurance that covers individual residence losses and damages with furnishing and other assets damages. Depending on the policy, changes the home insurance but most insurance plan offers coverage for risks like thunderstorms, burglary, and fire.
In September 1950, the first home insurance policy was introduced in the United States. Several numbers of insurance companies sell various options of insurance that contains casualty insurance and general property. Owing to different natural crises such as earthquakes, typhoons, cyclones, floods, and landslides, property damages are increased, and thus different home insurance companies engage in distribution network improvements and innovations. Furthermore, with rising the usage of advanced technology in the home insurance sector, thus the market for home insurance is predicted to develop during the projection period.
It encompasses various types of policies designed to protect homes against a range of risks, including natural disasters, theft, vandalism, and liability claims. With increasing awareness about the importance of protecting one's property, the market has experienced steady growth over the years.
Several factors contribute to the growth of the home insurance market, including urbanization, which has led to a surge in property ownership. As more people invest in homes, the demand for insurance coverage to safeguard these assets has increased. Additionally, advancements in technology have revolutionized the insurance industry, allowing for more personalized policies, quicker claim processes, and the integration of smart home devices that enhance security and risk assessment.

Global Home Insurance Market Trend Analysis
Increase in the number of accidents and natural disasters
- The escalating frequency and severity of accidents and natural disasters have become pivotal drivers in the expansion of the global home insurance market. As climate change accelerates, the world witnesses a surge in extreme weather events such as hurricanes, wildfires, floods, and storms. These occurrences pose substantial risks to residential properties, compelling homeowners to seek robust insurance coverage to safeguard their investments.
- The uptick in accidents, including domestic mishaps and unforeseen incidents, further underscores the need for comprehensive home insurance. Accidental damage, whether caused by human error or sudden events within the household, can result in significant financial burdens for homeowners. This realization has led to an increased demand for insurance policies that encompass a broader scope of coverage, providing financial protection against both natural disasters and accidental damage.
- Insurers are responding to these escalating risks by adapting their offerings and risk assessment methodologies. They're integrating sophisticated technologies and data analytics to better evaluate and mitigate risks, offering more tailored policies that address the specific vulnerabilities of individual homes
Technology Integration
- The integration of IoT devices like smart home sensors and security systems presents a transformative opportunity for insurers operating within the home insurance market. These technological advancements enable insurers to revolutionize risk assessment by tapping into real-time data streams generated by these devices. By accessing information on a home's security, environmental conditions, and potential risks, insurers gain unprecedented insights into a property's vulnerabilities and can tailor policies accordingly.
- These IoT devices serve as proactive tools in risk prevention rather than mere reactive solutions. Smart sensors can detect anomalies such as water leaks, fire hazards, or unauthorized access, enabling timely intervention and minimizing potential damages. By incentivizing policyholders to adopt such technologies through discounts or specialized coverage, insurers can foster a culture of risk mitigation, reducing claims frequency and severity.
- The wealth of data collected from these devices empowers insurers to create personalized policies. This level of customization based on actual, real-time data not only enhances accuracy in risk assessment but also allows for dynamic policy adjustments. Homeowners benefit from policies specifically designed to match their unique needs and risk profiles, fostering greater satisfaction and loyalty.
Global Home Insurance Market Segment Analysis:
Global Home Insurance Market Segmented on the basis of type, application, and end-users.
By Type, dwelling coverage segment is expected to dominate the market during the forecast period
- With rising property values worldwide, homeowners are more inclined to protect their significant investments. Higher property values necessitate more comprehensive coverage, leading to increased demand for dwelling coverage. The escalating frequency and severity of natural disasters, like hurricanes, floods, wildfires, and storms, have amplified awareness of the vulnerability of homes to such perils. Consequently, homeowners seek robust dwelling coverage to safeguard their properties against these risks.
- A surge in renovation and home improvement projects has propelled the need for increased coverage. Homeowners invest in their properties, prompting them to reassess and upgrade their insurance policies to adequately cover these enhancements. The integration of smart home technology has become increasingly prevalent. Insurers offer policies that cover these sophisticated systems, thereby driving the growth of dwelling coverage as homeowners seek to protect these valuable assets.
By Application, personal home insurance segment held the largest share of 75% in 2022
-
Personal home insurance serves as a critical safety net for homeowners, shielding their property and possessions from unforeseen risks. This comprehensive insurance coverage encompasses various facets, including protection for the physical structure of the home, personal belongings, liability coverage, and additional living expenses in case of displacement due to covered events.
- The policy's core, dwelling coverage, shields the house itself against a spectrum of perils, spanning from natural disasters like earthquakes and fires to vandalism or theft. Complementing this, personal property coverage extends its safeguarding embrace over the items within the home, such as furniture, electronics, and other possessions. This ensures financial support in the event of theft, damage, or loss, offering homeowners a sense of security regarding their belongings.
- personal home insurance also includes liability coverage. This aspect proves invaluable by shielding homeowners from potential legal or medical expenses arising from accidents or injuries sustained by others while on their property. Moreover, the provision for additional living expenses steps in to alleviate financial burdens when the home becomes uninhabitable due to covered events, covering costs for temporary accommodation or increased living expenses.
Global Home Insurance Market Regional Insights:
North America is Expected to Dominate the Market Over the Forecast period
- North America dominates the home insurance market owing to the highest number of homes affected by natural disasters such as hurricanes, volcanic, floods, tornadoes, and others. Thus, there is rising demand for insurance services in this region. The peoples in the North American region are more aware of the various insurance plan. Moreover, the presence of several home insurance provider companies in this region boosts the growth of the home insurance market in this region
- The Asia Pacific is the second-dominated region in the home Insurance Market. This is due to the highest number of populations with increased demand for better housing services. Due to the large population base, the damage occurs by hurricanes, volcanic, floods, tornadoes, and others are very high. For instance, according to Statista, Indonesia is one of the highest rates of natural diester in the world. In 2021 there were 21.34 thousand residential buildings damaged due to natural disasters. Additionally, the growing per capita income in the Asia Pacific countries like India, China, Vietnam, and others. So, people in this region are more aware of home insurance, and the government of various countries in this region increasing their investment in home insurance policies that reinforce the growth of the home insurance market in the APAC region.
- Europe is the fastest growing region in the home insurance market due to the high number of insurance providers and consumers present in this region. Owing to natural disasters, damage occurrence is high in this region. For instance, in 2021, the flood impacted Germany, Belgium, and Luxembourg. More than 26,000 homes were destroyed in Belgium. Moreover, the number of property crime incidences such as vandalism, theft, and others in this region is rising. For instance, according to Statista, approximately 56.9 thousand cases of vandalism were registered in 2020 in Belgium, and in Netherland, there were 71, 990 cases of vandalism registered in 2021. Thus, increasing the number of home insurance consumers maximizes the growth of the home insurance market in the Europe region.
Global Home Insurance Market Top Key Players:
- Allstate Insurance Company (USA)
- American International Group Inc. (US)
- AXA (France)
- Chubb (US)
- State Farm (US)
- Nationwide (US)
- Allstate (US)
- Chubb Limited (US)
- Farmers Insurance Group (US)
- Progressive (US)
- Liberty Mutual (US)
- AXA Group (Europe)
- Munich Re(Europe)
- ALLIANZ(Germany)
- ADMIRAL (UK)
- Liberty Mutual Insurance Company (Boston)
- PICC (Switzerland)
- State Farm Mutual Automobile Insurance Company (Bloomington)
- Zurich (Switzerland)
- AFLAC (Columbus)
- Geico (Maryland)
- BUPA (UK)
- PingAn (China)
- Kunlun (China)
- Shelter Insurance (Columbia)
Key Industry Developments in the Global Home Insurance Market:
- In April 2023, according to a consent order filed by the Office of Insurance Regulation (OIR), Tailrow Insurance Co., part of HCI Group, was approved by the Florida OIR as a domestic homeowners multiperil insurer.
- In October 2023, Allianz and Munich Re: Partnered to launch a pilot program in Germany offering parametric flood insurance. This type of insurance pays out based on predetermined parameters like flood water levels, eliminating the need for traditional claims adjusters.
- In November 2023, Allstate, started offering a bundled homeowners insurance policy that includes cyber insurance coverage, protecting against identity theft, data breaches, and cyberattacks.
- In April 2024, The leading digital insurance company, announced the launch of Homeowners insurance in France, building upon its successful partnership with BNP Paribas Cardif. With significant growth in its European business in 2023, Lemonade's expansion into Homeowners insurance in France marks a strategic move in its global expansion plans. Lemonade CEO and co-founder, Daniel Schreiber, emphasized the company's evolution from a monoline to a multi-line insurer in Europe.
|
Global Home Insurance Market |
|||
|
Base Year: |
2023 |
Forecast Period: |
2024-2032 |
|
Historical Data: |
2017 to 2023 |
Market Size in 2023: |
USD 276.70 Bn. |
|
Forecast Period 2024-32 CAGR: |
8.34% |
Market Size in 2032: |
USD 569 Bn. |
|
Segments Covered: |
By Type |
|
|
|
By Application |
|
||
|
By End User |
|
||
|
By Region |
|
||
|
Key Market Drivers: |
|
||
|
Key Market Restraints: |
|
||
Chapter 1: Introduction
1.1 Scope and Coverage
Chapter 2:Executive Summary
Chapter 3: Market Landscape
3.1 Market Dynamics
3.1.1 Drivers
3.1.2 Restraints
3.1.3 Opportunities
3.1.4 Challenges
3.2 Market Trend Analysis
3.3 PESTLE Analysis
3.4 Porter's Five Forces Analysis
3.5 Industry Value Chain Analysis
3.6 Ecosystem
3.7 Regulatory Landscape
3.8 Price Trend Analysis
3.9 Patent Analysis
3.10 Technology Evolution
3.11 Investment Pockets
3.12 Import-Export Analysis
Chapter 4: Home Insurance Market by Type (2018-2032)
4.1 Home Insurance Market Snapshot and Growth Engine
4.2 Market Overview
4.3 Comprehensive Coverage
4.3.1 Introduction and Market Overview
4.3.2 Historic and Forecasted Market Size in Value USD and Volume Units
4.3.3 Key Market Trends, Growth Factors, and Opportunities
4.3.4 Geographic Segmentation Analysis
4.4 Dwelling Coverage
4.5 Content Coverage
Chapter 5: Home Insurance Market by Application (2018-2032)
5.1 Home Insurance Market Snapshot and Growth Engine
5.2 Market Overview
5.3 Personal
5.3.1 Introduction and Market Overview
5.3.2 Historic and Forecasted Market Size in Value USD and Volume Units
5.3.3 Key Market Trends, Growth Factors, and Opportunities
5.3.4 Geographic Segmentation Analysis
5.4 Enterprise
Chapter 6: Home Insurance Market by End User (2018-2032)
6.1 Home Insurance Market Snapshot and Growth Engine
6.2 Market Overview
6.3 Landlords
6.3.1 Introduction and Market Overview
6.3.2 Historic and Forecasted Market Size in Value USD and Volume Units
6.3.3 Key Market Trends, Growth Factors, and Opportunities
6.3.4 Geographic Segmentation Analysis
6.4 Tenants
Chapter 7: Company Profiles and Competitive Analysis
7.1 Competitive Landscape
7.1.1 Competitive Benchmarking
7.1.2 Home Insurance Market Share by Manufacturer (2024)
7.1.3 Industry BCG Matrix
7.1.4 Heat Map Analysis
7.1.5 Mergers and Acquisitions
7.2 E-LABS INCACCUTEK TESTING LABORATORY
7.2.1 Company Overview
7.2.2 Key Executives
7.2.3 Company Snapshot
7.2.4 Role of the Company in the Market
7.2.5 Sustainability and Social Responsibility
7.2.6 Operating Business Segments
7.2.7 Product Portfolio
7.2.8 Business Performance
7.2.9 Key Strategic Moves and Recent Developments
7.2.10 SWOT Analysis
7.3 THE ADVANCED TEAM INCELEMENT MATERIALS TECHNOLOGY
7.4 F2LABS
7.5 IMR TEST LABS INCHECK TECHNOLOGIES INC
7.6 INTEGRITY TESTING LABORATORY
7.7 JG&A METROLOGY CENTER
7.8 LASER PRODUCT SAFETY
7.9 MICRO QUALITY CALIBRATION
7.10 RNDT INCSHERRY LABORATORIES
7.11 SUN ADVANCED PRODUCT TESTING LAB
7.12 TÜV RHEINLAND
7.13 AIRGASON-SITE SAFETY SERVICES
7.14 ALCO
7.15 OTHER KEY PLAYERS
Chapter 8: Global Home Insurance Market By Region
8.1 Overview
8.2. North America Home Insurance Market
8.2.1 Key Market Trends, Growth Factors and Opportunities
8.2.2 Top Key Companies
8.2.3 Historic and Forecasted Market Size by Segments
8.2.4 Historic and Forecasted Market Size by Type
8.2.4.1 Comprehensive Coverage
8.2.4.2 Dwelling Coverage
8.2.4.3 Content Coverage
8.2.5 Historic and Forecasted Market Size by Application
8.2.5.1 Personal
8.2.5.2 Enterprise
8.2.6 Historic and Forecasted Market Size by End User
8.2.6.1 Landlords
8.2.6.2 Tenants
8.2.7 Historic and Forecast Market Size by Country
8.2.7.1 US
8.2.7.2 Canada
8.2.7.3 Mexico
8.3. Eastern Europe Home Insurance Market
8.3.1 Key Market Trends, Growth Factors and Opportunities
8.3.2 Top Key Companies
8.3.3 Historic and Forecasted Market Size by Segments
8.3.4 Historic and Forecasted Market Size by Type
8.3.4.1 Comprehensive Coverage
8.3.4.2 Dwelling Coverage
8.3.4.3 Content Coverage
8.3.5 Historic and Forecasted Market Size by Application
8.3.5.1 Personal
8.3.5.2 Enterprise
8.3.6 Historic and Forecasted Market Size by End User
8.3.6.1 Landlords
8.3.6.2 Tenants
8.3.7 Historic and Forecast Market Size by Country
8.3.7.1 Russia
8.3.7.2 Bulgaria
8.3.7.3 The Czech Republic
8.3.7.4 Hungary
8.3.7.5 Poland
8.3.7.6 Romania
8.3.7.7 Rest of Eastern Europe
8.4. Western Europe Home Insurance Market
8.4.1 Key Market Trends, Growth Factors and Opportunities
8.4.2 Top Key Companies
8.4.3 Historic and Forecasted Market Size by Segments
8.4.4 Historic and Forecasted Market Size by Type
8.4.4.1 Comprehensive Coverage
8.4.4.2 Dwelling Coverage
8.4.4.3 Content Coverage
8.4.5 Historic and Forecasted Market Size by Application
8.4.5.1 Personal
8.4.5.2 Enterprise
8.4.6 Historic and Forecasted Market Size by End User
8.4.6.1 Landlords
8.4.6.2 Tenants
8.4.7 Historic and Forecast Market Size by Country
8.4.7.1 Germany
8.4.7.2 UK
8.4.7.3 France
8.4.7.4 The Netherlands
8.4.7.5 Italy
8.4.7.6 Spain
8.4.7.7 Rest of Western Europe
8.5. Asia Pacific Home Insurance Market
8.5.1 Key Market Trends, Growth Factors and Opportunities
8.5.2 Top Key Companies
8.5.3 Historic and Forecasted Market Size by Segments
8.5.4 Historic and Forecasted Market Size by Type
8.5.4.1 Comprehensive Coverage
8.5.4.2 Dwelling Coverage
8.5.4.3 Content Coverage
8.5.5 Historic and Forecasted Market Size by Application
8.5.5.1 Personal
8.5.5.2 Enterprise
8.5.6 Historic and Forecasted Market Size by End User
8.5.6.1 Landlords
8.5.6.2 Tenants
8.5.7 Historic and Forecast Market Size by Country
8.5.7.1 China
8.5.7.2 India
8.5.7.3 Japan
8.5.7.4 South Korea
8.5.7.5 Malaysia
8.5.7.6 Thailand
8.5.7.7 Vietnam
8.5.7.8 The Philippines
8.5.7.9 Australia
8.5.7.10 New Zealand
8.5.7.11 Rest of APAC
8.6. Middle East & Africa Home Insurance Market
8.6.1 Key Market Trends, Growth Factors and Opportunities
8.6.2 Top Key Companies
8.6.3 Historic and Forecasted Market Size by Segments
8.6.4 Historic and Forecasted Market Size by Type
8.6.4.1 Comprehensive Coverage
8.6.4.2 Dwelling Coverage
8.6.4.3 Content Coverage
8.6.5 Historic and Forecasted Market Size by Application
8.6.5.1 Personal
8.6.5.2 Enterprise
8.6.6 Historic and Forecasted Market Size by End User
8.6.6.1 Landlords
8.6.6.2 Tenants
8.6.7 Historic and Forecast Market Size by Country
8.6.7.1 Turkiye
8.6.7.2 Bahrain
8.6.7.3 Kuwait
8.6.7.4 Saudi Arabia
8.6.7.5 Qatar
8.6.7.6 UAE
8.6.7.7 Israel
8.6.7.8 South Africa
8.7. South America Home Insurance Market
8.7.1 Key Market Trends, Growth Factors and Opportunities
8.7.2 Top Key Companies
8.7.3 Historic and Forecasted Market Size by Segments
8.7.4 Historic and Forecasted Market Size by Type
8.7.4.1 Comprehensive Coverage
8.7.4.2 Dwelling Coverage
8.7.4.3 Content Coverage
8.7.5 Historic and Forecasted Market Size by Application
8.7.5.1 Personal
8.7.5.2 Enterprise
8.7.6 Historic and Forecasted Market Size by End User
8.7.6.1 Landlords
8.7.6.2 Tenants
8.7.7 Historic and Forecast Market Size by Country
8.7.7.1 Brazil
8.7.7.2 Argentina
8.7.7.3 Rest of SA
Chapter 9 Analyst Viewpoint and Conclusion
9.1 Recommendations and Concluding Analysis
9.2 Potential Market Strategies
Chapter 10 Research Methodology
10.1 Research Process
10.2 Primary Research
10.3 Secondary Research
|
Global Home Insurance Market |
|||
|
Base Year: |
2023 |
Forecast Period: |
2024-2032 |
|
Historical Data: |
2017 to 2023 |
Market Size in 2023: |
USD 276.70 Bn. |
|
Forecast Period 2024-32 CAGR: |
8.34% |
Market Size in 2032: |
USD 569 Bn. |
|
Segments Covered: |
By Type |
|
|
|
By Application |
|
||
|
By End User |
|
||
|
By Region |
|
||
|
Key Market Drivers: |
|
||
|
Key Market Restraints: |
|
||


