


Protein Ingredients Market Synopsis
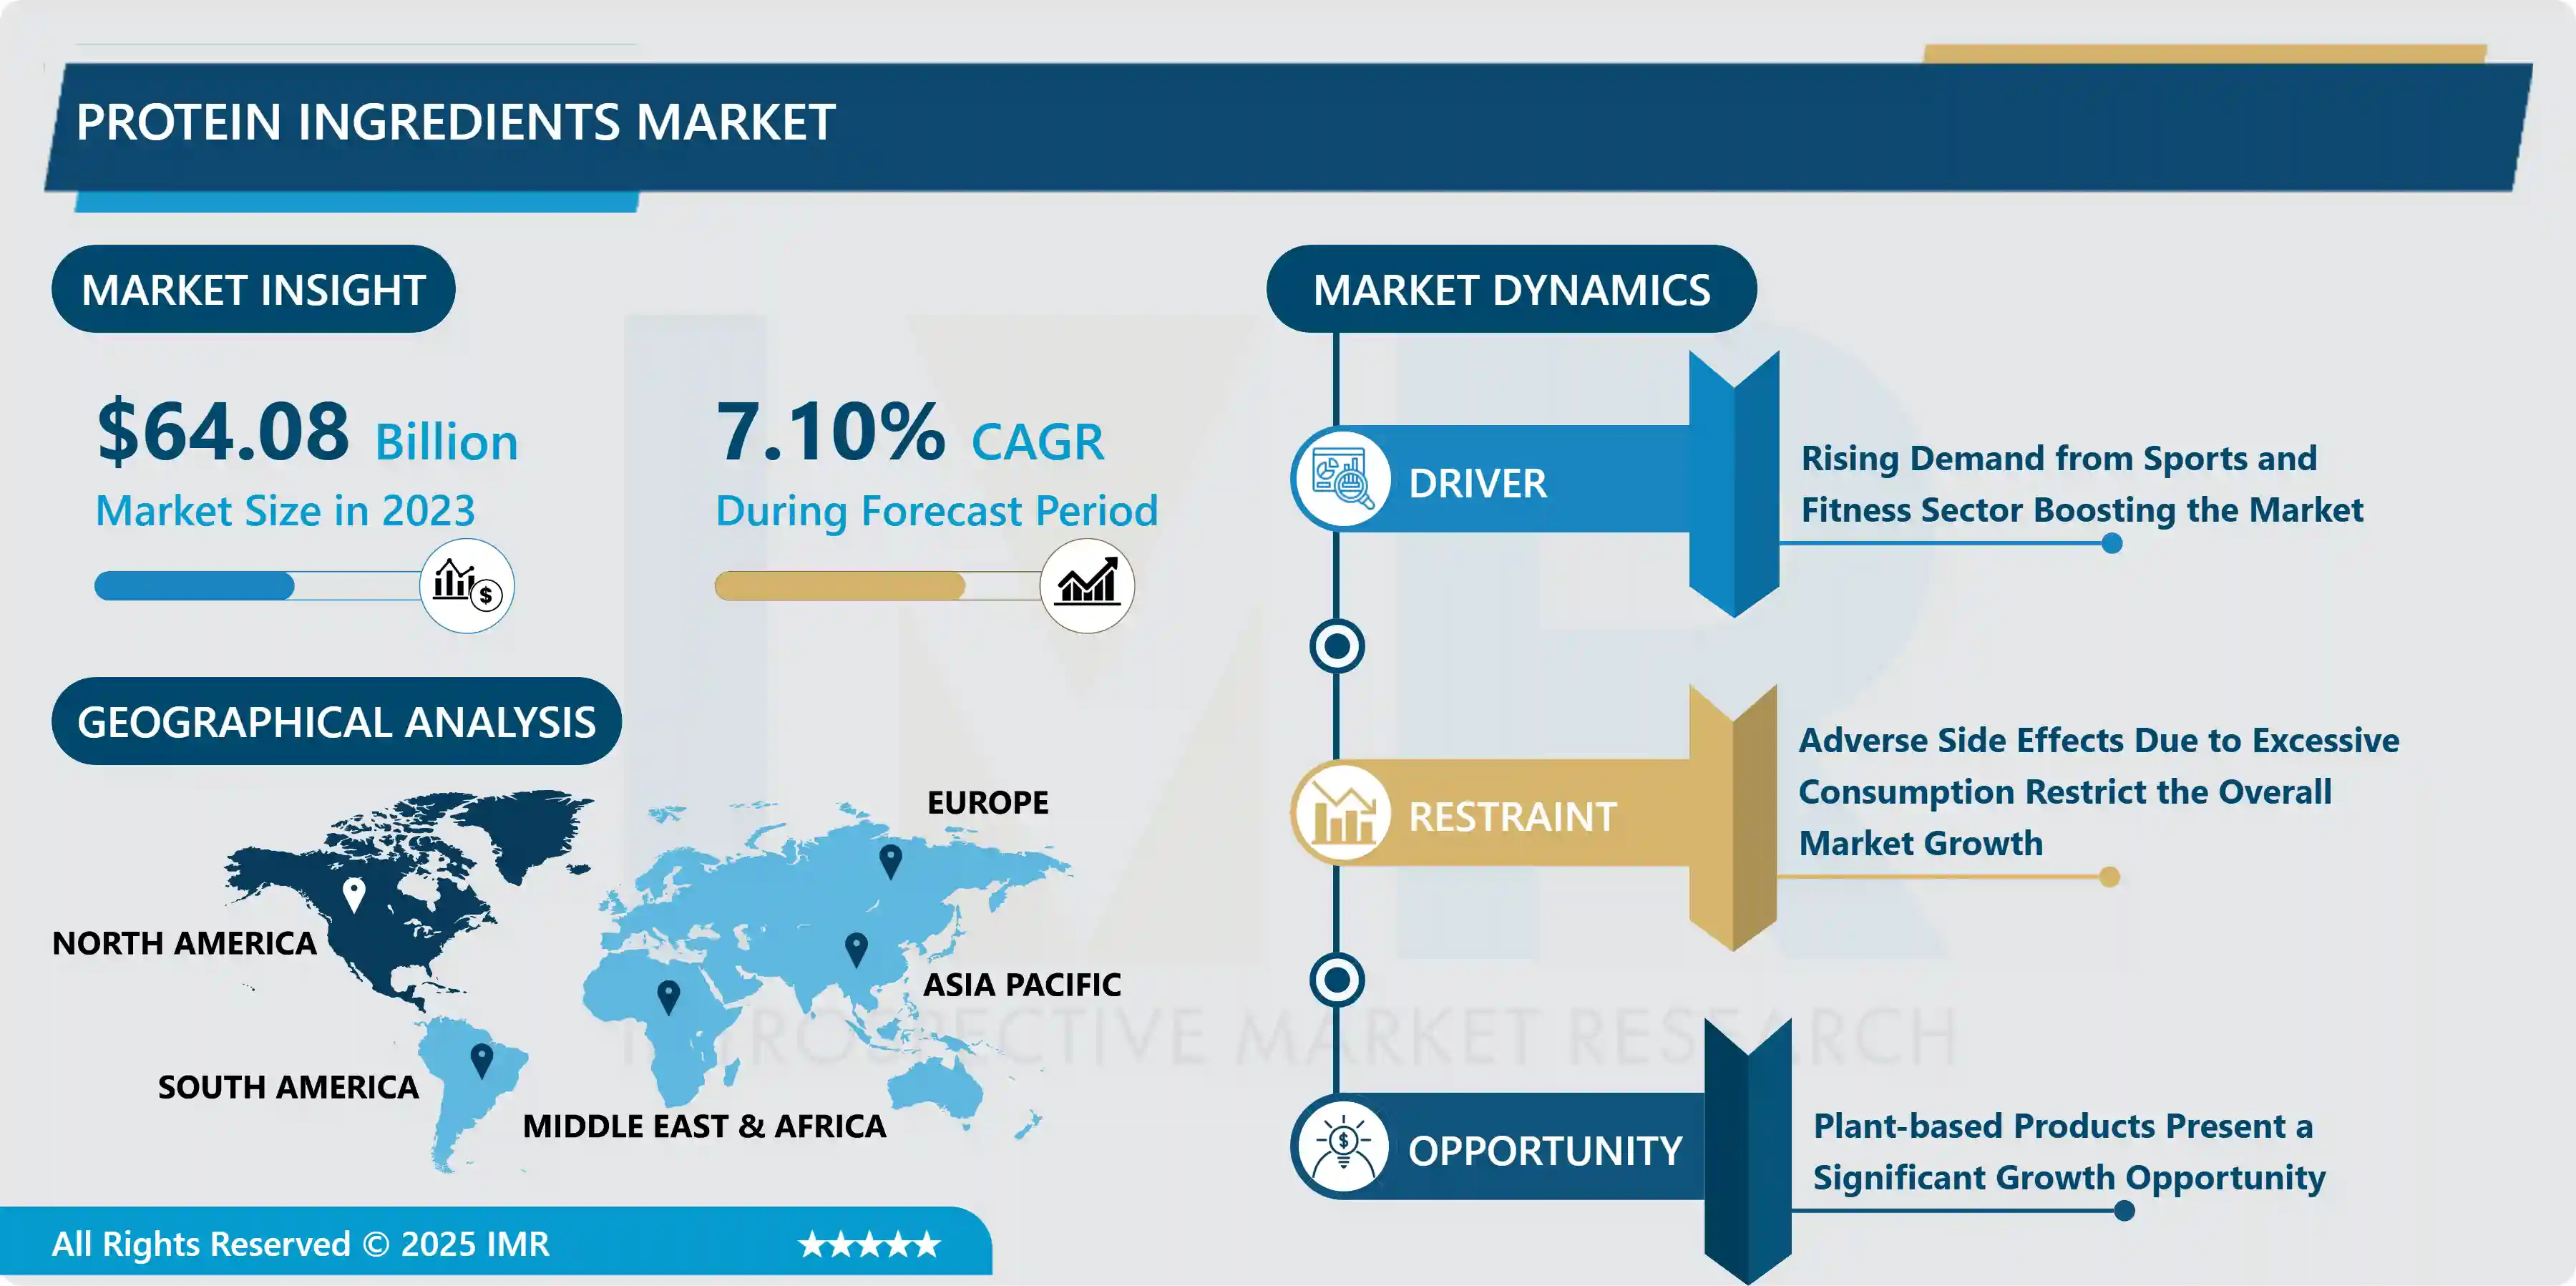
Protein Ingredients Market Size Was Valued at USD 64.08 Billion in 2023, and is Projected to Reach USD 118.8 Billion by 2032, Growing at a CAGR of 7.1% From 2024-2032.
The protein ingredients market is a dynamic and growing sector, driven by the essential role of proteins as building blocks for bones, muscles, skin, and blood. Proteins, composed of amino acids, are critical for the production of hormones, enzymes, and other bodily substances. Protein ingredients are derived from diverse sources, including animals, plants, insects, and microorganisms, each offering unique properties such as viscosity, foaming, emulsification, water binding, and nutritional value. With increasing consumer awareness of the role of protein in maintaining overall health and combating issues like obesity, there is a rising preference for protein-rich foods and supplements, bolstering the growth of this market.
A surge in health and wellness trends has prompted consumers to seek functional and fortified foods with higher protein content. This shift is fueled by socio-economic factors such as rising incomes, urbanization, and aging populations, where protein’s contribution to healthy aging is gaining recognition. Fitness enthusiasts and athletes are increasingly adopting high-protein diets to support muscle growth and recovery, further driving demand. Additionally, the growing market for plant-based proteins aligns with the expanding preference for sustainable and health-conscious dietary options, catering to diverse consumer needs and dietary preferences.
The global protein ingredients market is further propelled by the popularity of soy protein products, increasing demand for convenience foods enriched with nutrients, and the rising preference for fortified foods. With health-conscious lifestyles becoming mainstream, protein supplements made from both animal and plant sources are gaining traction. As a result, the protein ingredients market continues to experience robust growth, driven by innovation and consumer demand for nutritious, versatile, and functional food products.
 Protein Ingredients Market Trend Analysis
Rising Demand from Sports and Fitness Sector Boosting the Market
- The rising demand from the sports and fitness sector has emerged as a pivotal growth factor for the protein ingredients market, driving increased consumption and innovation within the industry. This surge can be attributed to a confluence of factors that underscore the crucial role of protein in enhancing athletic performance, supporting muscle recovery, and meeting the nutritional needs of an increasingly health-conscious consumer base. ?
- This demand is the heightened awareness of the importance of protein in building and repairing muscles, a key consideration for individuals engaged in sports and fitness activities. Proteins are composed of amino acids, the building blocks of muscles, and their consumption is crucial for promoting muscle growth and recovery. Athletes and fitness enthusiasts are increasingly recognizing the significance of incorporating high-quality protein sources into their diets to optimize training outcomes and achieve peak physical performance. ?
- Moreover, the growing trend of wellness and fitness across the globe has spurred a rise in the number of individuals participating in various sports and fitness activities. As people become more health-conscious and fitness-oriented, the demand for protein supplements and fortified foods has witnessed a substantial upswing. Protein ingredients, such as whey, casein, soy, and pea proteins, are gaining popularity as convenient and effective ways to meet the elevated protein requirements of active individuals. ?
- Additionally, advancements in sports nutrition science and the evolving preferences of consumers have led to the development of innovative protein formulations, including plant-based and alternative protein sources. This diversification caters to a broader consumer base, including those with specific dietary preferences and restrictions.
Plant-based Products Present a Significant Growth Opportunity
- Plant-based products present a significant opportunity within the protein ingredients market due to growing consumer demand for sustainable and healthier food choices. As awareness of environmental issues, animal welfare, and personal health continues to rise, more people are seeking alternatives to traditional animal-based proteins. This shift in consumer preferences has led to the rapid expansion of the plant-based protein market, creating a lucrative opportunity for businesses in the protein ingredients sector.
- The increasing popularity of plant-based products is the desire for sustainable and eco-friendly food options. The production of plant-based proteins generally has a lower environmental impact compared to traditional animal farming. Plant-based agriculture often requires less land, water, and resources, contributing to reduced greenhouse gas emissions and biodiversity preservation. As global concerns about climate change intensify, consumers are increasingly motivated to make environmentally conscious choices, making plant-based protein ingredients an attractive option for both manufacturers and consumers.
- Furthermore, the health benefits associated with plant-based diets contribute to the growth of the plant-based protein market. Plant-based proteins are often lower in saturated fat and cholesterol while being rich in essential nutrients, fiber, and antioxidants. This aligns with the rising consumer awareness of the link between diet and health, driving the demand for plant-based alternatives as a means of maintaining a balanced and nutritious lifestyle.
Protein Ingredients Market Segment Analysis:
Protein Ingredients Market Segmented on the basis of product type, form, and application.
By Product Type, Plant Protein segment is expected to dominate the market during the forecast period
- The rising global demand for plant-based and vegetarian food options is driven by increasing awareness of health and environmental concerns. Consumers are increasingly choosing plant protein products as a sustainable and ethical alternative to animal-derived proteins. Additionally, advancements in food technology have led to the development of innovative plant-based protein ingredients that mimic the taste and texture of traditional animal proteins, enhancing the overall appeal of plant protein products. As more consumers seek healthier and environmentally friendly dietary choices, the Plant Protein segment is poised for continued expansion in the Protein Ingredients Market.
By Application, Nutritional Supplements segment held the largest share of 42% in 2022
- The rising health awareness and a growing emphasis on fitness have driven increased consumer interest in protein supplements as a convenient and effective means of meeting dietary requirements. Additionally, the expanding aging population, coupled with a focus on healthy aging and muscle maintenance, has fueled demand for protein-rich supplements. Furthermore, the trend towards plant-based and alternative protein sources has led to the development of innovative protein supplements, attracting a broader consumer base. The convenience, versatility, and perceived health benefits of nutritional supplements contribute to the significant growth witnessed in this segment of the Protein Ingredients Market.
Protein Ingredients Market Regional Insights:
North America is Expected to Dominate the Market Over the Forecast period
- North America region is projected to dominate the protein ingredients market. An increasing demand for dietary supplements, high-performance products, animal-based protein, and others helps the growth of the market. In addition, stability in the spending of the consumers in the U.S. and changes in the Food Safety Modernization Act may mean that America’s food safety laws will concentrate more on the prevention of food abomination, rather than responding to claims of food adulteration.
- Moreover, the fitness and wellness trend has gained significant momentum in North America, leading to an upsurge in demand for protein supplements and functional foods. Manufacturers are capitalizing on this trend by incorporating protein ingredients into a variety of products to cater to health-conscious consumers. The region's well-established food and beverage industry, coupled with ongoing innovations in protein ingredient formulations, further contributes to the market's growth.
Protein Ingredients Market Top Key Players:
- Hilmar (US)
- Archer Daniel Midland (US)
- CHS (US)
- Glanbia Foods (Ireland)
- Manildra (Australia)
- Cargill (US)
- Leprino Foods (US)
- Geliko (US)
- NOW (US)
- AMCO Proteins (US)
- Vyse Gelatin (US)
- Great Lakes Gelatin (US)
- Universal (US)
- MRM (US)
- Norland (Canada)
- Healthy'N Fit (Belgium)
- Danisco (Denmark)
- Fonterra Co-operative Group Ltd (New Zealand)
- Burcon Nutrascience (Canada)
- Roquette (France)
- Arla Foods (Denmark)
- Lactalis Ingredients (France)
- Omega Protein Corporation (US)
- AGRANA (Austria) and other Major Players.
Key Industry Developments in the Protein Ingredients Market:
- In November 2024, Arla Foods Ingredients successfully moved forward with its acquisition of Volac’s Whey Nutrition business following approval from the UK’s Competition and Markets Authority. The green light came after an agreement between the two companies, signed in April 2024. The acquisition included a key processing facility in Felinfach, Wales, which specializes in whey protein isolate (WPI) production. This site became a central part of Arla Foods Ingredients’ global production network, with plans for significant investment and expansion in the years ahead, strengthening the company’s position in the whey protein sector.
- In September 2023, Cargill proudly inaugurated its first European Protein Innovation Hub in Saint-Cyr en Val, France. Designed to inspire and accelerate customers' protein-rich menu innovations, the hub features a customer experience area, a state-of-the-art test kitchen, and a pilot plant for testing new products and concepts. The facility, part of Cargill’s upgraded Saint-Cyr en Val plant near Orléans, supports co-creation and innovation in the food service sector. This milestone marks a significant enhancement to the site, which has been producing chicken specialties for leading French and European outlets for over 30 years.
|
Protein Ingredients Market |
|||
|
Base Year: |
2023 |
Forecast Period: |
2024-2032 |
|
Historical Data: |
2017 to 2023 |
Market Size in 2023: |
USD 64.08 Bn. |
|
Forecast Period 2024-32 CAGR: |
7.1% |
Market Size in 2032: |
USD 118.8 Bn. |
|
Segments Covered: |
By Product Type |
|
|
|
By Form |
|
||
|
By Application |
|
||
|
By Region |
|
||
|
Key Market Drivers: |
|
||
|
Key Market Restraints: |
|
||
|
Key Opportunities: |
|
||
|
Companies Covered in the report: |
|
||
Chapter 1: Introduction
1.1 Scope and Coverage
Chapter 2:Executive Summary
Chapter 3: Market Landscape
3.1 Market Dynamics
3.1.1 Drivers
3.1.2 Restraints
3.1.3 Opportunities
3.1.4 Challenges
3.2 Market Trend Analysis
3.3 PESTLE Analysis
3.4 Porter's Five Forces Analysis
3.5 Industry Value Chain Analysis
3.6 Ecosystem
3.7 Regulatory Landscape
3.8 Price Trend Analysis
3.9 Patent Analysis
3.10 Technology Evolution
3.11 Investment Pockets
3.12 Import-Export Analysis
Chapter 4: Protein Ingredients Market by Product Type (2018-2032)
4.1 Protein Ingredients Market Snapshot and Growth Engine
4.2 Market Overview
4.3 Animal Protein
4.3.1 Introduction and Market Overview
4.3.2 Historic and Forecasted Market Size in Value USD and Volume Units
4.3.3 Key Market Trends, Growth Factors, and Opportunities
4.3.4 Geographic Segmentation Analysis
4.4 Plant Protein
4.5 Insect Protein
4.6 Microbial Protein
Chapter 5: Protein Ingredients Market by Form (2018-2032)
5.1 Protein Ingredients Market Snapshot and Growth Engine
5.2 Market Overview
5.3 Dry
5.3.1 Introduction and Market Overview
5.3.2 Historic and Forecasted Market Size in Value USD and Volume Units
5.3.3 Key Market Trends, Growth Factors, and Opportunities
5.3.4 Geographic Segmentation Analysis
5.4 Liquid
Chapter 6: Protein Ingredients Market by Application (2018-2032)
6.1 Protein Ingredients Market Snapshot and Growth Engine
6.2 Market Overview
6.3 Food and Beverages
6.3.1 Introduction and Market Overview
6.3.2 Historic and Forecasted Market Size in Value USD and Volume Units
6.3.3 Key Market Trends, Growth Factors, and Opportunities
6.3.4 Geographic Segmentation Analysis
6.4 Infant Formulation
6.5 Animal Feed
6.6 Pharmaceuticals
6.7 Nutritional Supplements
6.8 Cosmetics
Chapter 7: Company Profiles and Competitive Analysis
7.1 Competitive Landscape
7.1.1 Competitive Benchmarking
7.1.2 Protein Ingredients Market Share by Manufacturer (2024)
7.1.3 Industry BCG Matrix
7.1.4 Heat Map Analysis
7.1.5 Mergers and Acquisitions
7.2 TRILOGY GRAINS (US)
7.2.1 Company Overview
7.2.2 Key Executives
7.2.3 Company Snapshot
7.2.4 Role of the Company in the Market
7.2.5 Sustainability and Social Responsibility
7.2.6 Operating Business Segments
7.2.7 Product Portfolio
7.2.8 Business Performance
7.2.9 Key Strategic Moves and Recent Developments
7.2.10 SWOT Analysis
7.3 ANCIENT HARVEST (US)
7.4 BIGHORN QUINOA (US)
7.5 SUNFOOD SUPERFOODS (US)
7.6 LIVING HARVEST FOODS (CANADA)
7.7 BIOANDES (FRANCE)
7.8 BIOGÉNIE (FRANCE)
7.9 QUINOA REAL (SPAIN)
7.10 BIO PARTNER SCHWEIZ (SWITZERLAND)
7.11 ECOFARM (ITALY)
7.12 QINGHAI ORGANIC (CHINA)
7.13 INNER MONGOLIA YILI GREEN FOOD (CHINA)
7.14 GANSU JIUHE AGRICULTURE DEVELOPMENT (CHINA)
7.15 HOKKAIDO MEIJIYA (JAPAN)
7.16 NIJIYA MARKET (JAPAN)
7.17 ANDEAN VALLEY FOODS (AUSTRALIA)
7.18 AGROSHAN ENTERPRISES (INDIA)
7.19 SOL FOODS (BOLIVIA)
7.20 ROYAL QUINOA (BOLIVIA) INCA CROPS (BOLIVIA)
7.21 ECOANDINO (PERU)
7.22 ANAPJI (PERU)
7.23 AGRONEGOCIOS DEL ALTIPLANO (BOLIVIA)
7.24 ALAS DEL SUR (PERU)
7.25 SALTEÑAS (BOLIVIA)
Chapter 8: Global Protein Ingredients Market By Region
8.1 Overview
8.2. North America Protein Ingredients Market
8.2.1 Key Market Trends, Growth Factors and Opportunities
8.2.2 Top Key Companies
8.2.3 Historic and Forecasted Market Size by Segments
8.2.4 Historic and Forecasted Market Size by Product Type
8.2.4.1 Animal Protein
8.2.4.2 Plant Protein
8.2.4.3 Insect Protein
8.2.4.4 Microbial Protein
8.2.5 Historic and Forecasted Market Size by Form
8.2.5.1 Dry
8.2.5.2 Liquid
8.2.6 Historic and Forecasted Market Size by Application
8.2.6.1 Food and Beverages
8.2.6.2 Infant Formulation
8.2.6.3 Animal Feed
8.2.6.4 Pharmaceuticals
8.2.6.5 Nutritional Supplements
8.2.6.6 Cosmetics
8.2.7 Historic and Forecast Market Size by Country
8.2.7.1 US
8.2.7.2 Canada
8.2.7.3 Mexico
8.3. Eastern Europe Protein Ingredients Market
8.3.1 Key Market Trends, Growth Factors and Opportunities
8.3.2 Top Key Companies
8.3.3 Historic and Forecasted Market Size by Segments
8.3.4 Historic and Forecasted Market Size by Product Type
8.3.4.1 Animal Protein
8.3.4.2 Plant Protein
8.3.4.3 Insect Protein
8.3.4.4 Microbial Protein
8.3.5 Historic and Forecasted Market Size by Form
8.3.5.1 Dry
8.3.5.2 Liquid
8.3.6 Historic and Forecasted Market Size by Application
8.3.6.1 Food and Beverages
8.3.6.2 Infant Formulation
8.3.6.3 Animal Feed
8.3.6.4 Pharmaceuticals
8.3.6.5 Nutritional Supplements
8.3.6.6 Cosmetics
8.3.7 Historic and Forecast Market Size by Country
8.3.7.1 Russia
8.3.7.2 Bulgaria
8.3.7.3 The Czech Republic
8.3.7.4 Hungary
8.3.7.5 Poland
8.3.7.6 Romania
8.3.7.7 Rest of Eastern Europe
8.4. Western Europe Protein Ingredients Market
8.4.1 Key Market Trends, Growth Factors and Opportunities
8.4.2 Top Key Companies
8.4.3 Historic and Forecasted Market Size by Segments
8.4.4 Historic and Forecasted Market Size by Product Type
8.4.4.1 Animal Protein
8.4.4.2 Plant Protein
8.4.4.3 Insect Protein
8.4.4.4 Microbial Protein
8.4.5 Historic and Forecasted Market Size by Form
8.4.5.1 Dry
8.4.5.2 Liquid
8.4.6 Historic and Forecasted Market Size by Application
8.4.6.1 Food and Beverages
8.4.6.2 Infant Formulation
8.4.6.3 Animal Feed
8.4.6.4 Pharmaceuticals
8.4.6.5 Nutritional Supplements
8.4.6.6 Cosmetics
8.4.7 Historic and Forecast Market Size by Country
8.4.7.1 Germany
8.4.7.2 UK
8.4.7.3 France
8.4.7.4 The Netherlands
8.4.7.5 Italy
8.4.7.6 Spain
8.4.7.7 Rest of Western Europe
8.5. Asia Pacific Protein Ingredients Market
8.5.1 Key Market Trends, Growth Factors and Opportunities
8.5.2 Top Key Companies
8.5.3 Historic and Forecasted Market Size by Segments
8.5.4 Historic and Forecasted Market Size by Product Type
8.5.4.1 Animal Protein
8.5.4.2 Plant Protein
8.5.4.3 Insect Protein
8.5.4.4 Microbial Protein
8.5.5 Historic and Forecasted Market Size by Form
8.5.5.1 Dry
8.5.5.2 Liquid
8.5.6 Historic and Forecasted Market Size by Application
8.5.6.1 Food and Beverages
8.5.6.2 Infant Formulation
8.5.6.3 Animal Feed
8.5.6.4 Pharmaceuticals
8.5.6.5 Nutritional Supplements
8.5.6.6 Cosmetics
8.5.7 Historic and Forecast Market Size by Country
8.5.7.1 China
8.5.7.2 India
8.5.7.3 Japan
8.5.7.4 South Korea
8.5.7.5 Malaysia
8.5.7.6 Thailand
8.5.7.7 Vietnam
8.5.7.8 The Philippines
8.5.7.9 Australia
8.5.7.10 New Zealand
8.5.7.11 Rest of APAC
8.6. Middle East & Africa Protein Ingredients Market
8.6.1 Key Market Trends, Growth Factors and Opportunities
8.6.2 Top Key Companies
8.6.3 Historic and Forecasted Market Size by Segments
8.6.4 Historic and Forecasted Market Size by Product Type
8.6.4.1 Animal Protein
8.6.4.2 Plant Protein
8.6.4.3 Insect Protein
8.6.4.4 Microbial Protein
8.6.5 Historic and Forecasted Market Size by Form
8.6.5.1 Dry
8.6.5.2 Liquid
8.6.6 Historic and Forecasted Market Size by Application
8.6.6.1 Food and Beverages
8.6.6.2 Infant Formulation
8.6.6.3 Animal Feed
8.6.6.4 Pharmaceuticals
8.6.6.5 Nutritional Supplements
8.6.6.6 Cosmetics
8.6.7 Historic and Forecast Market Size by Country
8.6.7.1 Turkiye
8.6.7.2 Bahrain
8.6.7.3 Kuwait
8.6.7.4 Saudi Arabia
8.6.7.5 Qatar
8.6.7.6 UAE
8.6.7.7 Israel
8.6.7.8 South Africa
8.7. South America Protein Ingredients Market
8.7.1 Key Market Trends, Growth Factors and Opportunities
8.7.2 Top Key Companies
8.7.3 Historic and Forecasted Market Size by Segments
8.7.4 Historic and Forecasted Market Size by Product Type
8.7.4.1 Animal Protein
8.7.4.2 Plant Protein
8.7.4.3 Insect Protein
8.7.4.4 Microbial Protein
8.7.5 Historic and Forecasted Market Size by Form
8.7.5.1 Dry
8.7.5.2 Liquid
8.7.6 Historic and Forecasted Market Size by Application
8.7.6.1 Food and Beverages
8.7.6.2 Infant Formulation
8.7.6.3 Animal Feed
8.7.6.4 Pharmaceuticals
8.7.6.5 Nutritional Supplements
8.7.6.6 Cosmetics
8.7.7 Historic and Forecast Market Size by Country
8.7.7.1 Brazil
8.7.7.2 Argentina
8.7.7.3 Rest of SA
Chapter 9 Analyst Viewpoint and Conclusion
9.1 Recommendations and Concluding Analysis
9.2 Potential Market Strategies
Chapter 10 Research Methodology
10.1 Research Process
10.2 Primary Research
10.3 Secondary Research
|
Protein Ingredients Market |
|||
|
Base Year: |
2023 |
Forecast Period: |
2024-2032 |
|
Historical Data: |
2017 to 2023 |
Market Size in 2023: |
USD 64.08 Bn. |
|
Forecast Period 2024-32 CAGR: |
7.1% |
Market Size in 2032: |
USD 118.8 Bn. |
|
Segments Covered: |
By Product Type |
|
|
|
By Form |
|
||
|
By Application |
|
||
|
By Region |
|
||
|
Key Market Drivers: |
|
||
|
Key Market Restraints: |
|
||
|
Key Opportunities: |
|
||
|
Companies Covered in the report: |
|
||


