


Precision Parts Market Synopsis
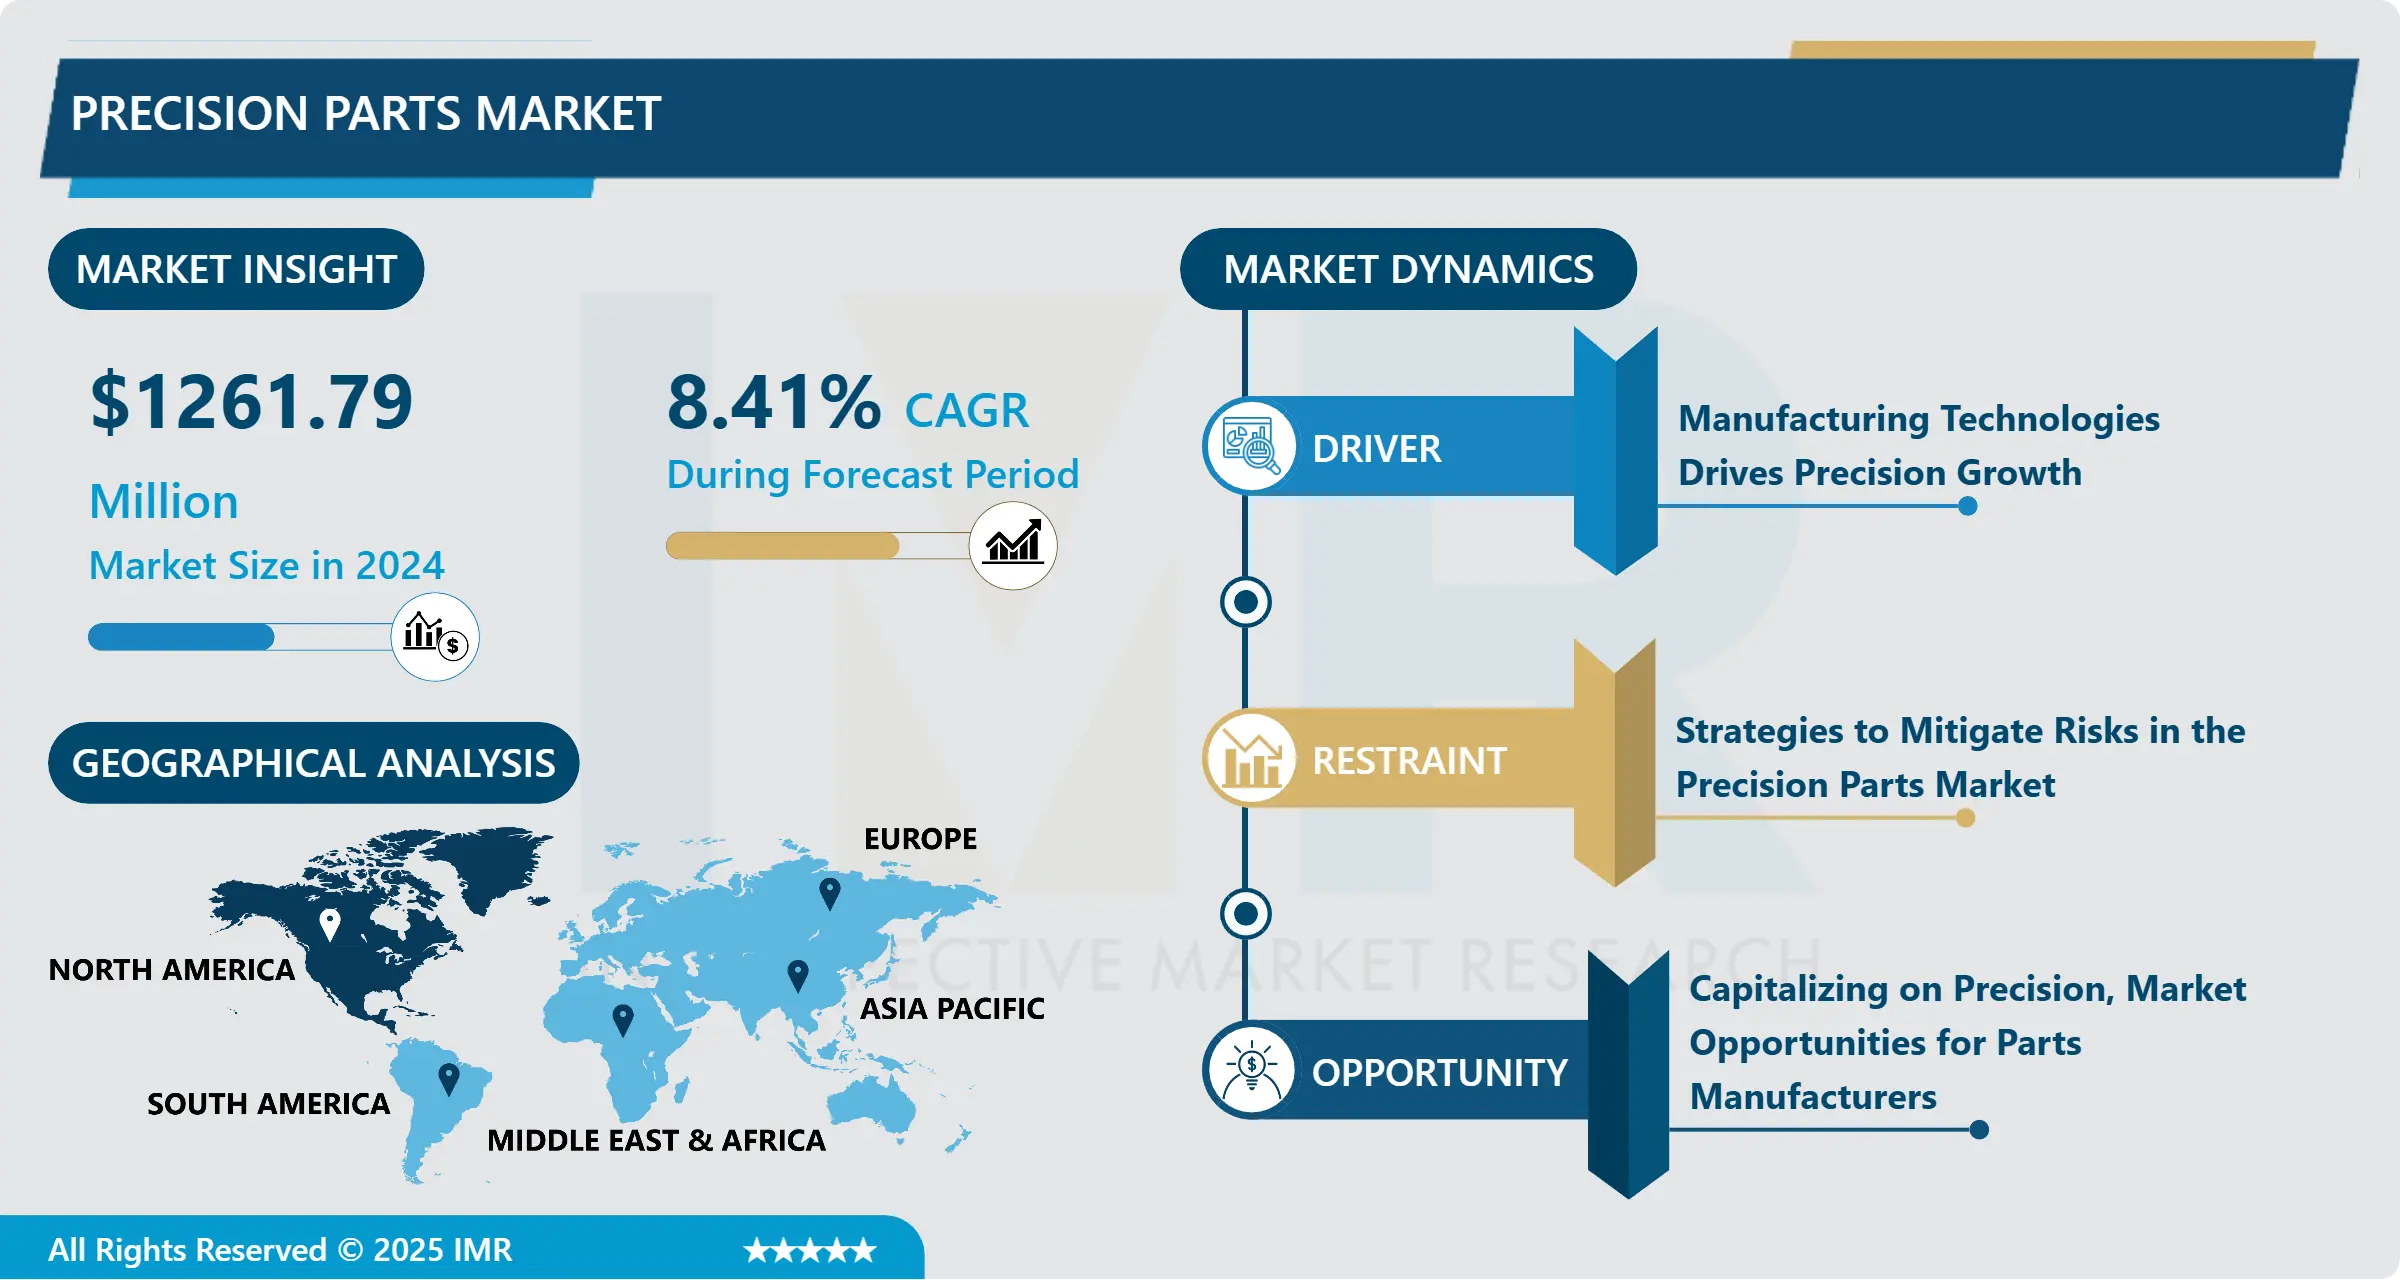
Precision Parts Market Size is Valued at USD 1261.79 Million in 2024, and is Projected to Reach USD 2407.36 Billion by 2032, Growing at a CAGR of 8.41% From 2025-2032.
Mass production implies the use of components that have precise dimensions and usually very accurate functional performance. These parts are mostly applied in the industries where accuracy is highly required thus; in the aerospace; automobiles; electronic and medical devices industries. They are usually produced by using machining processes which are sophisticated and/or are made of high-quality materials in order to conform to the high requirements that are usually associated with this kind of products.Growing market need for high-quality goods: For executing and ensuring the high-quality performance of their products, some industries, such as aerospace, automotive, electronics, and healthcare, require accurate parts.
Technological developments: This is due to advances in other manufacturing technologies such as automation, 3D printing, and CNC machining for producing more complex and precise components.
Growing emphasis on miniaturization: There is an increasing demand for accurate parts owing to the fact that products are now becoming smaller and more compact while still retaining their operation efficiency in confined spaces.
Growing need for customized components: With the increased number of customers who have specific needs the market is growing with exact parts that would be able to fit a specific requirement.
Tight quality criteria: This is the demand for precision parts that have better quality demands of applications within aerospace or medical devices industries.
Growing popularity of electric vehicles: The market continues growing due to the growing necessity for accurate parts for parts like motors, battery systems, and electronic control systems.

Global Precision Parts Market – Trend, Analysis & Forecast.
Industry 4.0: Dynamics Disrupting the Precise Parts Industry.
- Technological Advancements: In particular, the label ‘Industry 4. 0 rises there is a growing demand for high accurate components that complement advanced production technologies that include 3D printing, Robots, and CNC machines. This tendency implies that more intricate and accurate pieces are developed.
- Personalization & Customization: Customers need more and more parts that are customized to meet their demands and specifications. This tendency is forcing producers to invest in qualities that are affordable to produce and that are characterized by production flexibility – a quality that can efficiently manufacture a variety of customer-tailored parts.
- Emphasis on Quality and Reliability: In fields such as aerospace, automotive, and medical devices, among others, the importance and impact of quality and the reliability of accurate parts are increasing. Manufacturers are therefore burning their pockets with purchase of such certifications and quality control measures to meet these strict regulations.
- Supply Chain Optimization: Companies are focusing on streamlining the supply chain as an approach to reduce costs and time required to move materials and products. This trend is driving the adoption of technologies such as digital twin simulations for increased visibility into operations; advanced inventory optimization algorithms; and predictive maintenance.
- Sustainable Practices: What is more important for the market for precision parts is that the manufacturing sector today is paying much more attention to the sustainability issues. Environment-friendly practices like recycling, saving energy, and the use of raw materials that do not harm the environment are some of the changes seen in manufacturers.
- Globalization: The world wide market for the precision parts is increasing because of the fact that the businesses are importing substitutes and component from any part of the world. This is necessitating the demand for proper supply chain management and logistics systems.
- Digitalization: Technological advancements such as big data analytics, artificial intelligence, and the internet of things are transforming the precision components industry. These are technologies that are helping manufacturers enhance productions shift improvement and quality.
Industry 4. 0 in Precision Parts – Reimagining Manufacturing with IIoT and AI.
- Advanced Manufacturing Techniques: accuracy, rapidness, and productivity may be raised, especially if the items produced are of high accuracy, with the help of contemporary manufacturing processes including 3-D printing, computer numerically controlled (CNC) machining, and automating the manufacturing procedure.
- Materials Innovation: The development of new materials with enhanced properties such as strength, stiffness, and resistance to fatigue and corrosion can potentially generate new markets and specific applications for precision components.
- Industry 4. 0 Integration: Industry 4.0 Technology Integration in Precision Parts Organizations technologies including IoT, AI & Data analytics may help improve manufacturing processes, reduce downtime and manage inventory.
- Personalization and Customization: Offering quality parts with additional options for individualization and more specific solutions to fulfill certain client’s requests may become one of the key distinguishing factors and serve as the primary factor of increasing client’s loyalty.
- Extension into Developing Markets: Exploring opportunities in emerging economies in which the demand for Precision parts is increasing due to expansion of the industries such as electronic, Automotive, and Aerospace.
- Collaborations and Partnerships: Strategic management can be achieved by collaborating with other businesses, universities, and information systems vendors to identify new solutions and markets.
- Aftermarket Services: Post-sale services like some accurate part support and repair as well as renovation are exceptional techniques for growing revenue or enhancing client service.
- Emphasis on Sustainability: A competitive advantage and the potential for attracting environmentally conscious customers are possible through the introduction of sustainable manufacturing principles and the use of environmentally friendly raw materials.
Precision Parts Market Segment Analysis: Precision Parts Market Segment Analysis:
Global precision Parts market is Segmented into type of precision parts, and applications.
By Type, the Metal segment will lead the market during the forecast period.
- Based on the materials used, precision parts can be broadly divided into two categories: metal and plastic Consequently, it has been found that the materials that are available include metal and plastic.
- Precision metal parts are identifiable for their sturdiness, high temperatures resistance, and durability. They are often employed in industries requiring high-performance such as manufacturing, automobile and aeronautics. Metals such as titanium, steel, and aluminium are commonly used to create precision parts because of the mechanical properties as well as the ability to withstand extreme conditions.
- While the precise benefits of precision plastic parts include light weight, resistance to corrosion and design freedom. They are often employed in industries which demand for more complex shapes of lighter components such as electronics, consumer products and medical technology industries. Plastics such as nylons, ABS, and polycarbonates are commonly used to manufacture precision parts for their low costs and the relative ease by which plastics can be molded.
- Plastic or metal precision parts are crucial for a lot of industries because they are factors of innovation and technological advancement.
Based on the type of application, the Automotive segment captured the highest market share in 2023
- Many applications such as the electronics, auto and aeronautical industries rely on precision parts.
- This is because the precision parts are very crucial in the aerospace industry because with the help of these parts the aircrafts can perform efficiently and are safe. These parts are used in critical areas such as flight control systems and avionics, landing gear, and engines. High quality control and precision machining are very important when it comes to aerospace applications since high safety and reliability standards are expected.
- Precision parts employed in automotive industry include parts of engines and gear boxes, as well as brake systems and chassis. These components are crucial in preventing the deterioration of the efficacy, functionality, or security of automobiles. Automotive industry requires precise parts that are stronger, lighter in weight, and capable of withstanding challenging conditions in which they operate.
- The electronics industry also used precision parts to produce such gadgets as computers, smart phones, and medical equipment. These components are required to ensure stipulated performance and/or operation of electronic equipment. In the electronics segment, efficient machining and assembly techniques play an important role in ensuring that the technological expectations of today’s electronic products in terms of performance and size reduction are met.
- Taking all of this into consideration, it is easy to note that precision parts are crucial to the field of electronics, automobiles, and aeronautical engineering, as well as to the development of modern technology connected with these industries.
Precision Parts Market Regional Insights: Precision Parts Market Regional Insights:
The Market is Likely to be Led by North America During the Forecast Period.
- Technological Developments: Currently, there has been great development of the manufacturing technologies used in the industry for production of parts with improvement of part production efficiency and precision of used tools which includes the CNC machining, robots, and the additive manufacturing.
- need from End-Use Industries: The main industries where the precision parts are highly demanded include the aerospace, automotive, electronics and the medical fields. This is due to the fact that these industries require components that are of high quality because they are tailored to meet specialized needs.
- Put Quality and Compliance First: Implementation of modern manufacturing techniques and effective quality control strategies is increasingly encouraged by the strict quality requirements and controls as experienced in industries such as medical devices and aerospace.
- Growing Adoption of Automation: This is due to the fact that productivity increases, labour costs are reduced, and especially the quality control of the precision parts production is enhanced due to automation of the processes.
- Change Towards Sustainable methods: There is a lot of development in the sector That is because of the pressure for sustainable manufacturing, for example use of renewable materials and energy efficient procedures.
- Market Consolidation and M&A Activity: Drives like this one where companies seek to expand their products and markets lead to the market concentration through the mergers and acquisition.
- Supply Chain Disruptions and Resilience: Because the industry has continued to face challenges in the supply chains, there is increased focus on developing the supply chains in ways that make them more responsive and agile.
Active Key Players in the Precision Parts Market
- Bosch (Germany)
- Denso Corporation (Japan)
- Magna International Inc. (Canada)
- Martinrea International Inc. (Canada)
- Valeo (France)
- Continental AG (Germany)
- NTN Corporation (Japan)
- Honeywell International Inc. (USA)
- ZF Friedrichshafen AG (Germany)
- Aisin Corporation (Japan)
- Barnes Group (USA)
- NN Inc. (USA)
- Linamar International (Canada)
- WM Berg (USA)
- Renishaw Group (UK)
- ARC Group Worldwide (USA)
- Beyonics (Singapore), and Other Active Players.
Key Industry Developments in the Precision Parts Market:
- In February 2023, Martinrea International Inc., a global automotive components supplier specializing in propulsion systems and precision-engineered parts, acquired Montreal-based Effenco Development Inc. Through this acquisition, Martinrea sought to diversify its business by expanding into hybrid and electric solutions.
|
Global Precision Parts Market |
|||
|
Base Year: |
2024 |
Forecast Period: |
2025-2032 |
|
Historical Data: |
2018 to 2023 |
Market Size in 2024: |
USD 1261.79 Mn. |
|
Forecast Period 2023-32 CAGR: |
8.41 % |
Market Size in 2032: |
USD 2407.36 Mn. |
|
Segments Covered: |
By Type of Material: |
|
|
|
By Manufacturing Process: |
|
||
|
By End-Use Industry: |
|
||
|
By Region |
|
||
|
Key Market Drivers: |
|
||
|
Key Market Restraints: |
|
||
|
Key Opportunities: |
|
||
|
Companies Covered in the report: |
|
||
Chapter 1: Introduction
1.1 Scope and Coverage
Chapter 2:Executive Summary
Chapter 3: Market Landscape
3.1 Market Dynamics
3.1.1 Drivers
3.1.2 Restraints
3.1.3 Opportunities
3.1.4 Challenges
3.2 Market Trend Analysis
3.3 PESTLE Analysis
3.4 Porter's Five Forces Analysis
3.5 Industry Value Chain Analysis
3.6 Ecosystem
3.7 Regulatory Landscape
3.8 Price Trend Analysis
3.9 Patent Analysis
3.10 Technology Evolution
3.11 Investment Pockets
3.12 Import-Export Analysis
Chapter 4: Precision Parts Market by Type of Material (2018-2032)
4.1 Precision Parts Market Snapshot and Growth Engine
4.2 Market Overview
4.3 : Metal Precision Parts
4.3.1 Introduction and Market Overview
4.3.2 Historic and Forecasted Market Size in Value USD and Volume Units
4.3.3 Key Market Trends, Growth Factors, and Opportunities
4.3.4 Geographic Segmentation Analysis
4.4 Plastic Precision Parts
4.5 Ceramic Precision Parts
4.6 Composite Precision Parts
Chapter 5: Precision Parts Market by Manufacturing Process (2018-2032)
5.1 Precision Parts Market Snapshot and Growth Engine
5.2 Market Overview
5.3 : CNC Machining
5.3.1 Introduction and Market Overview
5.3.2 Historic and Forecasted Market Size in Value USD and Volume Units
5.3.3 Key Market Trends, Growth Factors, and Opportunities
5.3.4 Geographic Segmentation Analysis
5.4 Injection Molding
5.5 Stamping
5.6 Casting and Forging
5.7 Additive Manufacturing (3D Printing)
5.8 Electrochemical Machining (ECM)
Chapter 6: Precision Parts Market by End-Use Industry (2018-2032)
6.1 Precision Parts Market Snapshot and Growth Engine
6.2 Market Overview
6.3 : Automotive
6.3.1 Introduction and Market Overview
6.3.2 Historic and Forecasted Market Size in Value USD and Volume Units
6.3.3 Key Market Trends, Growth Factors, and Opportunities
6.3.4 Geographic Segmentation Analysis
6.4 Aerospace & Defense
6.5 Electronics & Telecommunications
6.6 Medical Devices
6.7 Energy & Power
6.8 Industrial & Manufacturing
6.9 Others (Marine
6.10 Consumer Goods)
Chapter 7: Company Profiles and Competitive Analysis
7.1 Competitive Landscape
7.1.1 Competitive Benchmarking
7.1.2 Precision Parts Market Share by Manufacturer (2024)
7.1.3 Industry BCG Matrix
7.1.4 Heat Map Analysis
7.1.5 Mergers and Acquisitions
7.2 ZF (GERMANY)
7.2.1 Company Overview
7.2.2 Key Executives
7.2.3 Company Snapshot
7.2.4 Role of the Company in the Market
7.2.5 Sustainability and Social Responsibility
7.2.6 Operating Business Segments
7.2.7 Product Portfolio
7.2.8 Business Performance
7.2.9 Key Strategic Moves and Recent Developments
7.2.10 SWOT Analysis
7.3 CONTINENTAL (GERMANY)
7.4 CHASSIS BRAKES INTERNATIONAL (BELGIUM)
7.5 KÜSTER (GERMANY)
7.6 AISIN (JAPAN)
7.7 MANDO (SOUTH KOREA)
7.8 HYUNDAI MOBIS (SOUTH KOREA)
7.9 ZHEJIANG LIBANG HEXIN (CHINA)
7.10 WUHU BETHEL AUTOMOTIVE (CHINA)
7.11 OTHERS
7.12
Chapter 8: Global Precision Parts Market By Region
8.1 Overview
8.2. North America Precision Parts Market
8.2.1 Key Market Trends, Growth Factors and Opportunities
8.2.2 Top Key Companies
8.2.3 Historic and Forecasted Market Size by Segments
8.2.4 Historic and Forecasted Market Size by Type of Material
8.2.4.1 : Metal Precision Parts
8.2.4.2 Plastic Precision Parts
8.2.4.3 Ceramic Precision Parts
8.2.4.4 Composite Precision Parts
8.2.5 Historic and Forecasted Market Size by Manufacturing Process
8.2.5.1 : CNC Machining
8.2.5.2 Injection Molding
8.2.5.3 Stamping
8.2.5.4 Casting and Forging
8.2.5.5 Additive Manufacturing (3D Printing)
8.2.5.6 Electrochemical Machining (ECM)
8.2.6 Historic and Forecasted Market Size by End-Use Industry
8.2.6.1 : Automotive
8.2.6.2 Aerospace & Defense
8.2.6.3 Electronics & Telecommunications
8.2.6.4 Medical Devices
8.2.6.5 Energy & Power
8.2.6.6 Industrial & Manufacturing
8.2.6.7 Others (Marine
8.2.6.8 Consumer Goods)
8.2.7 Historic and Forecast Market Size by Country
8.2.7.1 US
8.2.7.2 Canada
8.2.7.3 Mexico
8.3. Eastern Europe Precision Parts Market
8.3.1 Key Market Trends, Growth Factors and Opportunities
8.3.2 Top Key Companies
8.3.3 Historic and Forecasted Market Size by Segments
8.3.4 Historic and Forecasted Market Size by Type of Material
8.3.4.1 : Metal Precision Parts
8.3.4.2 Plastic Precision Parts
8.3.4.3 Ceramic Precision Parts
8.3.4.4 Composite Precision Parts
8.3.5 Historic and Forecasted Market Size by Manufacturing Process
8.3.5.1 : CNC Machining
8.3.5.2 Injection Molding
8.3.5.3 Stamping
8.3.5.4 Casting and Forging
8.3.5.5 Additive Manufacturing (3D Printing)
8.3.5.6 Electrochemical Machining (ECM)
8.3.6 Historic and Forecasted Market Size by End-Use Industry
8.3.6.1 : Automotive
8.3.6.2 Aerospace & Defense
8.3.6.3 Electronics & Telecommunications
8.3.6.4 Medical Devices
8.3.6.5 Energy & Power
8.3.6.6 Industrial & Manufacturing
8.3.6.7 Others (Marine
8.3.6.8 Consumer Goods)
8.3.7 Historic and Forecast Market Size by Country
8.3.7.1 Russia
8.3.7.2 Bulgaria
8.3.7.3 The Czech Republic
8.3.7.4 Hungary
8.3.7.5 Poland
8.3.7.6 Romania
8.3.7.7 Rest of Eastern Europe
8.4. Western Europe Precision Parts Market
8.4.1 Key Market Trends, Growth Factors and Opportunities
8.4.2 Top Key Companies
8.4.3 Historic and Forecasted Market Size by Segments
8.4.4 Historic and Forecasted Market Size by Type of Material
8.4.4.1 : Metal Precision Parts
8.4.4.2 Plastic Precision Parts
8.4.4.3 Ceramic Precision Parts
8.4.4.4 Composite Precision Parts
8.4.5 Historic and Forecasted Market Size by Manufacturing Process
8.4.5.1 : CNC Machining
8.4.5.2 Injection Molding
8.4.5.3 Stamping
8.4.5.4 Casting and Forging
8.4.5.5 Additive Manufacturing (3D Printing)
8.4.5.6 Electrochemical Machining (ECM)
8.4.6 Historic and Forecasted Market Size by End-Use Industry
8.4.6.1 : Automotive
8.4.6.2 Aerospace & Defense
8.4.6.3 Electronics & Telecommunications
8.4.6.4 Medical Devices
8.4.6.5 Energy & Power
8.4.6.6 Industrial & Manufacturing
8.4.6.7 Others (Marine
8.4.6.8 Consumer Goods)
8.4.7 Historic and Forecast Market Size by Country
8.4.7.1 Germany
8.4.7.2 UK
8.4.7.3 France
8.4.7.4 The Netherlands
8.4.7.5 Italy
8.4.7.6 Spain
8.4.7.7 Rest of Western Europe
8.5. Asia Pacific Precision Parts Market
8.5.1 Key Market Trends, Growth Factors and Opportunities
8.5.2 Top Key Companies
8.5.3 Historic and Forecasted Market Size by Segments
8.5.4 Historic and Forecasted Market Size by Type of Material
8.5.4.1 : Metal Precision Parts
8.5.4.2 Plastic Precision Parts
8.5.4.3 Ceramic Precision Parts
8.5.4.4 Composite Precision Parts
8.5.5 Historic and Forecasted Market Size by Manufacturing Process
8.5.5.1 : CNC Machining
8.5.5.2 Injection Molding
8.5.5.3 Stamping
8.5.5.4 Casting and Forging
8.5.5.5 Additive Manufacturing (3D Printing)
8.5.5.6 Electrochemical Machining (ECM)
8.5.6 Historic and Forecasted Market Size by End-Use Industry
8.5.6.1 : Automotive
8.5.6.2 Aerospace & Defense
8.5.6.3 Electronics & Telecommunications
8.5.6.4 Medical Devices
8.5.6.5 Energy & Power
8.5.6.6 Industrial & Manufacturing
8.5.6.7 Others (Marine
8.5.6.8 Consumer Goods)
8.5.7 Historic and Forecast Market Size by Country
8.5.7.1 China
8.5.7.2 India
8.5.7.3 Japan
8.5.7.4 South Korea
8.5.7.5 Malaysia
8.5.7.6 Thailand
8.5.7.7 Vietnam
8.5.7.8 The Philippines
8.5.7.9 Australia
8.5.7.10 New Zealand
8.5.7.11 Rest of APAC
8.6. Middle East & Africa Precision Parts Market
8.6.1 Key Market Trends, Growth Factors and Opportunities
8.6.2 Top Key Companies
8.6.3 Historic and Forecasted Market Size by Segments
8.6.4 Historic and Forecasted Market Size by Type of Material
8.6.4.1 : Metal Precision Parts
8.6.4.2 Plastic Precision Parts
8.6.4.3 Ceramic Precision Parts
8.6.4.4 Composite Precision Parts
8.6.5 Historic and Forecasted Market Size by Manufacturing Process
8.6.5.1 : CNC Machining
8.6.5.2 Injection Molding
8.6.5.3 Stamping
8.6.5.4 Casting and Forging
8.6.5.5 Additive Manufacturing (3D Printing)
8.6.5.6 Electrochemical Machining (ECM)
8.6.6 Historic and Forecasted Market Size by End-Use Industry
8.6.6.1 : Automotive
8.6.6.2 Aerospace & Defense
8.6.6.3 Electronics & Telecommunications
8.6.6.4 Medical Devices
8.6.6.5 Energy & Power
8.6.6.6 Industrial & Manufacturing
8.6.6.7 Others (Marine
8.6.6.8 Consumer Goods)
8.6.7 Historic and Forecast Market Size by Country
8.6.7.1 Turkiye
8.6.7.2 Bahrain
8.6.7.3 Kuwait
8.6.7.4 Saudi Arabia
8.6.7.5 Qatar
8.6.7.6 UAE
8.6.7.7 Israel
8.6.7.8 South Africa
8.7. South America Precision Parts Market
8.7.1 Key Market Trends, Growth Factors and Opportunities
8.7.2 Top Key Companies
8.7.3 Historic and Forecasted Market Size by Segments
8.7.4 Historic and Forecasted Market Size by Type of Material
8.7.4.1 : Metal Precision Parts
8.7.4.2 Plastic Precision Parts
8.7.4.3 Ceramic Precision Parts
8.7.4.4 Composite Precision Parts
8.7.5 Historic and Forecasted Market Size by Manufacturing Process
8.7.5.1 : CNC Machining
8.7.5.2 Injection Molding
8.7.5.3 Stamping
8.7.5.4 Casting and Forging
8.7.5.5 Additive Manufacturing (3D Printing)
8.7.5.6 Electrochemical Machining (ECM)
8.7.6 Historic and Forecasted Market Size by End-Use Industry
8.7.6.1 : Automotive
8.7.6.2 Aerospace & Defense
8.7.6.3 Electronics & Telecommunications
8.7.6.4 Medical Devices
8.7.6.5 Energy & Power
8.7.6.6 Industrial & Manufacturing
8.7.6.7 Others (Marine
8.7.6.8 Consumer Goods)
8.7.7 Historic and Forecast Market Size by Country
8.7.7.1 Brazil
8.7.7.2 Argentina
8.7.7.3 Rest of SA
Chapter 9 Analyst Viewpoint and Conclusion
9.1 Recommendations and Concluding Analysis
9.2 Potential Market Strategies
Chapter 10 Research Methodology
10.1 Research Process
10.2 Primary Research
10.3 Secondary Research
|
Global Precision Parts Market |
|||
|
Base Year: |
2024 |
Forecast Period: |
2025-2032 |
|
Historical Data: |
2018 to 2023 |
Market Size in 2024: |
USD 1261.79 Mn. |
|
Forecast Period 2023-32 CAGR: |
8.41 % |
Market Size in 2032: |
USD 2407.36 Mn. |
|
Segments Covered: |
By Type of Material: |
|
|
|
By Manufacturing Process: |
|
||
|
By End-Use Industry: |
|
||
|
By Region |
|
||
|
Key Market Drivers: |
|
||
|
Key Market Restraints: |
|
||
|
Key Opportunities: |
|
||
|
Companies Covered in the report: |
|
||


