


Global Pea Starch Market Overview
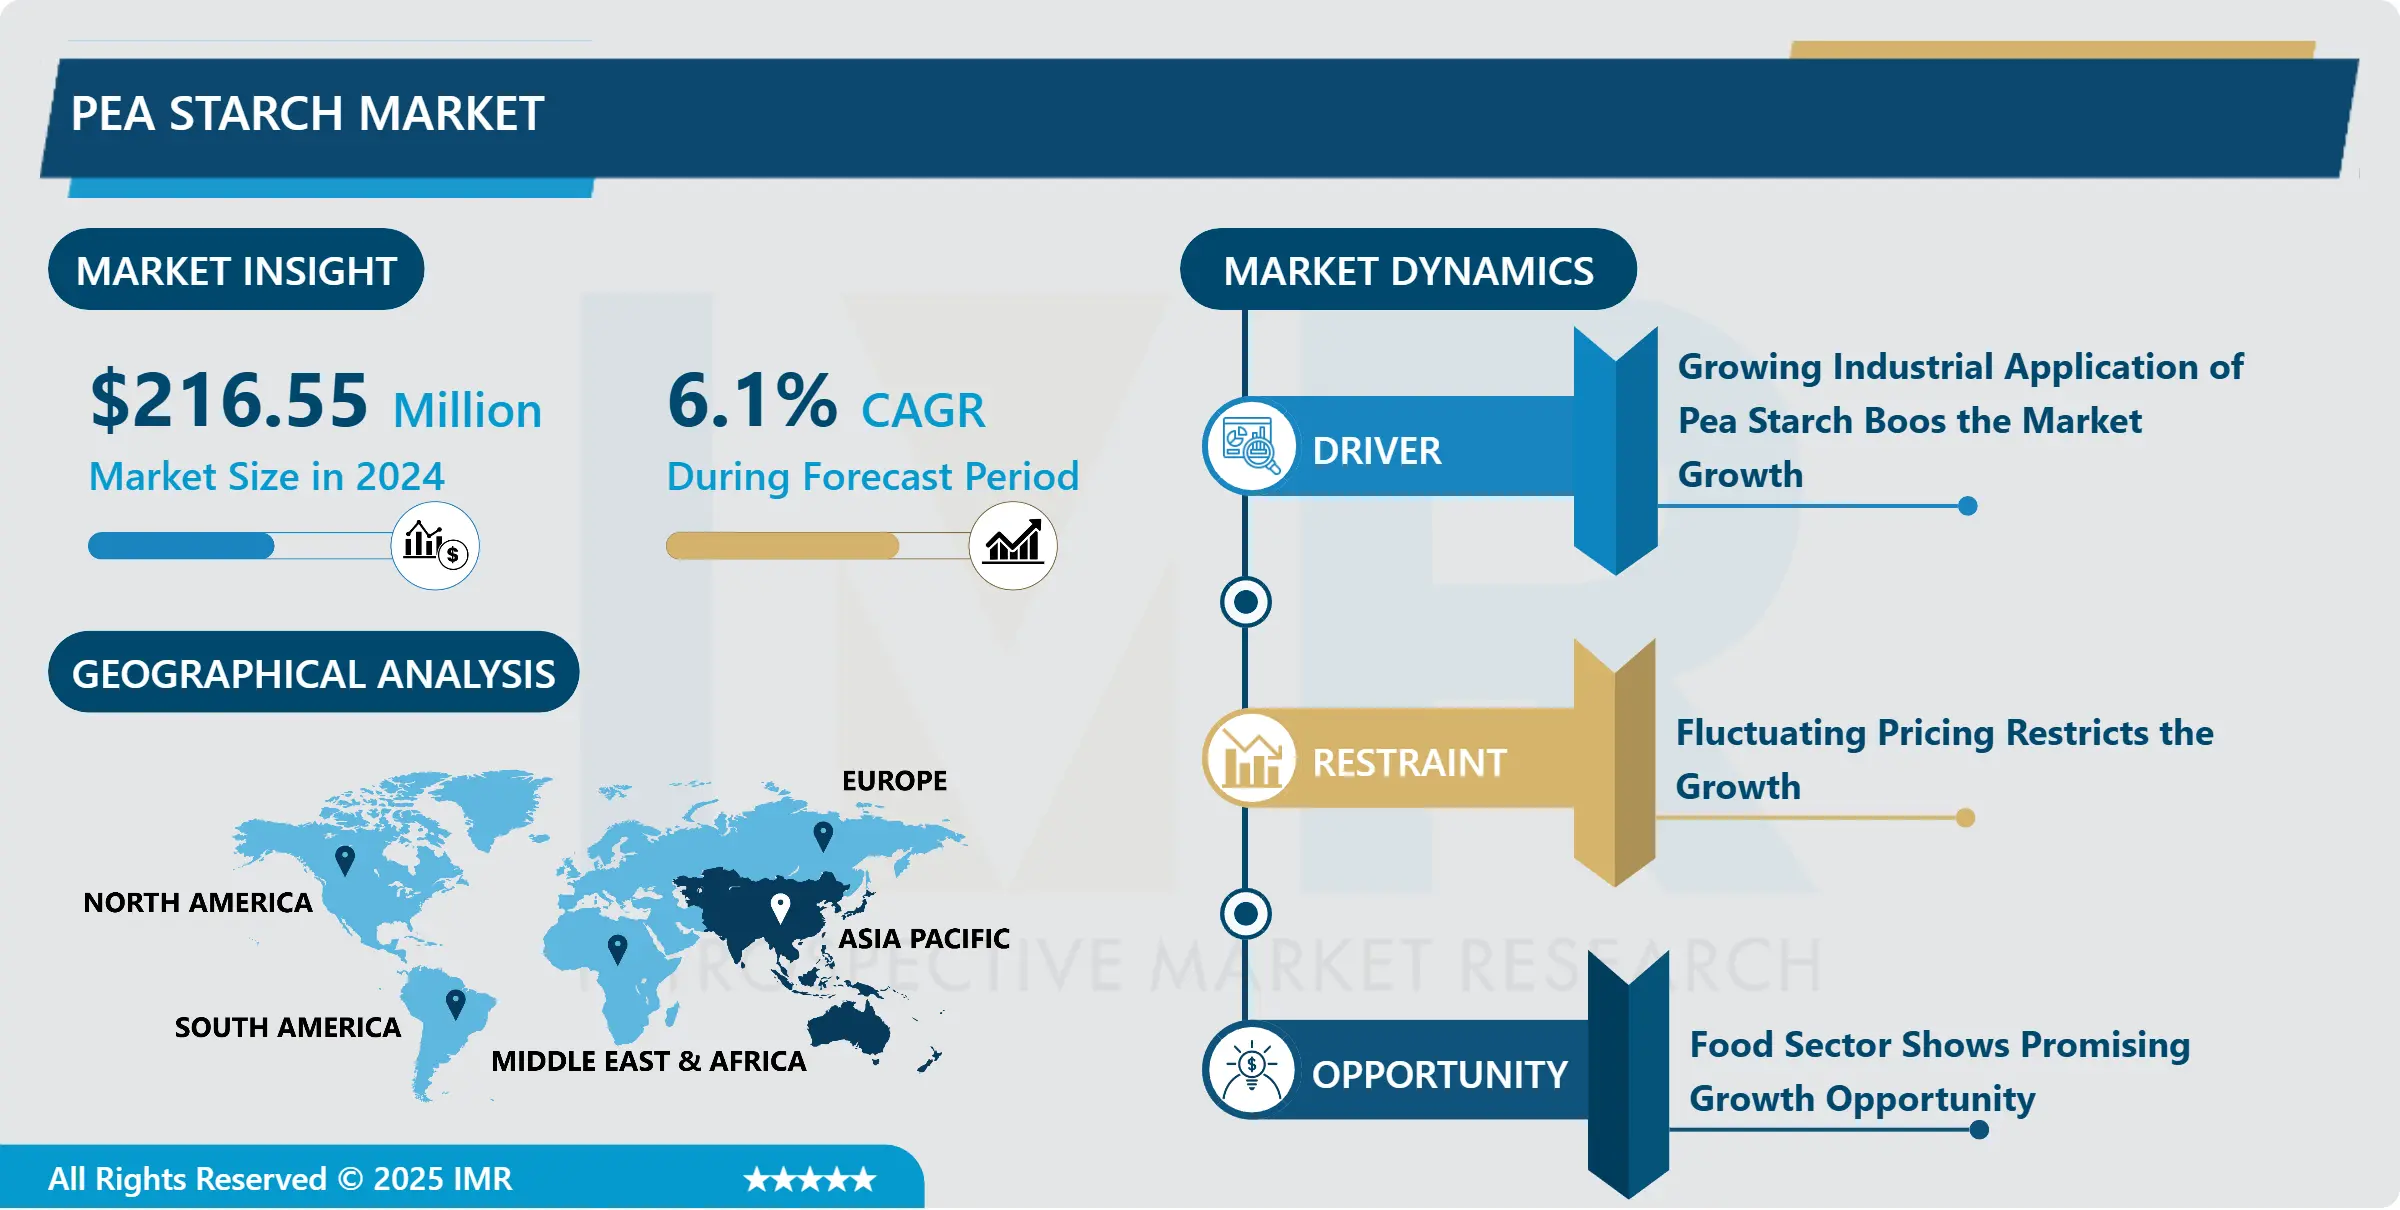
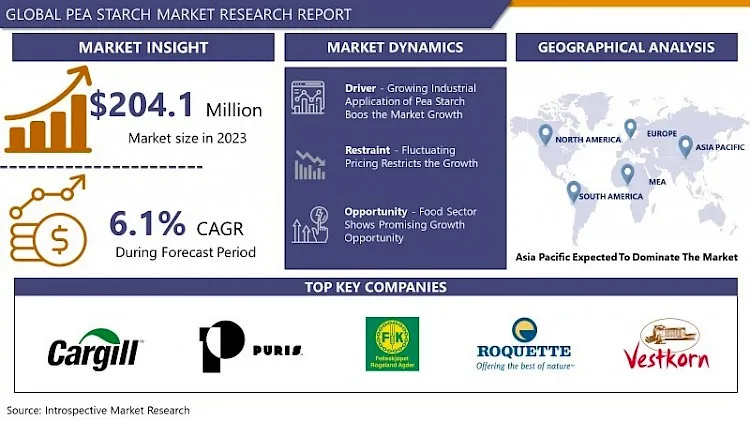
Pea Starch Market was valued at USD 216.55 million in 2024 and is expected to reach USD 347.76 million by the year 2032, at a CAGR of 6.1%.
The pea starch market is experiencing significant growth, driven by increasing consumer demand for plant-based and gluten-free food products. Derived from yellow peas, pea starch is valued for its high amylose content, excellent gelling, and thickening properties, making it a preferred ingredient in various food applications, including soups, sauces, noodles, and confectionery. Its versatility extends beyond food, finding uses in pharmaceuticals, cosmetics, and industrial applications, such as biodegradable plastics and adhesives.
North America and Europe are the dominant regions in the pea starch market, propelled by rising health consciousness and a shift towards sustainable and plant-based diets. Asia-Pacific is emerging as a rapidly growing market due to the expanding food processing industry and increasing awareness about the health benefits of pea-based ingredients.
Key players in the market include Roquette Frères, Cosucra Groupe Warcoing SA, and Emsland Group, who are focusing on expanding their production capacities and investing in R&D to develop innovative products. The market is also witnessing strategic collaborations and partnerships to enhance distribution networks and product portfolios.
Challenges such as fluctuating raw material prices and competition from other starch sources like corn and potato may hinder market growth. However, the rising trend of clean-label products and the growing popularity of gluten-free diets are expected to provide lucrative opportunities for market expansion.
Market Dynamics and factors of Pea Starch Market:
Drivers
Consumers who are allergic to lactose prefer products that have pea starch as their key ingredient, as it is easy to digest as compared to the products that have lactose. Thus, growth has been witnessed in the demand for pea starch products in the population suffering from lactose intolerance. Additionally, switching in consumption pattern among consumers contribute toward the growth of the market. For instance, utilization of pea starch is anticipated to grow significantly in health-conscious consumers, as it possesses anti-allergic properties and is low in calories. This factor significantly aids the growth of the global market. Furthermore, the development of new products with improved taste and benefits, along with high marketing support, enhances the global market growth.
Rapid urging for pea starch in industrial applications is anticipated to turn to the growth of the market over the projected period. This is attributed to the fact that it is gelling, thickening, and texturizing properties make it ideal for usage in pharmaceutical and/or nutraceuticals for film-forming and coating tablets and capsules. Moreover, it is primarily used to produce gelatin-free capsules. In addition, the extracts acquired from pea are used as an ingredient in personal care and cosmetic products. This is assigned to the fact that the skin lightening, skin smoothing, and anti-aging properties obtained from pea starch make it an ideal component for products such as creams & lotions, and serums. Additionally, a spout in demand from customers for organic and natural skincare and hair care products makes it imperative for manufacturers to incorporate ingredients derived from natural sources. This trend turns the demand for pea starch, thereby accelerating the growth of the global market.
Native starch portrays promising prospects related to industrial applications, due to its biocompatible and environmentally friendly nature as compared to synthetic polymers. Various industries, such as food, textile, paper, and petroleum are progressively consuming modified starch. Additionally, emerging economies such as China and India are utilizing native starches owing to rapid industrial growth in these countries. Moreover, switching in consumer appetite due to growth in health, nutritional, and functional needs is expected to rise native starch production and consumption. Therefore, in the upcoming years, an increase in demand for starch from untapped areas of industrial applications is anticipated to significantly boost the global pea starch market growth.
Restraints:
Differing prices of raw materials, presence of allergens in pea, adverse climatic conditions for the cultivation of pea plants, accessibility of alternate products, poor awareness about nutritional benefits of pea starch, and high production cost hamper and challenge the growth of the pea starch market. Additionally, the decline in the production of pea starch is another restraint factor for the pea starch market.
Opportunities:
The increasing demand for pea starch in the pet food industry is expected to generate untapped opportunities for market participants. The pet food market is turned by two primary trends globally. These trends are premiumization and humanization. There is a rising trend of pet humanization as a family person among owners. Owing to this, there is a growth in demand for premium pet food with nutritional benefits, better digestibility, and enhanced ingredient quality for pets.
Market Segmentation
Segmentation for Pea Starch Market:
Based on the Grade, the food-grade segment dominates the market over the forecast period. Pea starch is highly utilized for food applications, including confectionery, sauces, noodles, soups, pasta, bakery, and meat products. Among these, noodles, pasta, vermicelli are the most famous applications of pea starch in the food sector. Pea starch is mainly used for its binding and thickening properties for the manufacturing of different food products. Pea starch in the feed industry is used in pet food products as a source of carbohydrates for improving the texture and quality of the pellets. Moreover, it is used in the pharmaceutical and cosmetic industries to cater stability, mechanical strength, and tablet disintegration into products.
Based on the Application, food and beverage are accounted for the significant and maximum share in the market in the projected period. Pea starch contains a high amount of amylose, owing to which pea starch in its native form plays like the best clean label alternative for modified starches obtained from other sources, such as corn and wheat. It has various applications in different sectors, such as food & beverage, pet food, feed, and other industries, including pharmaceutical, cosmetic, textile, and paper. Pea starch supplies gluten-free, lactose-free, allergen-free, low-calorie, and low-fat solutions in the food industry.
Based on the Source, the organic pea starch segment dominates the market during the forecast period. The demand for organic pea starch is growing owing to the rising health awareness among consumers. Moreover, the rise in the willingness of consumers to pay higher prices for organic food products, as they are related to healthy and nutritious aspects, is anticipated to drive the demand for organic pea starch. Additionally, the switching consumer perception toward healthy eating, growing in health consciousness among consumers, and raising awareness about the nutritional benefits of organic food products have help to the growth of the organic pea starch market.
Based on the Function Type, a gelling segment is expected to dominate the market due to the wide application of the product in various food products as well as animal feed, due to the high availability of amylose. Pea starch as a gelling agent escalates the viscosity of a liquid without rapidly changing its other properties. It is highly consumed in the food and beverage industry, primarily in sauces, puddings, gravies, and soups without changing the taste on account of its comprising fibrous content and gluten-free properties.
Players Covered in Pea Starch market are :
- Cargill Inc. (US)
- Coscura Groupe Warcoing SA (Belgium)
- Parheim Foods (Canada)
- Puris Foods (United States)
- Felleskjopet Rogaland Agder (United States)
- Roquette Freres (France)
- Vestkorn Milling AS (Norway)
- Shandong Jianyuan Group (China)
- Emsland Group (Germany)
- Ingredion Incorporated (United States)
- Axiom Foods Inc. (United States)
- AGT Food and Ingredients (Canada)
- Ingredion (US) and others active Players.
Regional Analysis of Pea Starch Market:
Asia Pacific region held a significant market share during the forecast period and is projected to expand at the fastest CAGR over the upcoming years. The region has contributed remarkably to the increasing demand for convenience foods, such as confectionery, sauces, and soups. Factors such as rising applications of pea starches in processed food preparation, extensive consumer base, and increasing demand for native starches, are anticipated to be the major contributors to the regional market growth.
COVID-19 Impact on Pea Starch Market:
COVID-19 pandemic had adversely affected the food supply chain in all regions such as North America, Europe, Asia-Pacific, South America, and the rest of the world. Owing to the widespread of COVID-19, there has been a rising number of death cases and long-term health impacts. This has resulted in the government's spectacular extreme lockdown regulations, impacting all aspects of the economy. Governments around the globe have emerged policies for responding to the various impacts caused by COVID-19 for avoiding supply chain disruptions, higher raw material costing, and severe economic fallout for employees. Europe and the Asia Pacific are some of the key regions that are remarkably influenced by the COVID-19 outbreak. Due to the extensive number of cases recorded in the regions, primarily in the economies such as Spain, Italy, France, Germany in Europe and Japan, China, and South Korea in the Asia Pacific. Companies in various countries are coming up with innovative technologies that are friendly to the environment and protect the pea starch end-user products from any kind of pollutant with germs.
Key Industry Development of Pea Starch Market:
- In April 2024, Roquette, a global leader in plant-based ingredients and a leading provider of nutraceutical and pharmaceutical excipients, is set to showcase a new flexible addition to its LYCAGEL® hydroxypropyl pea starch excipient range at Vitafoods Europe 2024, along with a fresh vision for developing vegetarian and vegan dietary supplements in softgels.
|
Global Pea Starch Market |
|||
|
Base Year: |
2024 |
Forecast Period: |
2025-2032 |
|
Historical Data: |
2018to 2023 |
Market Size in 2024: |
USD 216.55 Mn. |
|
Forecast Period 2022-28 CAGR: |
6.1% |
Market Size in 2032: |
USD 347.76 Mn. |
|
Segments Covered: |
By Type |
|
|
|
By Source |
|
||
|
By Application |
|
||
|
By Region |
|
||
|
Key Market Drivers: |
|
||
|
Key Market Restraints: |
|
||
|
Key Opportunities: |
|
||
|
Companies Covered in the report: |
|
||
Chapter 1: Introduction
1.1 Scope and Coverage
Chapter 2:Executive Summary
Chapter 3: Market Landscape
3.1 Market Dynamics
3.1.1 Drivers
3.1.2 Restraints
3.1.3 Opportunities
3.1.4 Challenges
3.2 Market Trend Analysis
3.3 PESTLE Analysis
3.4 Porter's Five Forces Analysis
3.5 Industry Value Chain Analysis
3.6 Ecosystem
3.7 Regulatory Landscape
3.8 Price Trend Analysis
3.9 Patent Analysis
3.10 Technology Evolution
3.11 Investment Pockets
3.12 Import-Export Analysis
Chapter 4: Pea Starch Market by Type (2018-2032)
4.1 Pea Starch Market Snapshot and Growth Engine
4.2 Market Overview
4.3 Native Pea Starch
4.3.1 Introduction and Market Overview
4.3.2 Historic and Forecasted Market Size in Value USD and Volume Units
4.3.3 Key Market Trends, Growth Factors, and Opportunities
4.3.4 Geographic Segmentation Analysis
4.4 Modified Pea Starch
Chapter 5: Pea Starch Market by Source (2018-2032)
5.1 Pea Starch Market Snapshot and Growth Engine
5.2 Market Overview
5.3 Organic
5.3.1 Introduction and Market Overview
5.3.2 Historic and Forecasted Market Size in Value USD and Volume Units
5.3.3 Key Market Trends, Growth Factors, and Opportunities
5.3.4 Geographic Segmentation Analysis
5.4 Inorganic
Chapter 6: Pea Starch Market by Application (2018-2032)
6.1 Pea Starch Market Snapshot and Growth Engine
6.2 Market Overview
6.3 Food and Beverages
6.3.1 Introduction and Market Overview
6.3.2 Historic and Forecasted Market Size in Value USD and Volume Units
6.3.3 Key Market Trends, Growth Factors, and Opportunities
6.3.4 Geographic Segmentation Analysis
6.4 Pharmaceuticals & Nutraceuticals
6.5 Industrial
6.6 Feed
6.7 Other
Chapter 7: Company Profiles and Competitive Analysis
7.1 Competitive Landscape
7.1.1 Competitive Benchmarking
7.1.2 Pea Starch Market Share by Manufacturer (2024)
7.1.3 Industry BCG Matrix
7.1.4 Heat Map Analysis
7.1.5 Mergers and Acquisitions
7.2 DANONE NORTH AMERICA PUBLIC BENEFIT CORPORATION (US)
7.2.1 Company Overview
7.2.2 Key Executives
7.2.3 Company Snapshot
7.2.4 Role of the Company in the Market
7.2.5 Sustainability and Social Responsibility
7.2.6 Operating Business Segments
7.2.7 Product Portfolio
7.2.8 Business Performance
7.2.9 Key Strategic Moves and Recent Developments
7.2.10 SWOT Analysis
7.3 THE HAIN CELESTIAL GROUP INC. (US)
7.4 BLUE DIAMOND GROWERS (US)
7.5 EDEN FOODS INC. (US)
7.6 HILAND DAIRY (US)
7.7 RIPPLE FOODS (US)
7.8 KITE HILL (US)
7.9 CALIFIA FARMS
7.10 LLC (US)
7.11 RUDE HEALTH (US)
7.12 MIYOKO’S CREAMERY (US)
7.13 PANOS BRAND (US)
7.14 EARTH’S OWN FOOD COMPANY INC. (CANADA)
7.15 DAIYA FOODS INC. (CANADA)
7.16 SUNOPTA (CANADA)
7.17 ELMHURST MILKED DIRECT LLC (NEW YORK)
7.18 VALSOIA S.P.A (ITALY)
7.19 NUTRIOPS
7.20 S.L. (SPAIN)
7.21 QATLY GROUP AB (SWEDEN)
7.22 TRIBALLAT NOYAL (FRANCE)
7.23 ONE GOOD (INDIA)
7.24 FREEDOM FOODS GROUP LIMITED (AUSTRALIA)
7.25 PUREHARVEST (AUSTRALIA)
7.26 SANITARIUM (NEW ZEALAND)
7.27 GREEN SPOT CO. LTD. (THAILAND)
7.28 AND OTHER MAJOR PLAYERS.
Chapter 8: Global Pea Starch Market By Region
8.1 Overview
8.2. North America Pea Starch Market
8.2.1 Key Market Trends, Growth Factors and Opportunities
8.2.2 Top Key Companies
8.2.3 Historic and Forecasted Market Size by Segments
8.2.4 Historic and Forecasted Market Size by Type
8.2.4.1 Native Pea Starch
8.2.4.2 Modified Pea Starch
8.2.5 Historic and Forecasted Market Size by Source
8.2.5.1 Organic
8.2.5.2 Inorganic
8.2.6 Historic and Forecasted Market Size by Application
8.2.6.1 Food and Beverages
8.2.6.2 Pharmaceuticals & Nutraceuticals
8.2.6.3 Industrial
8.2.6.4 Feed
8.2.6.5 Other
8.2.7 Historic and Forecast Market Size by Country
8.2.7.1 US
8.2.7.2 Canada
8.2.7.3 Mexico
8.3. Eastern Europe Pea Starch Market
8.3.1 Key Market Trends, Growth Factors and Opportunities
8.3.2 Top Key Companies
8.3.3 Historic and Forecasted Market Size by Segments
8.3.4 Historic and Forecasted Market Size by Type
8.3.4.1 Native Pea Starch
8.3.4.2 Modified Pea Starch
8.3.5 Historic and Forecasted Market Size by Source
8.3.5.1 Organic
8.3.5.2 Inorganic
8.3.6 Historic and Forecasted Market Size by Application
8.3.6.1 Food and Beverages
8.3.6.2 Pharmaceuticals & Nutraceuticals
8.3.6.3 Industrial
8.3.6.4 Feed
8.3.6.5 Other
8.3.7 Historic and Forecast Market Size by Country
8.3.7.1 Russia
8.3.7.2 Bulgaria
8.3.7.3 The Czech Republic
8.3.7.4 Hungary
8.3.7.5 Poland
8.3.7.6 Romania
8.3.7.7 Rest of Eastern Europe
8.4. Western Europe Pea Starch Market
8.4.1 Key Market Trends, Growth Factors and Opportunities
8.4.2 Top Key Companies
8.4.3 Historic and Forecasted Market Size by Segments
8.4.4 Historic and Forecasted Market Size by Type
8.4.4.1 Native Pea Starch
8.4.4.2 Modified Pea Starch
8.4.5 Historic and Forecasted Market Size by Source
8.4.5.1 Organic
8.4.5.2 Inorganic
8.4.6 Historic and Forecasted Market Size by Application
8.4.6.1 Food and Beverages
8.4.6.2 Pharmaceuticals & Nutraceuticals
8.4.6.3 Industrial
8.4.6.4 Feed
8.4.6.5 Other
8.4.7 Historic and Forecast Market Size by Country
8.4.7.1 Germany
8.4.7.2 UK
8.4.7.3 France
8.4.7.4 The Netherlands
8.4.7.5 Italy
8.4.7.6 Spain
8.4.7.7 Rest of Western Europe
8.5. Asia Pacific Pea Starch Market
8.5.1 Key Market Trends, Growth Factors and Opportunities
8.5.2 Top Key Companies
8.5.3 Historic and Forecasted Market Size by Segments
8.5.4 Historic and Forecasted Market Size by Type
8.5.4.1 Native Pea Starch
8.5.4.2 Modified Pea Starch
8.5.5 Historic and Forecasted Market Size by Source
8.5.5.1 Organic
8.5.5.2 Inorganic
8.5.6 Historic and Forecasted Market Size by Application
8.5.6.1 Food and Beverages
8.5.6.2 Pharmaceuticals & Nutraceuticals
8.5.6.3 Industrial
8.5.6.4 Feed
8.5.6.5 Other
8.5.7 Historic and Forecast Market Size by Country
8.5.7.1 China
8.5.7.2 India
8.5.7.3 Japan
8.5.7.4 South Korea
8.5.7.5 Malaysia
8.5.7.6 Thailand
8.5.7.7 Vietnam
8.5.7.8 The Philippines
8.5.7.9 Australia
8.5.7.10 New Zealand
8.5.7.11 Rest of APAC
8.6. Middle East & Africa Pea Starch Market
8.6.1 Key Market Trends, Growth Factors and Opportunities
8.6.2 Top Key Companies
8.6.3 Historic and Forecasted Market Size by Segments
8.6.4 Historic and Forecasted Market Size by Type
8.6.4.1 Native Pea Starch
8.6.4.2 Modified Pea Starch
8.6.5 Historic and Forecasted Market Size by Source
8.6.5.1 Organic
8.6.5.2 Inorganic
8.6.6 Historic and Forecasted Market Size by Application
8.6.6.1 Food and Beverages
8.6.6.2 Pharmaceuticals & Nutraceuticals
8.6.6.3 Industrial
8.6.6.4 Feed
8.6.6.5 Other
8.6.7 Historic and Forecast Market Size by Country
8.6.7.1 Turkiye
8.6.7.2 Bahrain
8.6.7.3 Kuwait
8.6.7.4 Saudi Arabia
8.6.7.5 Qatar
8.6.7.6 UAE
8.6.7.7 Israel
8.6.7.8 South Africa
8.7. South America Pea Starch Market
8.7.1 Key Market Trends, Growth Factors and Opportunities
8.7.2 Top Key Companies
8.7.3 Historic and Forecasted Market Size by Segments
8.7.4 Historic and Forecasted Market Size by Type
8.7.4.1 Native Pea Starch
8.7.4.2 Modified Pea Starch
8.7.5 Historic and Forecasted Market Size by Source
8.7.5.1 Organic
8.7.5.2 Inorganic
8.7.6 Historic and Forecasted Market Size by Application
8.7.6.1 Food and Beverages
8.7.6.2 Pharmaceuticals & Nutraceuticals
8.7.6.3 Industrial
8.7.6.4 Feed
8.7.6.5 Other
8.7.7 Historic and Forecast Market Size by Country
8.7.7.1 Brazil
8.7.7.2 Argentina
8.7.7.3 Rest of SA
Chapter 9 Analyst Viewpoint and Conclusion
9.1 Recommendations and Concluding Analysis
9.2 Potential Market Strategies
Chapter 10 Research Methodology
10.1 Research Process
10.2 Primary Research
10.3 Secondary Research
|
Global Pea Starch Market |
|||
|
Base Year: |
2024 |
Forecast Period: |
2025-2032 |
|
Historical Data: |
2018to 2023 |
Market Size in 2024: |
USD 216.55 Mn. |
|
Forecast Period 2022-28 CAGR: |
6.1% |
Market Size in 2032: |
USD 347.76 Mn. |
|
Segments Covered: |
By Type |
|
|
|
By Source |
|
||
|
By Application |
|
||
|
By Region |
|
||
|
Key Market Drivers: |
|
||
|
Key Market Restraints: |
|
||
|
Key Opportunities: |
|
||
|
Companies Covered in the report: |
|
||


