


P2P Payments Market Overview
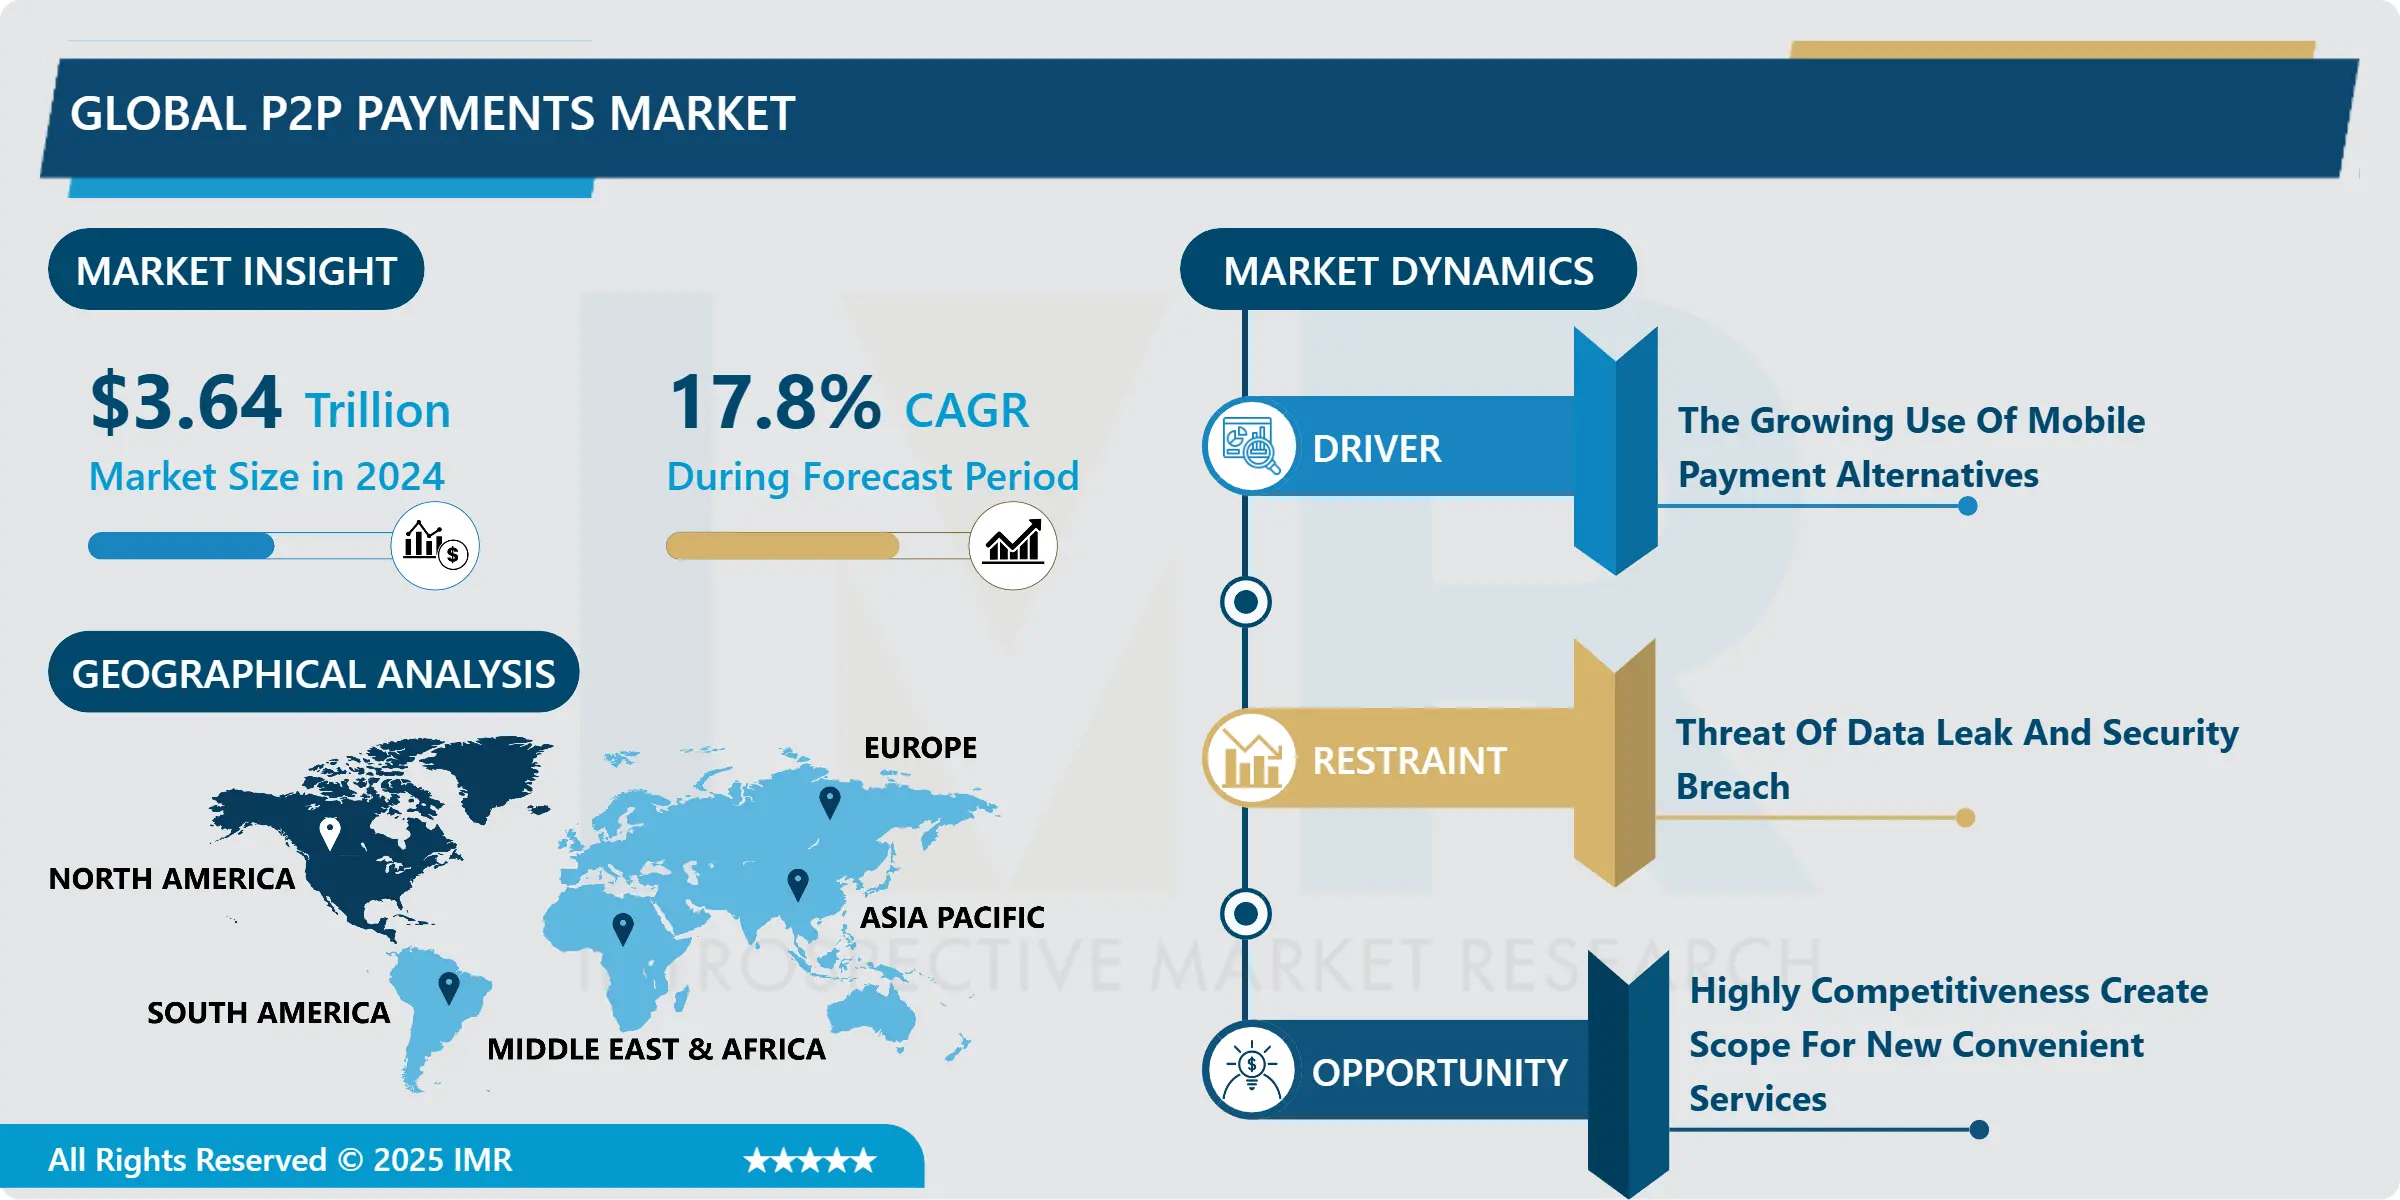
Global P2P Payments Market Size Is Expected To Grow From USD 3.64 Trillion in 2024 To USD 13.50 Trillion By 2032, At A CAGR Of 17.1% During The Forecast Period 2025-2032.
Peer to Peer (P2P) payments are a method by which a user can send money from his bank account to another person's account using the Internet or a mobile device as the digital medium. Payments are divided into two categories according to whether they are transferred to accounts inside or outside of the bank. A transfer is considered internal if it is made to an account held by the bank. A domestic transfer is made to an account not held by the bank. When a customer saves the payee bank account information during payee maintenance, this category occurs. Customers can start both internal and domestic payments from a single Transfer Money screen. A recent Billtrust survey found that 32% of Generation Z use P2P payment systems like Venmo or Zelle six times or more each month, with 79% using them at least once every other month. The P2P payment market is expanding globally as a result of extensive digitalization and growing user acceptance of online platforms, smartphones, and e-commerce services.

Market Dynamics And Factors For P2P Payments Market
Drivers:
The Growing Use Of Mobile Payment Alternatives Boosting The Market Growth
The industry is being driven by rising smartphone adoption in both established and developing nations like China and India, as well as increased consumer awareness of the benefits of mobile and online payments. Users may now use hassle-free payment methods on their smartphones, which stimulates the industry boom, as high-speed internet connectivity alternatives like 4G and 5G become more frequently used. Furthermore, smartphone makers' distribution networks have grown dramatically, increasing end users' access to smartphone hardware. Major mobile phone producers like Samsung, and Xiaomi, for instance, can provide web services to the rural population via their mobile phones because they have a broad distribution network in India. Due to rising smartphone usage and faster connectivity, people now receive and make payments using their cell phones, which is fueling the worldwide P2P payments business. Additionally, P2P payment networks aim to spur business expansion by lowering the costs of hiring people, running branches, and upkeep of physical assets. These networks lower the market risk for investors by providing borrowers with a solid foundation for securing repayment. Investors can facilitate a variety of market risks, such as interest rates, unemployment rates, and risk of property values, with the help of a P2P payments service, which aids in the growth of the global P2P payments industry.
Restraints:
Threat Of Data Leak And Security Breach
Market expansion is anticipated to be hampered by rising data leaks and security problems. Due to the hazards involved, most people choose banks over peer-to-peer payment platforms. The market for peer-to-peer payments will likely be severely constrained as a result. Because they provide guarantees against debt without collateral, service providers run the danger of losing money, which might further harm market expansion.
Opportunity:
Highly Competitiveness Create Scope For New Convenient Services In The Market
Since peer-to-peer payment methods are being used by large populations and service providers are also substantial in the global market this creates competitiveness in the market and leads to a variety of products and services by different players. Many contenders engage in tough competition for the top spot. Important players either acquire new rivals or combine with them. The players also invest a lot of money in research and development initiatives. Due to these initiatives, the P2P payments business grows, leading to technological advancements, updates, and new P2P payment capabilities. There have been a lot of mergers, acquisitions, joint ventures, and partnerships as the P2P payments sector has grown. The goal of the participants at these events is to advance their status as thought leaders in the P2P payment industry, which will subsequently enhance growth prospects.
Segmentation Analysis Of the P2P Payments Market
By Transaction Method, Near Field Communication segment is expected to dominate the P2P Payments Market. Strong demand in the NFC (near field communication) market will enable customers to better serve themselves by offering them a simple and hassle-free payment solution. Thanks to NFC technology, retailers can now include customer loyalty programs in their payment options, and customers can easily use coupons on their mobile devices. This market's expansion is projected to be aided by the expansion of online business platforms and the continued usage of cutting-edge technology for financial transactions. The adoption of NFC-based installments would probably be accelerated by the rising popularity of wearable installment devices and the emergence of a flexible trading pattern.
By Application, the Retail sector dominates P2P Payments Market. The increasing use of cell phones and the corresponding expansion of portable trade agreements are encouraging the segment's potential future growth. Mobile applications are currently, by far, the most used method of making purchases. Several shopping apps are used for 54% of flexible business payments, according to J.P. Morgan's 2020 E-trade Payments Trends Report. Another important aspect influencing the trend for flexible installments is increased cross-line acceptance. The issue in the fragment is getting worse because certain banks are seeking to forcefully forward portable installments. A modified setup of comprehensive installment solutions is also being developed by organizations to meet specific problems in the executive, lending, and security sectors.
Regional Analysis Of the P2P Payments Market
Asia Pacific dominates P2P Payments Market and is expected to make substantial advancements during the forecasted period. This is a result of numerous governments encouraging the use of electronic payments. Additionally, developing countries like India are undertaking a wide range of efforts and programs to promote digital payments. The Digital India initiative is one instance of this. Among the market leaders in Asia-Pacific for P2P payments are China and Indonesia. The main factor influencing the potential P2P payments industry in China is the availability of cutting-edge FinTech services there. Due to the absence of alternative investment alternatives and the higher returns provided by P2P investments, China has also been attracting investors. Around 904 million individuals in China utilized mobile payments in 2021. Mobile payments have mostly replaced cash and credit cards as the preferred payment option in the retail sector.
The landscape for digital financial services in Asia-Pacific is rapidly evolving. Due to the epidemic, Asian markets, particularly Southeast Asia, have embraced digitalization at a fast pace. Digital and P2P payment options have seen a sharp growth in traction in this area. Growing and assuming significant roles within the financial technology ecosystem are emerging markets. For instance, Indonesia's fintech sector produced a whopping USD 329 million in revenue in 2020, of which an astounding USD 158 million came from the payments sector alone. The regional market will also be driven by evolving lifestyles, increasing smartphone penetration, and contemporary internet purchasing patterns over the forecast period.

North America is the second fastest-growing region in the P2P Payments Market. The area is distinguished by the presence of various notable market players. Furthermore, North America was a pioneer in adopting cutting-edge products. The prevalence of automated stores in the United States is another factor driving the use of flexible payment methods. In North America, the proliferation of web-based commerce is often to blame for the widespread use of flexible payment alternatives. A few businesses are developing applications for remote payments, allowing customers to make purchases from any location. To help clients make payments securely and remotely using mobile devices, Sum-up, for instance, announced the rollout of flexible payments and invoicing across Europe in 2020. The expanding usage of virtual terminals for remote charging is predicted to lead to an expansion of fuel classification. The market for P2P payments in the area is anticipated to be driven by these factors.
Top Key Players Covered In P2P Payments Market
- Alibaba.com
- Apple Inc.
- Circle International Financial Limited
- Google LLC
- One97 Communications Limited (Paytm)
- PayPal Holdings Inc.
- Square, Inc.
- WePay Inc.
- Wise Payments Limited
- Zelle
- Venmo, LLC
- Other Active Players.
Key Industry Development In The P2P Payments Market
In February 2022, the introduction of Tap to Pay on the iPhone was announced by Apple. The new feature will enable millions of merchants in the US, from small businesses to large retailers, to use their iPhones to seamlessly and securely accept other digital wallets, including Apple Pay, contactless credit and debit cards, and Apple Pay, with just a simple tap to their iPhone — no additional hardware or payment terminal is required.
|
Global P2P Payments Market |
|||
|
Base Year: |
2024 |
Forecast Period: |
2025-2032 |
|
Historical Data: |
2018 to 2023 |
Market Size in 2024: |
USD 3.64 Tn. |
|
Forecast Period 2024-32 CAGR: |
17.8% |
Market Size in 2032: |
USD 13.50 Tn. |
|
Segments Covered: |
By Transaction Method |
|
|
|
By Application |
|
||
|
By Region |
|
||
|
Key Market Drivers: |
|
||
|
Key Market Restraints: |
|
||
|
Key Opportunities: |
|
||
|
Companies Covered in the report: |
|
||
Chapter 1: Introduction
1.1 Scope and Coverage
Chapter 2:Executive Summary
Chapter 3: Market Landscape
3.1 Market Dynamics
3.1.1 Drivers
3.1.2 Restraints
3.1.3 Opportunities
3.1.4 Challenges
3.2 Market Trend Analysis
3.3 PESTLE Analysis
3.4 Porter's Five Forces Analysis
3.5 Industry Value Chain Analysis
3.6 Ecosystem
3.7 Regulatory Landscape
3.8 Price Trend Analysis
3.9 Patent Analysis
3.10 Technology Evolution
3.11 Investment Pockets
3.12 Import-Export Analysis
Chapter 4: P2P Payments Market by Transaction Method (2018-2032)
4.1 P2P Payments Market Snapshot and Growth Engine
4.2 Market Overview
4.3 Near Field Communication
4.3.1 Introduction and Market Overview
4.3.2 Historic and Forecasted Market Size in Value USD and Volume Units
4.3.3 Key Market Trends, Growth Factors, and Opportunities
4.3.4 Geographic Segmentation Analysis
4.4 Mobile Web Payments
4.5 SMS/Direct Carrier Billing
4.6 Others
Chapter 5: P2P Payments Market by Application (2018-2032)
5.1 P2P Payments Market Snapshot and Growth Engine
5.2 Market Overview
5.3 Media & Entertainment
5.3.1 Introduction and Market Overview
5.3.2 Historic and Forecasted Market Size in Value USD and Volume Units
5.3.3 Key Market Trends, Growth Factors, and Opportunities
5.3.4 Geographic Segmentation Analysis
5.4 Energy & Utilities
5.5 Healthcare
5.6 Retail
5.7 Hospitality & Transportation
Chapter 6: Company Profiles and Competitive Analysis
6.1 Competitive Landscape
6.1.1 Competitive Benchmarking
6.1.2 P2P Payments Market Share by Manufacturer (2024)
6.1.3 Industry BCG Matrix
6.1.4 Heat Map Analysis
6.1.5 Mergers and Acquisitions
6.2 NEW BALANCE (US)
6.2.1 Company Overview
6.2.2 Key Executives
6.2.3 Company Snapshot
6.2.4 Role of the Company in the Market
6.2.5 Sustainability and Social Responsibility
6.2.6 Operating Business Segments
6.2.7 Product Portfolio
6.2.8 Business Performance
6.2.9 Key Strategic Moves and Recent Developments
6.2.10 SWOT Analysis
6.3 VVF INDIA LIMITED ( INDIA)
6.4 A.I.G. TECHNOLOGIES INC. (US)
6.5 SARVOTHAM CARE LIMITED ( INDIA )
6.6 NUTRIX (US)
6.7 FORMULA CORP. (US)
6.8 MANSFIELD-KING LLC (MK) (US)
6.9 TROPICAL PRODUCTS INC. (US)
6.10 SENSIBLE ORGANICS (US)
6.11 APOLLOCORP INC. (US)
6.12 COVALENCE LABORATORIES (US)
6.13 MCBRIDE PLC (UK)
6.14 RCP RANSTADT GMBH (GERMANY)
6.15 BEAUTECH INDUSTRIES LIMITED ( CHINA)
6.16 SKINLYS (FRANCE)
6.17 ALKOS GROUP ( FRANCE )
6.18 OTHER KEY PLAYERS
Chapter 7: Global P2P Payments Market By Region
7.1 Overview
7.2. North America P2P Payments Market
7.2.1 Key Market Trends, Growth Factors and Opportunities
7.2.2 Top Key Companies
7.2.3 Historic and Forecasted Market Size by Segments
7.2.4 Historic and Forecasted Market Size by Transaction Method
7.2.4.1 Near Field Communication
7.2.4.2 Mobile Web Payments
7.2.4.3 SMS/Direct Carrier Billing
7.2.4.4 Others
7.2.5 Historic and Forecasted Market Size by Application
7.2.5.1 Media & Entertainment
7.2.5.2 Energy & Utilities
7.2.5.3 Healthcare
7.2.5.4 Retail
7.2.5.5 Hospitality & Transportation
7.2.6 Historic and Forecast Market Size by Country
7.2.6.1 US
7.2.6.2 Canada
7.2.6.3 Mexico
7.3. Eastern Europe P2P Payments Market
7.3.1 Key Market Trends, Growth Factors and Opportunities
7.3.2 Top Key Companies
7.3.3 Historic and Forecasted Market Size by Segments
7.3.4 Historic and Forecasted Market Size by Transaction Method
7.3.4.1 Near Field Communication
7.3.4.2 Mobile Web Payments
7.3.4.3 SMS/Direct Carrier Billing
7.3.4.4 Others
7.3.5 Historic and Forecasted Market Size by Application
7.3.5.1 Media & Entertainment
7.3.5.2 Energy & Utilities
7.3.5.3 Healthcare
7.3.5.4 Retail
7.3.5.5 Hospitality & Transportation
7.3.6 Historic and Forecast Market Size by Country
7.3.6.1 Russia
7.3.6.2 Bulgaria
7.3.6.3 The Czech Republic
7.3.6.4 Hungary
7.3.6.5 Poland
7.3.6.6 Romania
7.3.6.7 Rest of Eastern Europe
7.4. Western Europe P2P Payments Market
7.4.1 Key Market Trends, Growth Factors and Opportunities
7.4.2 Top Key Companies
7.4.3 Historic and Forecasted Market Size by Segments
7.4.4 Historic and Forecasted Market Size by Transaction Method
7.4.4.1 Near Field Communication
7.4.4.2 Mobile Web Payments
7.4.4.3 SMS/Direct Carrier Billing
7.4.4.4 Others
7.4.5 Historic and Forecasted Market Size by Application
7.4.5.1 Media & Entertainment
7.4.5.2 Energy & Utilities
7.4.5.3 Healthcare
7.4.5.4 Retail
7.4.5.5 Hospitality & Transportation
7.4.6 Historic and Forecast Market Size by Country
7.4.6.1 Germany
7.4.6.2 UK
7.4.6.3 France
7.4.6.4 The Netherlands
7.4.6.5 Italy
7.4.6.6 Spain
7.4.6.7 Rest of Western Europe
7.5. Asia Pacific P2P Payments Market
7.5.1 Key Market Trends, Growth Factors and Opportunities
7.5.2 Top Key Companies
7.5.3 Historic and Forecasted Market Size by Segments
7.5.4 Historic and Forecasted Market Size by Transaction Method
7.5.4.1 Near Field Communication
7.5.4.2 Mobile Web Payments
7.5.4.3 SMS/Direct Carrier Billing
7.5.4.4 Others
7.5.5 Historic and Forecasted Market Size by Application
7.5.5.1 Media & Entertainment
7.5.5.2 Energy & Utilities
7.5.5.3 Healthcare
7.5.5.4 Retail
7.5.5.5 Hospitality & Transportation
7.5.6 Historic and Forecast Market Size by Country
7.5.6.1 China
7.5.6.2 India
7.5.6.3 Japan
7.5.6.4 South Korea
7.5.6.5 Malaysia
7.5.6.6 Thailand
7.5.6.7 Vietnam
7.5.6.8 The Philippines
7.5.6.9 Australia
7.5.6.10 New Zealand
7.5.6.11 Rest of APAC
7.6. Middle East & Africa P2P Payments Market
7.6.1 Key Market Trends, Growth Factors and Opportunities
7.6.2 Top Key Companies
7.6.3 Historic and Forecasted Market Size by Segments
7.6.4 Historic and Forecasted Market Size by Transaction Method
7.6.4.1 Near Field Communication
7.6.4.2 Mobile Web Payments
7.6.4.3 SMS/Direct Carrier Billing
7.6.4.4 Others
7.6.5 Historic and Forecasted Market Size by Application
7.6.5.1 Media & Entertainment
7.6.5.2 Energy & Utilities
7.6.5.3 Healthcare
7.6.5.4 Retail
7.6.5.5 Hospitality & Transportation
7.6.6 Historic and Forecast Market Size by Country
7.6.6.1 Turkiye
7.6.6.2 Bahrain
7.6.6.3 Kuwait
7.6.6.4 Saudi Arabia
7.6.6.5 Qatar
7.6.6.6 UAE
7.6.6.7 Israel
7.6.6.8 South Africa
7.7. South America P2P Payments Market
7.7.1 Key Market Trends, Growth Factors and Opportunities
7.7.2 Top Key Companies
7.7.3 Historic and Forecasted Market Size by Segments
7.7.4 Historic and Forecasted Market Size by Transaction Method
7.7.4.1 Near Field Communication
7.7.4.2 Mobile Web Payments
7.7.4.3 SMS/Direct Carrier Billing
7.7.4.4 Others
7.7.5 Historic and Forecasted Market Size by Application
7.7.5.1 Media & Entertainment
7.7.5.2 Energy & Utilities
7.7.5.3 Healthcare
7.7.5.4 Retail
7.7.5.5 Hospitality & Transportation
7.7.6 Historic and Forecast Market Size by Country
7.7.6.1 Brazil
7.7.6.2 Argentina
7.7.6.3 Rest of SA
Chapter 8 Analyst Viewpoint and Conclusion
8.1 Recommendations and Concluding Analysis
8.2 Potential Market Strategies
Chapter 9 Research Methodology
9.1 Research Process
9.2 Primary Research
9.3 Secondary Research
|
Global P2P Payments Market |
|||
|
Base Year: |
2024 |
Forecast Period: |
2025-2032 |
|
Historical Data: |
2018 to 2023 |
Market Size in 2024: |
USD 3.64 Tn. |
|
Forecast Period 2024-32 CAGR: |
17.8% |
Market Size in 2032: |
USD 13.50 Tn. |
|
Segments Covered: |
By Transaction Method |
|
|
|
By Application |
|
||
|
By Region |
|
||
|
Key Market Drivers: |
|
||
|
Key Market Restraints: |
|
||
|
Key Opportunities: |
|
||
|
Companies Covered in the report: |
|
||


