


IOT Payments Market Overview
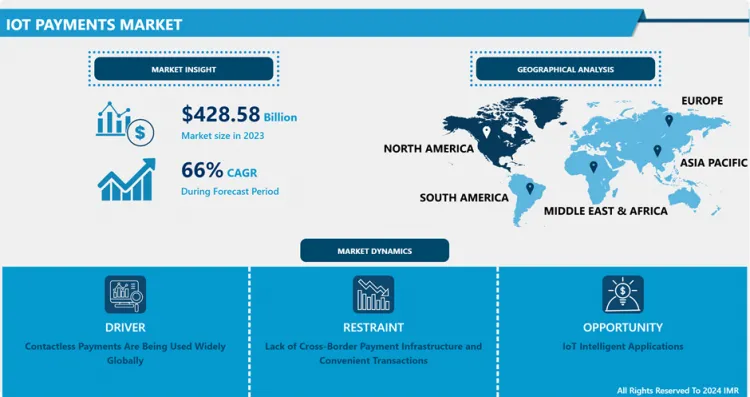
The Global IOT Payments Market size is expected to grow from USD 428.58 Billion in 2023 to USD 41020.85 billion by 2032, at a CAGR of 66% during the forecast period (2024-2032).
Consumers and retailers are rapidly adopting technology and using the IoT to further digitize their relationships. Internet of Things (IoT) is designed as the best form of integration between people and communication devices and devices. It is a network of devices, machines, vehicles, and buildings connected via communication networks such as the Internet, RFID, and NFC, with microprocessors, sensors, and corresponding software for data acquisition, processing, and real-time delivery. The purpose of establishing this network is to create automated living and working conditions that allow individuals to easily navigate and perform routine processes quickly through an intelligent environment. Payment is one of the key issues in IoT development as many of the relationships that emerge are business-related and require payment for services and products. Integration of AI and Machine Learning in IoT has pushed the new developments of secured payment getaways making safe transactions globally. The role and importance of electronic payments in the development of IoT concepts are constantly growing and further pushing the global IoT payments market.

Covid19 Impact on IoT Payments Market
Covid19 pandemic caused a major shift to cashless transactions as the world goes into lockdown and social distancing norms have become new normal which have created a major impact on physical transactions. IoT technology can monitor and manage these online transactions electronically, helping to streamline payments. Electronic payments are already benefiting from the long-standing trend that physical cash is rapidly becoming a thing of the past and the outbreak of COVID 19 is expected to accelerate the use of electronic payment methods. Moreover, the total number of transactions is declining, but most shops around the world only accept digital payments. Cash is rapidly becoming a thing of the past, but some traditional generations are still resisting the use of digital currencies.
Digital payments continue to evolve, adding solvent IoT devices that extend the browser and mobile payment experience. Consumers can pay on a variety of newly connected devices, including connected cars, appliances, and more recently wearables. At the same time, the IoT is also changing retail point-of-sale (PoS) with several new touchpoints such as parking meters, changing room mirrors, and vending machines. IoT devices range from small portable devices and shopping carts to home appliances and automobiles. The IoT device uses the connection channel to initiate a payment transaction. Thus, Covid19 has certainly caused a dimensional shift in terms of payment methods which is beneficial for the IoT payments market.
Market Dynamics and Factors:
Drivers
Contactless payments are being used widely in all parts of the world which helps reduce customer queues and hassles and provides transparent transactions which yield higher revenue for retailers. Contactless transactions are much faster than traditional cash and conventional card transactions. The reduced transactional time creates a great outcome in shorter queues, growth in revenue, and improved customer satisfaction. Due to increased output at each Point of Sale (PoS), a minimum workforce is required during peak hours. Visa claims that the acceptance of contactless smart cards has grown globally as the transaction process becomes easy and hassle-free. Europe and the Asia Pacific are the leading regions in terms of adopting contactless smart cards.
All major governments are introducing the new regulation on IoT-related potential verticals to streamline the process of IT and cyber security as the growing digitalization in every sector creates room for an improved regulatory framework. UK and Australia are among the leading countries to ensure the top cyber security laws and implementation. The United States also made notable additions in the regulation adding reasonable security features in IoT devices and special provisions made for IoT-based payment getaways. Acknowledgment from the government boosted the IoT payment market.
Restraints
IoT is a fairly new concept that has the fastest adoption rate among customers as well as service providers. IoT can be utilized in any part of the world with desired verticals which makes it globally accessible. One of the major restraining factors of IoT is the lack of cross-border payment infrastructure and convenient transactions for the common user. Limited payment getaways and higher processing charges make it slightly expensive for small transactions.
Opportunities
IoT Intelligent Applications have a tremendous opportunity in IoT-based payment getaways as the integration of AI and Machine learning technologies into the IoT Payment market. IoT Intelligent Applications are software-as-a-service (SaaS) applications that analyse, process, and present IoT sensor data to business users through dashboards. IoT applications run through machine learning algorithms to analyse huge amounts of linked sensor data in the cloud. Using IoT dashboards alerts provides visibility into KPIs, statistics for mean time between failures, transactional data, internal documentation, and other information. Machine learning-based algorithms identify abnormal anomalies and provide alerts to users and even proceed with automated fixes or suitable countermeasures. Application of AI and Machine Learning have potential growth opportunities in the IoT payment market in the coming years.
Challenges
Currently, sophisticated cyber-attacks are the main challenge to face by the IoT payment market as cross-border transactions are generally carried out online and the growing trend of IoT-based transactions in large volume has to be ultra secured due to threats of cyber-attacks on such occasions.Capacity and Scalability are considered to be the main challenges faced by the IoT payment platforms due to the large transaction volume and capacity of processing it from the payment companies. Such transaction often sees heavy traffic on the servers as well as a breakdown of the system which is the cause of concern. Protection of personal data which is required for IoT transactions is the key challenge for payment companies need to address to attract the general population which holds a large number of shares in the market.
Market Segmentation
Segmentation Analysis of IOT Payments Market:
By Component, Solution is the dominating component segment of the IoT payments market. Digital payment wallet is one of the fastest-growing platforms in contactless payment in the solution segment which allows keeping money in the secured virtual container which is generally used for payments, money transfers. Currently, digital payment wallets are being used at large in mobile with the constant mobile-friendly application is being introduced by blue ocean and red ocean companies which makes it a very competitive market. Payment getaway solutions and payment processing solutions are the traditional transaction methods that are generally used by the banking and finance sector for security purposes with large amounts of transactions. Nonetheless, these solutions are still the preferred choice in many organizations for large volume transactions.
By Deployment Type, Cloud is dominating in the deployment segment of the IoT payments market and is anticipated to grow during the forecasted period. Cloud bases Software as a service (SaaS) is growing at a swift pace in the BFSI and IT sector allowing businesses to streamline their payment structure to be a seamless experience for customers as well as vendors and stakeholders of the organization. Cloud-based IoT payment applications allow the data to be processed, manage and secure on massive cloud platforms using real-time IoT dashboards which provide visibility in transactions. Companies like Oracle and Google are the major cloud computing service provider to leading companies and governments globally.
By Organisation Size, Large enterprises are leading in the organization size segment of the IoT payments market. Enterprise with more than 1500 workforce considered as the large enterprise which adopts the digital payment solutions for flawless payment landscape, dynamic customer trends and streamlines business operations across the organization which creates market competitiveness. The Omnichannel approach used by large enterprises for delightful customer experience drives the organization for digital payment solutions, E-wallets and easy payment process create which drives the market growth of IoT payment market.
By Verticals, Retail and Ecommerce is the dominating in a vertical segment in IoT payment market. Retail and Ecommerce are anticipated to grow during the forecasted period as the integration of the online market, digital payment, and synchronization of electronic devices with the internet makes it the smoother option of payment for goods and services. Retails and Ecommerce also integrated digital wallet systems and loyalty points for digital payments to boost online transactions and utilize the massive opportunity with a larger customer base for IoT payment options. Retail and Ecommerce is the major contributor to the growth of the IoT payment market.
Players Covered in IOT Payments Market are :
- ACI Worldwide
- Adyen
- Aurus
- Aliant Payments
- Alipay
- Apple Pay
- Due
- Dwolla
- FattMerchant
- FIS
- Fiserv
- Global Payments
- Intuit
- JPMorgan Chase
- Mastercard
- PayPal
- Paysafe
- PayTrace
- PayU
- Spreedly
- Square
- Stripe
- Visa
- WEX
- Worldline
- 2Checkout and other major players.
Regional Analysis of IoT Payments Market
- North America holds the largest share in the IoT payment market. North America has a robust digital infrastructure that has vast connectivity throughout the region. Government policies on digital payments and constantly upgrading digital infrastructure creates an open space for companies to integrate digital transaction into a variety of business verticals which adds growth in Digital and IoT payment options. The New IoT regulatory framework allows for secured and hassle-free transactions makes the North America a dominating region in the IoT payment market.
- The European region is the second leading region in terms of IoT payments as countries like the UK, Germany, and France boost the investment into creating seamless digital infrastructure and cross-border payment getaways.
- Asia Pacific is the fastest-growing region and is expected to surpass the European region by 2027 as massive FDI in developing countries like India, Philippines, Malaysia, and other southeast Asian countries and growing IT infrastructure provides a huge opportunity in the growth of the IoT payment market.
Key Developments of IoT Payments Market
- July 2020, B2B API Tracker allows billing and processing of B2B payments can be simplified through open banking. Using the API, accounting platforms can accelerate payments by issuing invoices with built-in money orders and acceptance features. The open banking mechanism gives third-party providers secure and real-time access to customer financial information through application programming interfaces. This approach allows banks to offer bespoke financial products, especially payment solutions, to existing customers For B2B payments, you can also use an API that integrates payment data to minimize card processing charges, resulting in near-zero processing charges.
|
Global IoT Payments Market |
|||
|
Base Year: |
2023 |
Forecast Period: |
2024-2032 |
|
Historical Data: |
2017 to 2023 |
Market Size in 2023: |
USD 428.58 Bn. |
|
Forecast Period 2024-32 CAGR: |
66% |
Market Size in 2032: |
USD 41020.85 Bn. |
|
Segments Covered: |
By Components |
|
|
|
By Deployment |
|
||
|
By Enterprise Size |
|
||
|
By Verticals |
|
||
|
By Region |
|
||
|
Key Market Drivers: |
|
||
|
Key Market Restraints: |
|
||
|
Key Opportunities: |
|
||
|
Companies Covered in the report: |
|
||
1.1 Scope and Coverage
Chapter 2:Executive Summary
Chapter 3: Market Landscape
3.1 Market Dynamics
3.1.1 Drivers
3.1.2 Restraints
3.1.3 Opportunities
3.1.4 Challenges
3.2 Market Trend Analysis
3.3 PESTLE Analysis
3.4 Porter's Five Forces Analysis
3.5 Industry Value Chain Analysis
3.6 Ecosystem
3.7 Regulatory Landscape
3.8 Price Trend Analysis
3.9 Patent Analysis
3.10 Technology Evolution
3.11 Investment Pockets
3.12 Import-Export Analysis
Chapter 4: IOT Payments Market by Components (2018-2032)
4.1 IOT Payments Market Snapshot and Growth Engine
4.2 Market Overview
4.3 Solutions
4.3.1 Introduction and Market Overview
4.3.2 Historic and Forecasted Market Size in Value USD and Volume Units
4.3.3 Key Market Trends, Growth Factors, and Opportunities
4.3.4 Geographic Segmentation Analysis
4.4 Services
Chapter 5: IOT Payments Market by Deployment (2018-2032)
5.1 IOT Payments Market Snapshot and Growth Engine
5.2 Market Overview
5.3 Cloud-Based
5.3.1 Introduction and Market Overview
5.3.2 Historic and Forecasted Market Size in Value USD and Volume Units
5.3.3 Key Market Trends, Growth Factors, and Opportunities
5.3.4 Geographic Segmentation Analysis
5.4 On-Premise
Chapter 6: IOT Payments Market by Enterprise Size (2018-2032)
6.1 IOT Payments Market Snapshot and Growth Engine
6.2 Market Overview
6.3 Large Enterprises
6.3.1 Introduction and Market Overview
6.3.2 Historic and Forecasted Market Size in Value USD and Volume Units
6.3.3 Key Market Trends, Growth Factors, and Opportunities
6.3.4 Geographic Segmentation Analysis
6.4 SMEs
Chapter 7: IOT Payments Market by Verticals (2018-2032)
7.1 IOT Payments Market Snapshot and Growth Engine
7.2 Market Overview
7.3 BFSI
7.3.1 Introduction and Market Overview
7.3.2 Historic and Forecasted Market Size in Value USD and Volume Units
7.3.3 Key Market Trends, Growth Factors, and Opportunities
7.3.4 Geographic Segmentation Analysis
7.4 Retail and Ecommerce
7.5 Healthcare
7.6 Travel and Hospitality
7.7 Transportation and logistics
7.8 Others
Chapter 8: Company Profiles and Competitive Analysis
8.1 Competitive Landscape
8.1.1 Competitive Benchmarking
8.1.2 IOT Payments Market Share by Manufacturer (2024)
8.1.3 Industry BCG Matrix
8.1.4 Heat Map Analysis
8.1.5 Mergers and Acquisitions
8.2 CARGILL CORPORATION
8.2.1 Company Overview
8.2.2 Key Executives
8.2.3 Company Snapshot
8.2.4 Role of the Company in the Market
8.2.5 Sustainability and Social Responsibility
8.2.6 Operating Business Segments
8.2.7 Product Portfolio
8.2.8 Business Performance
8.2.9 Key Strategic Moves and Recent Developments
8.2.10 SWOT Analysis
8.3 BERRY PLASTICS CORPORATION
8.4 HENRY & SONS AND QINGDAO HAIDE PACKAGING CO. LTDPLASTOPIL HAZOREA CO. LTDALCAN PACKAGING FOOD AMERICAS PLASTOPIL BV
8.5 KENDALL PACKAGING CORPORATION
8.6 R.A JONES GROUP LTD
8.7 SEALED AIR CORPORATION
8.8 INTEPLAST GROUP
8.9 COVERIS HOLDINGS SA
8.10 BEMIS COMPANY
8.11 FLEXOPACK S.AHOVUS INCORPORATED
Chapter 9: Global IOT Payments Market By Region
9.1 Overview
9.2. North America IOT Payments Market
9.2.1 Key Market Trends, Growth Factors and Opportunities
9.2.2 Top Key Companies
9.2.3 Historic and Forecasted Market Size by Segments
9.2.4 Historic and Forecasted Market Size by Components
9.2.4.1 Solutions
9.2.4.2 Services
9.2.5 Historic and Forecasted Market Size by Deployment
9.2.5.1 Cloud-Based
9.2.5.2 On-Premise
9.2.6 Historic and Forecasted Market Size by Enterprise Size
9.2.6.1 Large Enterprises
9.2.6.2 SMEs
9.2.7 Historic and Forecasted Market Size by Verticals
9.2.7.1 BFSI
9.2.7.2 Retail and Ecommerce
9.2.7.3 Healthcare
9.2.7.4 Travel and Hospitality
9.2.7.5 Transportation and logistics
9.2.7.6 Others
9.2.8 Historic and Forecast Market Size by Country
9.2.8.1 US
9.2.8.2 Canada
9.2.8.3 Mexico
9.3. Eastern Europe IOT Payments Market
9.3.1 Key Market Trends, Growth Factors and Opportunities
9.3.2 Top Key Companies
9.3.3 Historic and Forecasted Market Size by Segments
9.3.4 Historic and Forecasted Market Size by Components
9.3.4.1 Solutions
9.3.4.2 Services
9.3.5 Historic and Forecasted Market Size by Deployment
9.3.5.1 Cloud-Based
9.3.5.2 On-Premise
9.3.6 Historic and Forecasted Market Size by Enterprise Size
9.3.6.1 Large Enterprises
9.3.6.2 SMEs
9.3.7 Historic and Forecasted Market Size by Verticals
9.3.7.1 BFSI
9.3.7.2 Retail and Ecommerce
9.3.7.3 Healthcare
9.3.7.4 Travel and Hospitality
9.3.7.5 Transportation and logistics
9.3.7.6 Others
9.3.8 Historic and Forecast Market Size by Country
9.3.8.1 Russia
9.3.8.2 Bulgaria
9.3.8.3 The Czech Republic
9.3.8.4 Hungary
9.3.8.5 Poland
9.3.8.6 Romania
9.3.8.7 Rest of Eastern Europe
9.4. Western Europe IOT Payments Market
9.4.1 Key Market Trends, Growth Factors and Opportunities
9.4.2 Top Key Companies
9.4.3 Historic and Forecasted Market Size by Segments
9.4.4 Historic and Forecasted Market Size by Components
9.4.4.1 Solutions
9.4.4.2 Services
9.4.5 Historic and Forecasted Market Size by Deployment
9.4.5.1 Cloud-Based
9.4.5.2 On-Premise
9.4.6 Historic and Forecasted Market Size by Enterprise Size
9.4.6.1 Large Enterprises
9.4.6.2 SMEs
9.4.7 Historic and Forecasted Market Size by Verticals
9.4.7.1 BFSI
9.4.7.2 Retail and Ecommerce
9.4.7.3 Healthcare
9.4.7.4 Travel and Hospitality
9.4.7.5 Transportation and logistics
9.4.7.6 Others
9.4.8 Historic and Forecast Market Size by Country
9.4.8.1 Germany
9.4.8.2 UK
9.4.8.3 France
9.4.8.4 The Netherlands
9.4.8.5 Italy
9.4.8.6 Spain
9.4.8.7 Rest of Western Europe
9.5. Asia Pacific IOT Payments Market
9.5.1 Key Market Trends, Growth Factors and Opportunities
9.5.2 Top Key Companies
9.5.3 Historic and Forecasted Market Size by Segments
9.5.4 Historic and Forecasted Market Size by Components
9.5.4.1 Solutions
9.5.4.2 Services
9.5.5 Historic and Forecasted Market Size by Deployment
9.5.5.1 Cloud-Based
9.5.5.2 On-Premise
9.5.6 Historic and Forecasted Market Size by Enterprise Size
9.5.6.1 Large Enterprises
9.5.6.2 SMEs
9.5.7 Historic and Forecasted Market Size by Verticals
9.5.7.1 BFSI
9.5.7.2 Retail and Ecommerce
9.5.7.3 Healthcare
9.5.7.4 Travel and Hospitality
9.5.7.5 Transportation and logistics
9.5.7.6 Others
9.5.8 Historic and Forecast Market Size by Country
9.5.8.1 China
9.5.8.2 India
9.5.8.3 Japan
9.5.8.4 South Korea
9.5.8.5 Malaysia
9.5.8.6 Thailand
9.5.8.7 Vietnam
9.5.8.8 The Philippines
9.5.8.9 Australia
9.5.8.10 New Zealand
9.5.8.11 Rest of APAC
9.6. Middle East & Africa IOT Payments Market
9.6.1 Key Market Trends, Growth Factors and Opportunities
9.6.2 Top Key Companies
9.6.3 Historic and Forecasted Market Size by Segments
9.6.4 Historic and Forecasted Market Size by Components
9.6.4.1 Solutions
9.6.4.2 Services
9.6.5 Historic and Forecasted Market Size by Deployment
9.6.5.1 Cloud-Based
9.6.5.2 On-Premise
9.6.6 Historic and Forecasted Market Size by Enterprise Size
9.6.6.1 Large Enterprises
9.6.6.2 SMEs
9.6.7 Historic and Forecasted Market Size by Verticals
9.6.7.1 BFSI
9.6.7.2 Retail and Ecommerce
9.6.7.3 Healthcare
9.6.7.4 Travel and Hospitality
9.6.7.5 Transportation and logistics
9.6.7.6 Others
9.6.8 Historic and Forecast Market Size by Country
9.6.8.1 Turkiye
9.6.8.2 Bahrain
9.6.8.3 Kuwait
9.6.8.4 Saudi Arabia
9.6.8.5 Qatar
9.6.8.6 UAE
9.6.8.7 Israel
9.6.8.8 South Africa
9.7. South America IOT Payments Market
9.7.1 Key Market Trends, Growth Factors and Opportunities
9.7.2 Top Key Companies
9.7.3 Historic and Forecasted Market Size by Segments
9.7.4 Historic and Forecasted Market Size by Components
9.7.4.1 Solutions
9.7.4.2 Services
9.7.5 Historic and Forecasted Market Size by Deployment
9.7.5.1 Cloud-Based
9.7.5.2 On-Premise
9.7.6 Historic and Forecasted Market Size by Enterprise Size
9.7.6.1 Large Enterprises
9.7.6.2 SMEs
9.7.7 Historic and Forecasted Market Size by Verticals
9.7.7.1 BFSI
9.7.7.2 Retail and Ecommerce
9.7.7.3 Healthcare
9.7.7.4 Travel and Hospitality
9.7.7.5 Transportation and logistics
9.7.7.6 Others
9.7.8 Historic and Forecast Market Size by Country
9.7.8.1 Brazil
9.7.8.2 Argentina
9.7.8.3 Rest of SA
Chapter 10 Analyst Viewpoint and Conclusion
10.1 Recommendations and Concluding Analysis
10.2 Potential Market Strategies
Chapter 11 Research Methodology
11.1 Research Process
11.2 Primary Research
11.3 Secondary Research
|
Global IoT Payments Market |
|||
|
Base Year: |
2023 |
Forecast Period: |
2024-2032 |
|
Historical Data: |
2017 to 2023 |
Market Size in 2023: |
USD 428.58 Bn. |
|
Forecast Period 2024-32 CAGR: |
66% |
Market Size in 2032: |
USD 41020.85 Bn. |
|
Segments Covered: |
By Components |
|
|
|
By Deployment |
|
||
|
By Enterprise Size |
|
||
|
By Verticals |
|
||
|
By Region |
|
||
|
Key Market Drivers: |
|
||
|
Key Market Restraints: |
|
||
|
Key Opportunities: |
|
||
|
Companies Covered in the report: |
|
||
Frequently Asked Questions :
The forecast period in the IoT Payments Market research report is 2023-2030.
ACI Worldwide, Adyen, Aurus, Aliant Payments, Alipay, Apple Pay, Due, Dwolla, FattMerchant, FIS, Fiserv, Global Payments, Intuit, JPMorgan Chase, Mastercard, PayPal, Paysafe, PayTrace, PayU, Spreedly, Square, Stripe, Visa, WEX, Worldline, 2Checkout and other major players.
The IoT Payments Market is segmented into Components, Deployment, Organisation Size, Verticals and region. By Components, the market is categorized into Solution, Service. By Deployment, the market is categorized into Cloud, On-Premises. By Organisation Size, the market is categorized into SMEs, Large Enterprise. By Verticals, the market is categorized into BFSI, Retail, Ecommerce, Healthcare, Travel, Hospitality, Transportation, Logistics, Others. By region, it is analyzed across North America (U.S.; Canada; Mexico), Europe (Germany; U.K.; France; Italy; Russia; Spain, etc.), Asia-Pacific (China; India; Japan; Southeast Asia, etc.), South America (Brazil; Argentina, etc.), Middle East & Africa (Saudi Arabia; South Africa, etc.).
Consumers and retailers are rapidly adopting technology and using the IoT to further digitize their relationships. Internet of Things (IoT) is designed as the best form of integration between people and communication devices and devices.
The Global IOT Payments Market size is expected to grow from USD 428.58 Billion in 2023 to USD 41020.85 billion by 2032, at a CAGR of 66% during the forecast period (2024-2032).


