


Working Capital Loan Market Synopsis
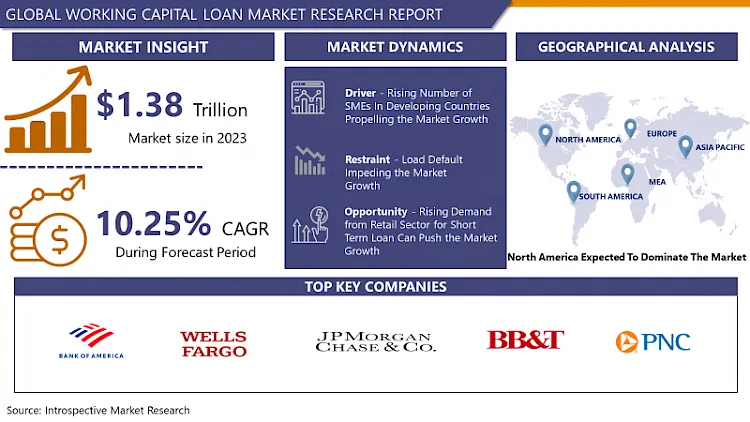
Working Capital Loan Market Size Was Valued at USD 1.38 Trillion in 2023, and is Projected to Reach USD 3.32 Trillion by 2032, Growing at a CAGR of 10.25% From 2024-2032.
The working capital loan market being a part of the finance industry offers short-term funding solutions for appropriate working capital to support daily operations. These types of loans are often used to pay urgent costs, including employees’ wages, stocks, and other pertinent operating costs, to avoid interruptions in organizational operations due to lack of cash. There are changes in the increased demand for working capital loans in Kenya primarily fueled by SMEs that struggle to access credits or failed to manage their cash flows.Over the years, the market has lately gone through a significant upgrade through the influence of financial technology more commonly referred to as Fintech. New lending solutions that have been pioneered by Fintech companies have come with better and easier procedures of approving loans as compared to what is available in the conventional banks. These platforms therefore exploit big data and artificial intelligence to evaluate the credit worthiness of applicants hence freeing up time and offering quick approval and disbursal of credit. This has in turn has enhanced the flexibility of working capital loans and allowed credit to reach more startups and other credit constrained firms.
Some of the players that continue to exert influence in the working capital loan market include the conventional banks and a growing list of FinTech firms. Trusted money lenders granted remain dominant players in the market due to their established customer base and deep pockets. However, the institutional lenders are progressively faced with competition from fintech lenders because the latter renders customized solutions alongside improved client relations. As a rule, they have more favorable conditions of the loan repayment, sometimes the interest rates are lower, which assists those businesses that seek more beneficial credit conditions.
Regionally, the working capital loan market; therefore, operating in both developed and developing countries. In developed markets they target to provide quality lending, with the help of advanced technology they aim at satisfying the complex requirements of established businesses. on the other hand, the increase in demand is coming from emerging markets owing to the growth in the SME sector and the consequent urgent requirement of accessible funds. The government activities in these regions are also contributing significantly, which is promoting the development of fintech and expanding access to financial services.
Incorporating the factors discussed above, the working capital loan market can be said to be steadily growing towards further growth because of technological enhancements and change in business requirements. Lending activities are also set to be made more efficient through the use of digital solutions and strengthened algorithms, and customers are anticipated to be satisfied with the changes more often. In recent years, there has been a growing demand for versatile and efficient financing techniques among firms Which has made it possible for the whole market to be fuelled further in the next year that will come.
.webp)
Working Capital Loan Market Trend Analysis
Rise of Fintech Solutions in Working Capital Loans
- Fintech companies leverage advanced technologies such as artificial intelligence, machine learning, and big data analytics to streamline the loan approval process, making it faster, more efficient, and accessible. Unlike traditional banks, fintech firms offer quick, often same-day, loan approvals with minimal documentation, catering to small and medium-sized enterprises (SMEs) that require immediate working capital to sustain operations or capitalize on growth opportunities.
- These digital platforms also utilize alternative data sources to assess creditworthiness, enabling them to extend credit to businesses with limited or no credit history, which would typically be overlooked by conventional lenders. Additionally, the flexibility and customization of loan products provided by ehnTech solutions meet the specific needs of diverse businesses, enhancing customer satisfaction and market growth. As a result, the convenience, speed, and inclusivity offered by fintech solutions are driving an increasing number of businesses to opt for these modern financial services, thereby propelling the expansion of the working capital loan market.
Integration of Digital Platforms and Ecosystems
- The integration of digital platforms and ecosystems presents a significant opportunity in the working capital loan market by streamlining processes and enhancing accessibility. Digital platforms facilitate seamless loan application, approval, and disbursement processes, reducing paperwork and time. This efficiency attracts more small and medium-sized enterprises (SMEs) seeking quick and hassle-free access to capital.
- Ecosystems comprising fintech firms, banks, and non-banking financial companies (NBFCs) create a collaborative environment, expanding the reach and capabilities of each participant. Through APIs and digital interfaces, these ecosystems enable real-time data sharing and analytics, improving risk assessment and personalized loan offerings. This integration also supports alternative credit scoring models, incorporating non-traditional data sources to assess borrower creditworthiness, thus broadening the market to include underserved businesses. The digital ecosystems foster innovation, such as automated underwriting and blockchain for secure transactions, further enhancing transparency and trust. The resulting efficiencies and improved customer experience can lead to increased loan origination and higher market penetration, driving growth in the working capital loan market.
Working Capital Loan Market Segment Analysis:
Working Capital Loan Market Segmented on the basis of by Type, and by Application.
By Type, Banks segment is expected to dominate the market during the forecast period.
- Banks have remained the main source of working capital financing and can rely on large financial assets, experience of relationship with customers, and effective risk management tools. Some of the services they provide include versatile loan solutions for varied needs of the business. The financial industry as a whole and banks in particular are governed by very rigid regulatory measures with regards to safety and reliability. This regulatory supervision contributes to establishment of the level of confidence and trust in banks by the businesses whenever they are sourcing for the working capital loans.
- Due to the development of digitalization, fintechs and NBFIs are becoming more active participants in the working capital loan market offering more diversified and progressive terms. They can pull great volume of information using cutting edge technologies such as what is today known as Artificial Intelligence and Big data analysis to approve the loans in a faster and more efficient manner.
- Another reason is that NBFIs usually operate those specialized niches that are not very actively covered by the regular banks like for example small and medium enterprises (SMEs) and startups. Thus, due to the fact that these microfinance companies offer suitable loan products with less credit conditions appropriate for the need of these businesses.
By Application, Business segment held the largest share in 2023
- These loans focus on the daily expenses that businesses have when they need money especially if their cash inflows fluctuate. They are as follows – conventional term financing, financing by the line of credit, and factoring financing. Digital lenders are characterized by short time for loan processing which does not take more than 24 hours which is good for emergency.
- These are relatively rare and usually limited to people involved in micro-entrepreneurship or those with a sole proprietorship who requires cash for some business purpose. It can sometimes be accomplished through personal loans if they are used for business expenses, but they will most likely be different and charge higher rates than business related loans?.
- It is typical to avail working capital loans as short-term funds, and the maximum repayment time for such a loan is typically between a few months and a couple of years. As a short-term structure, it helps in covering gaps in cash flows in the business but can escalate the monthly costs.
- These loans can be used for a wide range of purposes such as working capital which includes payment of employee wages, rental costs, acquisition of inventory and other assorted costs. The openness also means that no stringent rules of usage of these funds are set allowing MSMEs to use them where most needed.
Working Capital Loan Market Regional Insights:
Working Capital Loan Market in North America is experiencing strong growth.
- Current global market conditions after the COVID-19 outbreak and subsequent economic recovery have increased the interest in working capital loans as organizations aim at restoration of their broken supply chains and overall functioning. Businesses require quick and easy access to funds to address the company expenses, and this also helps them to finance their expansion and development projects?.
- The access of the working capital loans has been enhanced by the increasing number of online lenders who offer more flexible and expedited opportunities, with lower numbers of direct qualifications. These lenders use efficient and fast methods of approving funds, and serve SMEs first and foremost as they can have difficulty in accessing bank financing?.
- Pertaining to working capital loans has grown tremendously over the years particularly within small and medium-sized businesses that are the powerhouse of the North American economy. This tendency is even more significant in industries that are more sensitive to cyclical fluctuations, namely the retail trade, manufacturing industry, and the service industry.
- There is a plethora of choices available out there in the market that is specific catering to the business credit requirements such as, line of credit, invoice financing, merchant cash advance, etc. These products suggest that businesses can opt for the financial product they require depending on their cash flow needs and their ability to repay the amount borrowed.
Active Key Players in the Working Capital Loan Market
- U.S. Bancorp (United States)
- Bank of America Corporation (United States)
- Wells Fargo & Company (United States)
- Citibank (United States)
- JPMorgan Chase & Co. (United States)
- BB&T (United States)
- PNC Financial Services Group Inc. (United States)
- Regions Financial Corporation (United States), and other Key players.
Working Capital Loan Market Key Industry
- In March 2024, Goldman Sachs launched the first ETF by Eagle Capital Management, an independent asset manager with over $25 billion in assets under management. The Eagle Capital Select Equity ETF furthers Eagle's concentrated, high-conviction strategy, developed with a fundamental value-oriented approach and a long-term investment horizon.
- In May 2023, JPMorgan Chase acquired the majority of First Republic Bank's assets and liabilities from the Federal Deposit Insurance Corporation (FDIC), supporting the U.S. financial system through its strong execution capabilities. The company assumes all insured and uninsured deposits as part of the transaction.
Global Working Capital Loan Market Scope:
|
Global Working Capital Loan Market |
|||
|
Base Year: |
2023 |
Forecast Period: |
2024-2032 |
|
Historical Data: |
2017 to 2023 |
Market Size in 2023: |
USD 1.38 Tn. |
|
Forecast Period 2024-32 CAGR: |
10.25% |
Market Size in 2032: |
USD 3.32 Tn. |
|
Segments Covered: |
By Type |
|
|
|
By Application |
|
||
|
By Region |
|
||
|
Key Market Drivers: |
|
||
|
Key Market Restraints: |
|
||
|
Key Opportunities: |
|
||
|
Companies Covered in the report: |
|
||
Chapter 1: Introduction
1.1 Scope and Coverage
Chapter 2:Executive Summary
Chapter 3: Market Landscape
3.1 Market Dynamics
3.1.1 Drivers
3.1.2 Restraints
3.1.3 Opportunities
3.1.4 Challenges
3.2 Market Trend Analysis
3.3 PESTLE Analysis
3.4 Porter's Five Forces Analysis
3.5 Industry Value Chain Analysis
3.6 Ecosystem
3.7 Regulatory Landscape
3.8 Price Trend Analysis
3.9 Patent Analysis
3.10 Technology Evolution
3.11 Investment Pockets
3.12 Import-Export Analysis
Chapter 4: Working Capital Loan Market by Type (2018-2032)
4.1 Working Capital Loan Market Snapshot and Growth Engine
4.2 Market Overview
4.3 Banks
4.3.1 Introduction and Market Overview
4.3.2 Historic and Forecasted Market Size in Value USD and Volume Units
4.3.3 Key Market Trends, Growth Factors, and Opportunities
4.3.4 Geographic Segmentation Analysis
4.4 Non-Banking Financial Institutions
Chapter 5: Working Capital Loan Market by Application (2018-2032)
5.1 Working Capital Loan Market Snapshot and Growth Engine
5.2 Market Overview
5.3 Business
5.3.1 Introduction and Market Overview
5.3.2 Historic and Forecasted Market Size in Value USD and Volume Units
5.3.3 Key Market Trends, Growth Factors, and Opportunities
5.3.4 Geographic Segmentation Analysis
5.4 Individuals
Chapter 6: Company Profiles and Competitive Analysis
6.1 Competitive Landscape
6.1.1 Competitive Benchmarking
6.1.2 Working Capital Loan Market Share by Manufacturer (2024)
6.1.3 Industry BCG Matrix
6.1.4 Heat Map Analysis
6.1.5 Mergers and Acquisitions
6.2 ALTAIR ENGINEERING INC. (U.S.)
6.2.1 Company Overview
6.2.2 Key Executives
6.2.3 Company Snapshot
6.2.4 Role of the Company in the Market
6.2.5 Sustainability and Social Responsibility
6.2.6 Operating Business Segments
6.2.7 Product Portfolio
6.2.8 Business Performance
6.2.9 Key Strategic Moves and Recent Developments
6.2.10 SWOT Analysis
6.3 THE MATHWORKS INC. (U.S.)
6.4 AUTODESK INC. (U.S.)
6.5 CYBERNET SYSTEMS CORPORATION (U.S.)
6.6 BENTLEY SYSTEMS INCORPORATED (U.S.)
6.7 PTC INC. (U.S.)
6.8 CPFD SOFTWARE LLC (U.S.)
6.9 DESIGN SIMULATION TECHNOLOGIES INC. (U.S.)
6.10 SYNOPSYS INC. (U.S.)
6.11 ANSYS INC. (U.S.)
6.12 SIMIO LLC (U.S.)
6.13 COMSOL (U.S.)
6.14 ROCKWELL AUTOMATION INC. (U.S.)
6.15 SOLIDWORKS CORPORATION (U.S.)
6.16 SIEMENS AG (GERMANY)
6.17 DASSAULT SYSTE?MES SE (FRANCE)
6.18 SCHNEIDER ELECTRIC SE (FRANCE)
6.19 LANNER GROUP LIMITED (UK)
6.20 SIMUL8 CORPORATION (UK)
6.21 CONSELF SRL (ITALY)
6.22
Chapter 7: Global Working Capital Loan Market By Region
7.1 Overview
7.2. North America Working Capital Loan Market
7.2.1 Key Market Trends, Growth Factors and Opportunities
7.2.2 Top Key Companies
7.2.3 Historic and Forecasted Market Size by Segments
7.2.4 Historic and Forecasted Market Size by Type
7.2.4.1 Banks
7.2.4.2 Non-Banking Financial Institutions
7.2.5 Historic and Forecasted Market Size by Application
7.2.5.1 Business
7.2.5.2 Individuals
7.2.6 Historic and Forecast Market Size by Country
7.2.6.1 US
7.2.6.2 Canada
7.2.6.3 Mexico
7.3. Eastern Europe Working Capital Loan Market
7.3.1 Key Market Trends, Growth Factors and Opportunities
7.3.2 Top Key Companies
7.3.3 Historic and Forecasted Market Size by Segments
7.3.4 Historic and Forecasted Market Size by Type
7.3.4.1 Banks
7.3.4.2 Non-Banking Financial Institutions
7.3.5 Historic and Forecasted Market Size by Application
7.3.5.1 Business
7.3.5.2 Individuals
7.3.6 Historic and Forecast Market Size by Country
7.3.6.1 Russia
7.3.6.2 Bulgaria
7.3.6.3 The Czech Republic
7.3.6.4 Hungary
7.3.6.5 Poland
7.3.6.6 Romania
7.3.6.7 Rest of Eastern Europe
7.4. Western Europe Working Capital Loan Market
7.4.1 Key Market Trends, Growth Factors and Opportunities
7.4.2 Top Key Companies
7.4.3 Historic and Forecasted Market Size by Segments
7.4.4 Historic and Forecasted Market Size by Type
7.4.4.1 Banks
7.4.4.2 Non-Banking Financial Institutions
7.4.5 Historic and Forecasted Market Size by Application
7.4.5.1 Business
7.4.5.2 Individuals
7.4.6 Historic and Forecast Market Size by Country
7.4.6.1 Germany
7.4.6.2 UK
7.4.6.3 France
7.4.6.4 The Netherlands
7.4.6.5 Italy
7.4.6.6 Spain
7.4.6.7 Rest of Western Europe
7.5. Asia Pacific Working Capital Loan Market
7.5.1 Key Market Trends, Growth Factors and Opportunities
7.5.2 Top Key Companies
7.5.3 Historic and Forecasted Market Size by Segments
7.5.4 Historic and Forecasted Market Size by Type
7.5.4.1 Banks
7.5.4.2 Non-Banking Financial Institutions
7.5.5 Historic and Forecasted Market Size by Application
7.5.5.1 Business
7.5.5.2 Individuals
7.5.6 Historic and Forecast Market Size by Country
7.5.6.1 China
7.5.6.2 India
7.5.6.3 Japan
7.5.6.4 South Korea
7.5.6.5 Malaysia
7.5.6.6 Thailand
7.5.6.7 Vietnam
7.5.6.8 The Philippines
7.5.6.9 Australia
7.5.6.10 New Zealand
7.5.6.11 Rest of APAC
7.6. Middle East & Africa Working Capital Loan Market
7.6.1 Key Market Trends, Growth Factors and Opportunities
7.6.2 Top Key Companies
7.6.3 Historic and Forecasted Market Size by Segments
7.6.4 Historic and Forecasted Market Size by Type
7.6.4.1 Banks
7.6.4.2 Non-Banking Financial Institutions
7.6.5 Historic and Forecasted Market Size by Application
7.6.5.1 Business
7.6.5.2 Individuals
7.6.6 Historic and Forecast Market Size by Country
7.6.6.1 Turkiye
7.6.6.2 Bahrain
7.6.6.3 Kuwait
7.6.6.4 Saudi Arabia
7.6.6.5 Qatar
7.6.6.6 UAE
7.6.6.7 Israel
7.6.6.8 South Africa
7.7. South America Working Capital Loan Market
7.7.1 Key Market Trends, Growth Factors and Opportunities
7.7.2 Top Key Companies
7.7.3 Historic and Forecasted Market Size by Segments
7.7.4 Historic and Forecasted Market Size by Type
7.7.4.1 Banks
7.7.4.2 Non-Banking Financial Institutions
7.7.5 Historic and Forecasted Market Size by Application
7.7.5.1 Business
7.7.5.2 Individuals
7.7.6 Historic and Forecast Market Size by Country
7.7.6.1 Brazil
7.7.6.2 Argentina
7.7.6.3 Rest of SA
Chapter 8 Analyst Viewpoint and Conclusion
8.1 Recommendations and Concluding Analysis
8.2 Potential Market Strategies
Chapter 9 Research Methodology
9.1 Research Process
9.2 Primary Research
9.3 Secondary Research
Global Working Capital Loan Market Scope:
|
Global Working Capital Loan Market |
|||
|
Base Year: |
2023 |
Forecast Period: |
2024-2032 |
|
Historical Data: |
2017 to 2023 |
Market Size in 2023: |
USD 1.38 Tn. |
|
Forecast Period 2024-32 CAGR: |
10.25% |
Market Size in 2032: |
USD 3.32 Tn. |
|
Segments Covered: |
By Type |
|
|
|
By Application |
|
||
|
By Region |
|
||
|
Key Market Drivers: |
|
||
|
Key Market Restraints: |
|
||
|
Key Opportunities: |
|
||
|
Companies Covered in the report: |
|
||


