


Green Walls Market Synopsis
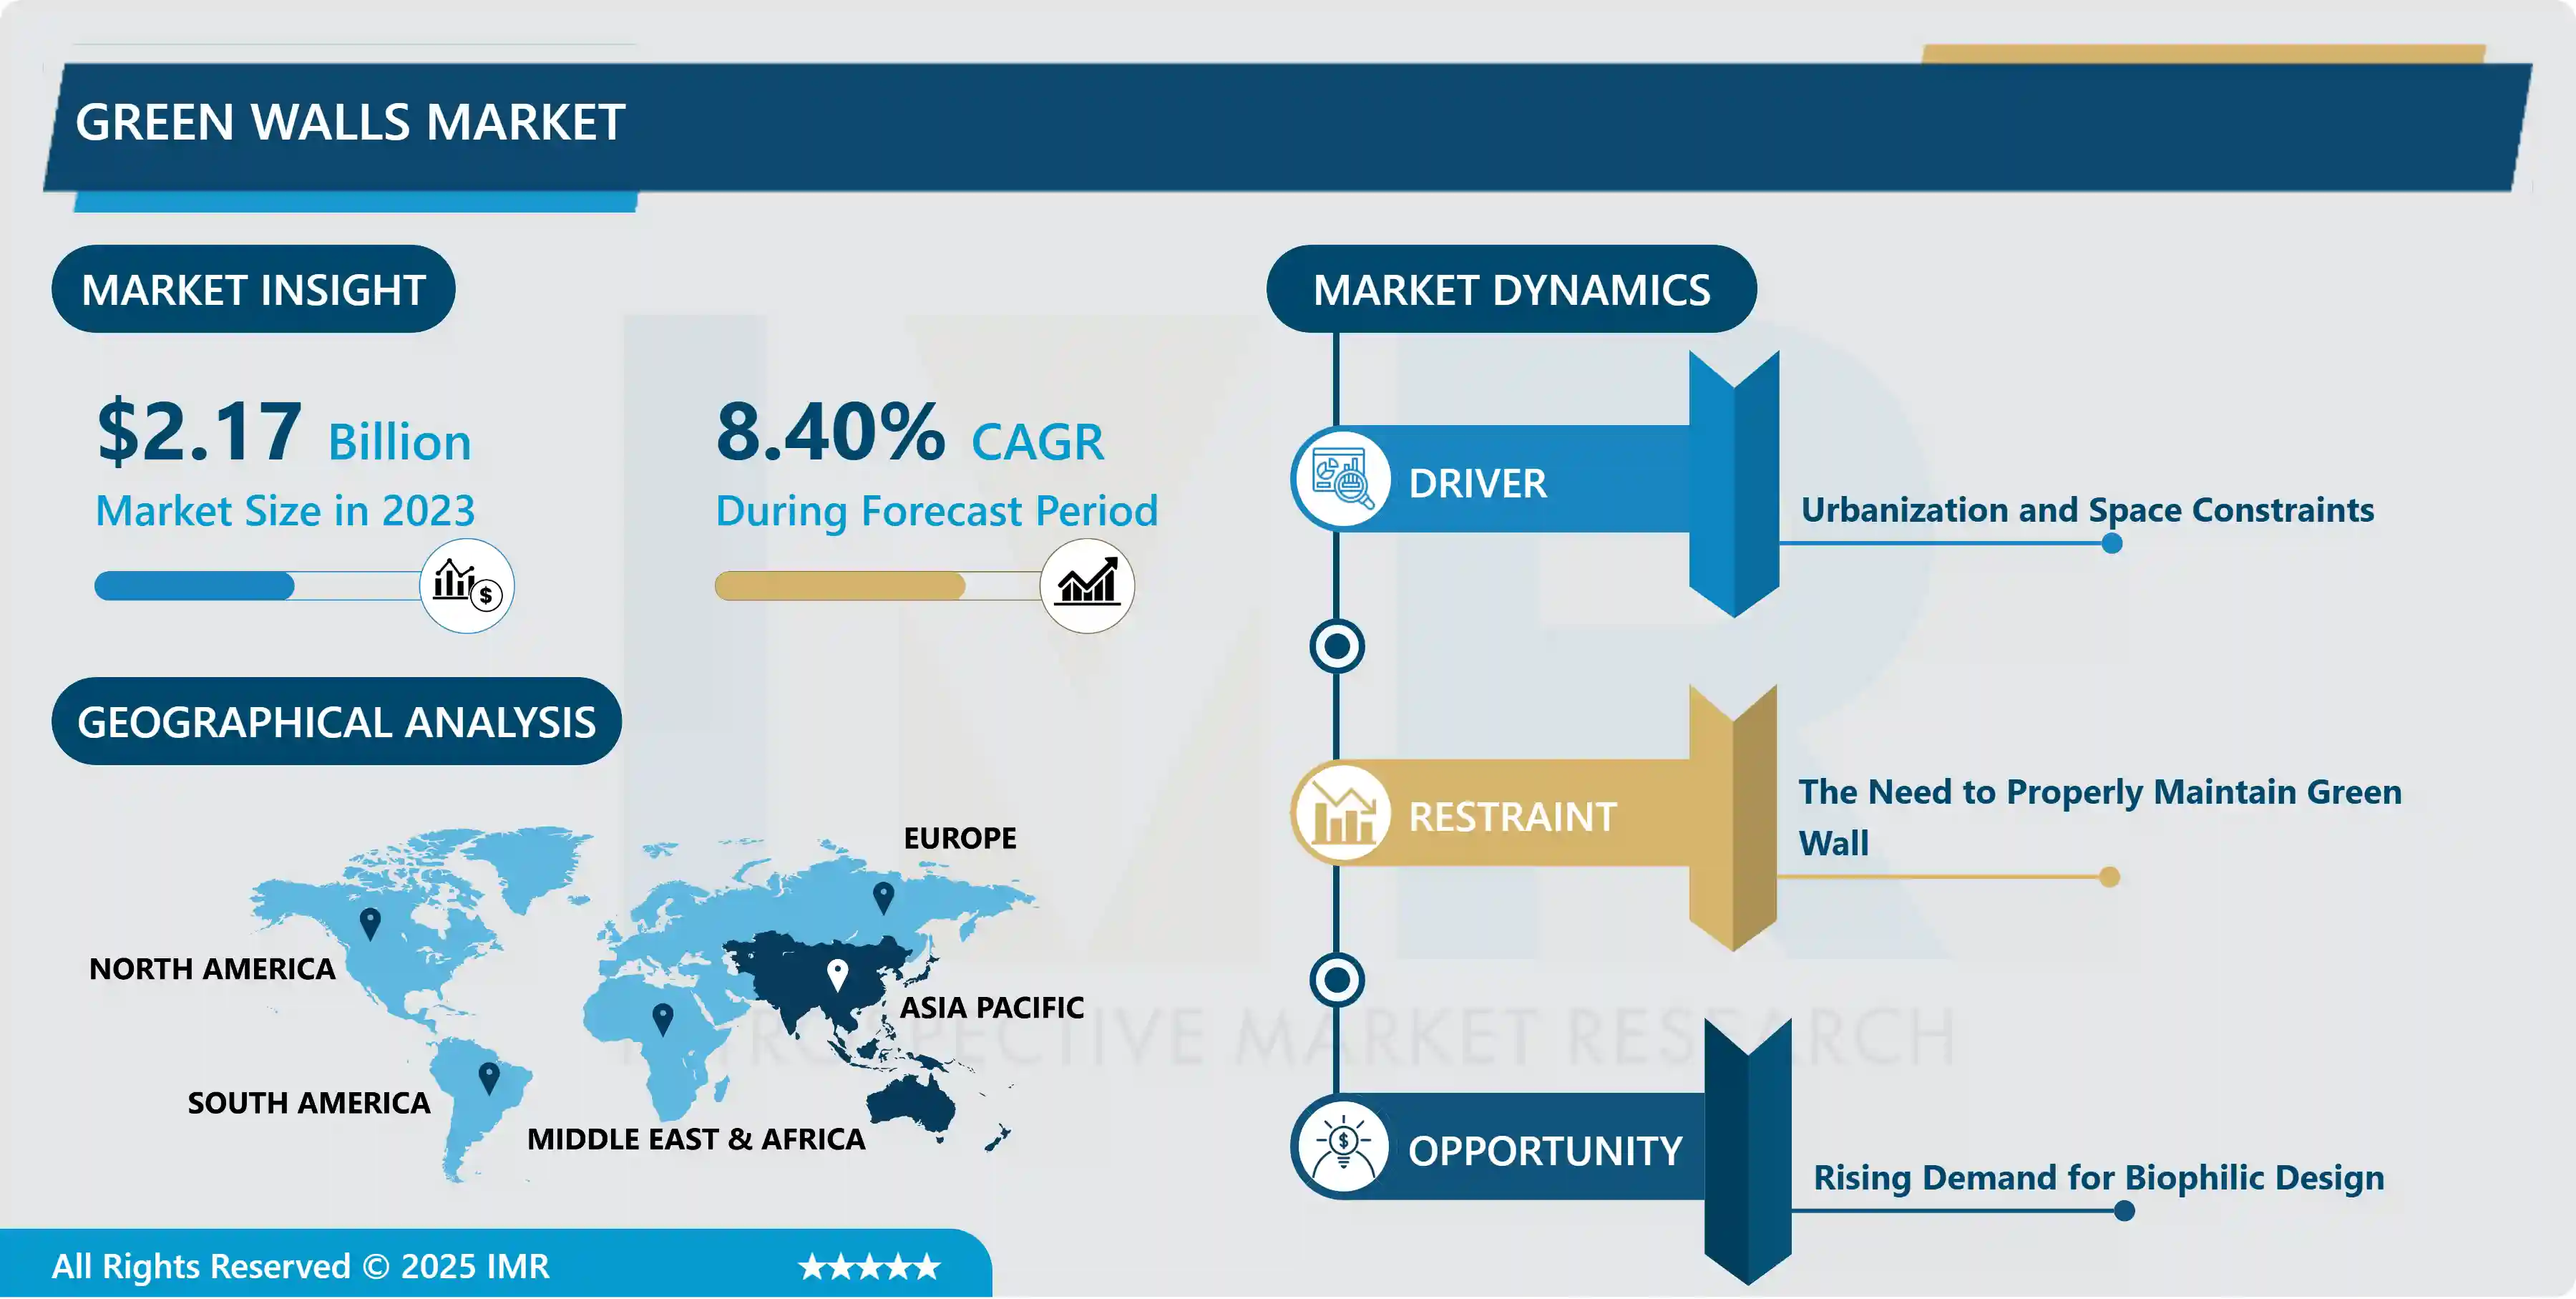
Global Green Walls Market size is expected to grow from USD 2.17 Billion in 2023 to USD 4.48 Billion by 2032, at a CAGR of 8.40% during the forecast period (2024-2032).
Green walls also referred to as living walls or vertical gardens, are vertical structures adorned with live plants, providing a sustainable and aesthetically pleasing solution for both indoor and outdoor spaces.
These structures are purposefully crafted to nurture vegetation, turning ordinary surfaces into vibrant showcases of nature. Within indoor environments, green walls elevate the visual appeal of spaces such as offices, residences, and commercial establishments, imparting a rejuvenating and tranquil atmosphere.
The applications of green walls are multifaceted, reaching across various sectors. In commercial settings, they function as branding elements, enhancing the overall atmosphere of shopping centers, hotels, and dining establishments. In the realm of healthcare, green walls are incorporated for their potential therapeutic advantages, positively impacting patient well-being. Beyond their aesthetic contributions, green walls offer environmental benefits, serving as natural air purifiers and encouraging biodiversity. They actively support sustainability initiatives by mitigating the urban heat island effect and improving energy efficiency in buildings. As society increasingly prioritizes eco-friendly practices and biophilic design, green walls emerge as a harmonious synthesis of beauty and environmental mindfulness, fostering healthier and more sustainable living and working environments.

Green Walls Market Trend Analysis:
Urbanization and Space Constraints
- Urbanization and space constraints are key drivers propelling the expansion of the green walls market. With cities globally undergoing rapid urbanization, the demand for innovative solutions to address the environmental and aesthetic challenges posed by dense urban landscapes has grown significantly. Green walls, characterized by their vertical orientation, provide an effective solution to space limitations by efficiently utilizing vertical surfaces in both indoor and outdoor settings. Particularly in urban environments marked by high-rise structures and limited ground space, green walls play a pivotal role, transforming bare walls into vibrant, verdant spaces. This transformation not only enhances the visual appeal of urban areas but also contributes to the overall well-being of residents.
- Furthermore, the increasing emphasis on sustainable practices in response to urban expansion has heightened the significance of green walls. These structures serve as a means of urban greening, mitigating the negative impacts of concrete-heavy cityscapes by introducing greenery into the built environment. Beyond their aesthetic contributions, green walls function as natural air purifiers, positively impacting air quality in densely populated areas. The integration of green walls into urban planning aligns with the global trend toward eco-friendly and resilient urban spaces. In essence, the growth of the green walls market is closely connected to the challenges presented by urbanization, offering a harmonious solution that addresses spatial limitations while contributing to the creation of sustainable and livable cities.
Rising Demand for Biophilic Design
- The increasing demand for biophilic design creates a substantial growth opportunity for the green walls market. With growing awareness of the positive effects of nature on human well-being, the incorporation of biophilic elements into design has become a prominent trend across various industries. Green walls, featuring live plants and natural elements, align seamlessly with the principles of biophilic design, aiming to reconnect individuals with the natural environment within constructed spaces.
- The surge in biophilic design demand is fueled by a longing to establish environments that cultivate a connection with nature, even in urban settings. Green walls provide a practical and aesthetically pleasing solution to introduce the calming and rejuvenating effects of nature into interiors and exteriors. This is especially relevant in workplaces, healthcare facilities, and commercial spaces, where the increasingly recognized positive impact of biophilic elements extends to productivity, well-being, and customer experience.
- Architects, designers, and businesses are leveraging the advantages of integrating green walls as integral components of biophilic design strategies. Beyond their visual appeal, these living walls contribute to enhanced air quality, decreased stress levels, and overall improved occupant satisfaction. With the rising demand for environments that prioritize sustainability and well-being, the green walls market is well-positioned to capitalize on the opportunity presented by the growing popularity of biophilic design across diverse sectors.
Green Walls Market Segment Analysis:
Green Walls Market is Segmented Based on By Type, Medium, Material, Application, and End-User
By Application, Outdoor Segment Is Expected to Dominate the Market During the Forecast Period
- The dominance of the outdoor segment is anticipated in the green walls market, indicative of the growing preference for exterior applications across diverse settings. With escalating urbanization and diminishing green spaces, outdoor green walls emerge as a compelling solution to introduce nature into densely populated areas. These walls not only enhance the visual appeal of building exteriors, public spaces, and landscapes but also contribute significantly to urban greening initiatives.
- The prominence of the outdoor segment is further driven by the increasing acknowledgment of the environmental advantages offered by green walls, including air purification and temperature regulation. Furthermore, the incorporation of outdoor green walls in commercial spaces, hospitality establishments, and residential projects underscores the rising demand for sustainable and visually captivating solutions, affirming the outdoor segment's leading position in the continually expanding green walls market
By Medium, Mat Segment Held the Largest Share of 44.36% In 2022
- The mat segment holds the largest share of the green walls market, underscoring its profound impact on the industry. Mats, commonly employed as the foundational element for green wall installations, play a pivotal role in providing support and fostering vertical plant growth. The dominance of this segment can be attributed to the versatile and scalable nature of mat-based systems, facilitating easy customization and adaptation to diverse environments. Mat usage offers a pragmatic and effective solution for establishing green walls in both indoor and outdoor settings, providing a stable foundation for plant growth and ensuring optimal irrigation. The widespread popularity of mat-based systems is further driven by their straightforward installation, making them accessible for a broad spectrum of applications, ranging from residential homes to expansive commercial projects.
- With an increasing emphasis on sustainability and eco-friendly practices, the mat segment's significant market share reflects a preference for green wall solutions that not only enhance aesthetics but also contribute to environmental well-being. The adaptability and efficiency of mat-based systems position them as a fundamental component in the green walls market, meeting the varied requirements of architects, designers, and property owners in search of sustainable and visually appealing solutions.
Green Walls Market Regional Insights:
Asia Pacific is Expected to Dominate the Market Over the Forecast Period
- The Asia Pacific region is poised to dominate the green walls market in the foreseeable future, establishing a substantial regional influence. This anticipated growth can be attributed to a convergence of factors, including swift urbanization, heightened awareness of environmental sustainability, and an increasing focus on creating visually appealing urban landscapes. The escalating population and expanding urban areas in the region have fueled a demand for innovative solutions that address spatial constraints and enhance greenery in constructed environments. Countries like China, India, and Singapore are experiencing a notable uptick in green infrastructure projects, with green walls playing a pivotal role in reshaping cityscapes.
- Furthermore, governmental initiatives that champion sustainable urban development contribute significantly to the widespread adoption of green walls. The expected dominance of the Asia Pacific in the green walls market underscores the region's dedication to fostering sustainable, visually captivating, and eco-friendly living and working environments.
Key Players Covered in Green Walls Market:
- Gsky Plant Systems (U.S.)
- Greenworks (U.S.)
- Moss Trend (U.S.)
- Ambius, Inc. (U.S.)
- Greenscreen (U.S.)
- Sagegreenlife (U.S.)
- Livewall, LLC (U.S.)
- Nedlaw Living Walls (Canada)
- Sacndia Moss (Spain)
- Suiteplants (Spain)
- Artaqua (Spain)
- Meamea (Spain)
- Bynaturedesign (France)
- Déco Végétale (France)
- Sempergreen (Nerthelands)
- Ans Group Global Ltd (UK)
- Biotecture Ltd. (UK)
- Greenblue Urban Ltd (UK)
- The Greenwall Company (Australia)
- Fytogreen Pty Ltd (Australia)
- ELT India (India), and Other Major Players.
Key Industry Developments
- In March 2023, Union Minister for Environment, Forest and Climate Change Bhupender Yadav launched the Aravalli Green Wall Project, a major initiative to increase green cover in the 5 km buffer area around the Aravalli Hill Range in four states at a function organized to celebrate the International Day of Forests at Tikli Village in Haryana.
- In September 2023, ADM Landscape Corporation, a leading landscaping firm, introduced the Freedom series of portable green walls to commercial landlords and tenants in the greater New York metro area. The series features three models: the wall-hanging "Anywhere" and "Designer," and the free-standing "Uno." Designed for flexibility and low maintenance, they come with programmable lighting systems. These green walls improve indoor air quality, offer a calming effect, and can act as natural privacy barriers.
|
Global Green Walls Market |
|||
|
Base Year: |
2023 |
Forecast Period: |
2024-2032 |
|
Historical Data: |
2017 to 2023 |
Market Size in 2023: |
USD 2.17 Bn. |
|
Forecast Period 2024-32 CAGR: |
8.40 % |
Market Size in 2032: |
USD 4.48 Bn. |
|
Segments Covered: |
By Type |
|
|
|
By Medium |
|
||
|
By Application |
|
||
|
By End-User |
|
||
|
By Region |
|
||
|
Key Market Drivers: |
|
||
|
Key Market Restraints: |
|
||
|
Key Opportunities: |
|
||
|
Companies Covered in the report: |
|
||
Chapter 1: Introduction
1.1 Scope and Coverage
Chapter 2:Executive Summary
Chapter 3: Market Landscape
3.1 Market Dynamics
3.1.1 Drivers
3.1.2 Restraints
3.1.3 Opportunities
3.1.4 Challenges
3.2 Market Trend Analysis
3.3 PESTLE Analysis
3.4 Porter's Five Forces Analysis
3.5 Industry Value Chain Analysis
3.6 Ecosystem
3.7 Regulatory Landscape
3.8 Price Trend Analysis
3.9 Patent Analysis
3.10 Technology Evolution
3.11 Investment Pockets
3.12 Import-Export Analysis
Chapter 4: Green Walls Market by Type (2018-2032)
4.1 Green Walls Market Snapshot and Growth Engine
4.2 Market Overview
4.3 Soil-less
4.3.1 Introduction and Market Overview
4.3.2 Historic and Forecasted Market Size in Value USD and Volume Units
4.3.3 Key Market Trends, Growth Factors, and Opportunities
4.3.4 Geographic Segmentation Analysis
4.4 Soil-based
Chapter 5: Green Walls Market by Medium (2018-2032)
5.1 Green Walls Market Snapshot and Growth Engine
5.2 Market Overview
5.3 Loose growth
5.3.1 Introduction and Market Overview
5.3.2 Historic and Forecasted Market Size in Value USD and Volume Units
5.3.3 Key Market Trends, Growth Factors, and Opportunities
5.3.4 Geographic Segmentation Analysis
5.4 Mat
5.5 Sheet
5.6 Structural
Chapter 6: Green Walls Market by Application (2018-2032)
6.1 Green Walls Market Snapshot and Growth Engine
6.2 Market Overview
6.3 Indoor
6.3.1 Introduction and Market Overview
6.3.2 Historic and Forecasted Market Size in Value USD and Volume Units
6.3.3 Key Market Trends, Growth Factors, and Opportunities
6.3.4 Geographic Segmentation Analysis
6.4 Outdoor
Chapter 7: Green Walls Market by End-User (2018-2032)
7.1 Green Walls Market Snapshot and Growth Engine
7.2 Market Overview
7.3 Office Space
7.3.1 Introduction and Market Overview
7.3.2 Historic and Forecasted Market Size in Value USD and Volume Units
7.3.3 Key Market Trends, Growth Factors, and Opportunities
7.3.4 Geographic Segmentation Analysis
7.4 Hospitals
7.5 Residential
7.6 Landscaping
7.7 Hotels & Restaurants
7.8 Public Spaces
Chapter 8: Company Profiles and Competitive Analysis
8.1 Competitive Landscape
8.1.1 Competitive Benchmarking
8.1.2 Green Walls Market Share by Manufacturer (2024)
8.1.3 Industry BCG Matrix
8.1.4 Heat Map Analysis
8.1.5 Mergers and Acquisitions
8.2 LIVEPERSON (UNITED STATES)
8.2.1 Company Overview
8.2.2 Key Executives
8.2.3 Company Snapshot
8.2.4 Role of the Company in the Market
8.2.5 Sustainability and Social Responsibility
8.2.6 Operating Business Segments
8.2.7 Product Portfolio
8.2.8 Business Performance
8.2.9 Key Strategic Moves and Recent Developments
8.2.10 SWOT Analysis
8.3 AMAZON LEX (UNITED STATES)
8.4 APPLE (UNITED STATES)
8.5 IBM WATSON (UNITED STATES)
8.6 GOOGLE (UNITED STATES)
8.7 PAYPAL (UNITED STATES)
8.8 LIVECHAT (POLAND)
8.9 KASISTO (UNITED STATES)
8.10 WECHAT (CHINA)
8.11 ALIPAY (CHINA)
8.12 OTHERS ACTIVE PLAYERS
Chapter 9: Global Green Walls Market By Region
9.1 Overview
9.2. North America Green Walls Market
9.2.1 Key Market Trends, Growth Factors and Opportunities
9.2.2 Top Key Companies
9.2.3 Historic and Forecasted Market Size by Segments
9.2.4 Historic and Forecasted Market Size by Type
9.2.4.1 Soil-less
9.2.4.2 Soil-based
9.2.5 Historic and Forecasted Market Size by Medium
9.2.5.1 Loose growth
9.2.5.2 Mat
9.2.5.3 Sheet
9.2.5.4 Structural
9.2.6 Historic and Forecasted Market Size by Application
9.2.6.1 Indoor
9.2.6.2 Outdoor
9.2.7 Historic and Forecasted Market Size by End-User
9.2.7.1 Office Space
9.2.7.2 Hospitals
9.2.7.3 Residential
9.2.7.4 Landscaping
9.2.7.5 Hotels & Restaurants
9.2.7.6 Public Spaces
9.2.8 Historic and Forecast Market Size by Country
9.2.8.1 US
9.2.8.2 Canada
9.2.8.3 Mexico
9.3. Eastern Europe Green Walls Market
9.3.1 Key Market Trends, Growth Factors and Opportunities
9.3.2 Top Key Companies
9.3.3 Historic and Forecasted Market Size by Segments
9.3.4 Historic and Forecasted Market Size by Type
9.3.4.1 Soil-less
9.3.4.2 Soil-based
9.3.5 Historic and Forecasted Market Size by Medium
9.3.5.1 Loose growth
9.3.5.2 Mat
9.3.5.3 Sheet
9.3.5.4 Structural
9.3.6 Historic and Forecasted Market Size by Application
9.3.6.1 Indoor
9.3.6.2 Outdoor
9.3.7 Historic and Forecasted Market Size by End-User
9.3.7.1 Office Space
9.3.7.2 Hospitals
9.3.7.3 Residential
9.3.7.4 Landscaping
9.3.7.5 Hotels & Restaurants
9.3.7.6 Public Spaces
9.3.8 Historic and Forecast Market Size by Country
9.3.8.1 Russia
9.3.8.2 Bulgaria
9.3.8.3 The Czech Republic
9.3.8.4 Hungary
9.3.8.5 Poland
9.3.8.6 Romania
9.3.8.7 Rest of Eastern Europe
9.4. Western Europe Green Walls Market
9.4.1 Key Market Trends, Growth Factors and Opportunities
9.4.2 Top Key Companies
9.4.3 Historic and Forecasted Market Size by Segments
9.4.4 Historic and Forecasted Market Size by Type
9.4.4.1 Soil-less
9.4.4.2 Soil-based
9.4.5 Historic and Forecasted Market Size by Medium
9.4.5.1 Loose growth
9.4.5.2 Mat
9.4.5.3 Sheet
9.4.5.4 Structural
9.4.6 Historic and Forecasted Market Size by Application
9.4.6.1 Indoor
9.4.6.2 Outdoor
9.4.7 Historic and Forecasted Market Size by End-User
9.4.7.1 Office Space
9.4.7.2 Hospitals
9.4.7.3 Residential
9.4.7.4 Landscaping
9.4.7.5 Hotels & Restaurants
9.4.7.6 Public Spaces
9.4.8 Historic and Forecast Market Size by Country
9.4.8.1 Germany
9.4.8.2 UK
9.4.8.3 France
9.4.8.4 The Netherlands
9.4.8.5 Italy
9.4.8.6 Spain
9.4.8.7 Rest of Western Europe
9.5. Asia Pacific Green Walls Market
9.5.1 Key Market Trends, Growth Factors and Opportunities
9.5.2 Top Key Companies
9.5.3 Historic and Forecasted Market Size by Segments
9.5.4 Historic and Forecasted Market Size by Type
9.5.4.1 Soil-less
9.5.4.2 Soil-based
9.5.5 Historic and Forecasted Market Size by Medium
9.5.5.1 Loose growth
9.5.5.2 Mat
9.5.5.3 Sheet
9.5.5.4 Structural
9.5.6 Historic and Forecasted Market Size by Application
9.5.6.1 Indoor
9.5.6.2 Outdoor
9.5.7 Historic and Forecasted Market Size by End-User
9.5.7.1 Office Space
9.5.7.2 Hospitals
9.5.7.3 Residential
9.5.7.4 Landscaping
9.5.7.5 Hotels & Restaurants
9.5.7.6 Public Spaces
9.5.8 Historic and Forecast Market Size by Country
9.5.8.1 China
9.5.8.2 India
9.5.8.3 Japan
9.5.8.4 South Korea
9.5.8.5 Malaysia
9.5.8.6 Thailand
9.5.8.7 Vietnam
9.5.8.8 The Philippines
9.5.8.9 Australia
9.5.8.10 New Zealand
9.5.8.11 Rest of APAC
9.6. Middle East & Africa Green Walls Market
9.6.1 Key Market Trends, Growth Factors and Opportunities
9.6.2 Top Key Companies
9.6.3 Historic and Forecasted Market Size by Segments
9.6.4 Historic and Forecasted Market Size by Type
9.6.4.1 Soil-less
9.6.4.2 Soil-based
9.6.5 Historic and Forecasted Market Size by Medium
9.6.5.1 Loose growth
9.6.5.2 Mat
9.6.5.3 Sheet
9.6.5.4 Structural
9.6.6 Historic and Forecasted Market Size by Application
9.6.6.1 Indoor
9.6.6.2 Outdoor
9.6.7 Historic and Forecasted Market Size by End-User
9.6.7.1 Office Space
9.6.7.2 Hospitals
9.6.7.3 Residential
9.6.7.4 Landscaping
9.6.7.5 Hotels & Restaurants
9.6.7.6 Public Spaces
9.6.8 Historic and Forecast Market Size by Country
9.6.8.1 Turkiye
9.6.8.2 Bahrain
9.6.8.3 Kuwait
9.6.8.4 Saudi Arabia
9.6.8.5 Qatar
9.6.8.6 UAE
9.6.8.7 Israel
9.6.8.8 South Africa
9.7. South America Green Walls Market
9.7.1 Key Market Trends, Growth Factors and Opportunities
9.7.2 Top Key Companies
9.7.3 Historic and Forecasted Market Size by Segments
9.7.4 Historic and Forecasted Market Size by Type
9.7.4.1 Soil-less
9.7.4.2 Soil-based
9.7.5 Historic and Forecasted Market Size by Medium
9.7.5.1 Loose growth
9.7.5.2 Mat
9.7.5.3 Sheet
9.7.5.4 Structural
9.7.6 Historic and Forecasted Market Size by Application
9.7.6.1 Indoor
9.7.6.2 Outdoor
9.7.7 Historic and Forecasted Market Size by End-User
9.7.7.1 Office Space
9.7.7.2 Hospitals
9.7.7.3 Residential
9.7.7.4 Landscaping
9.7.7.5 Hotels & Restaurants
9.7.7.6 Public Spaces
9.7.8 Historic and Forecast Market Size by Country
9.7.8.1 Brazil
9.7.8.2 Argentina
9.7.8.3 Rest of SA
Chapter 10 Analyst Viewpoint and Conclusion
10.1 Recommendations and Concluding Analysis
10.2 Potential Market Strategies
Chapter 11 Research Methodology
11.1 Research Process
11.2 Primary Research
11.3 Secondary Research
|
Global Green Walls Market |
|||
|
Base Year: |
2023 |
Forecast Period: |
2024-2032 |
|
Historical Data: |
2017 to 2023 |
Market Size in 2023: |
USD 2.17 Bn. |
|
Forecast Period 2024-32 CAGR: |
8.40 % |
Market Size in 2032: |
USD 4.48 Bn. |
|
Segments Covered: |
By Type |
|
|
|
By Medium |
|
||
|
By Application |
|
||
|
By End-User |
|
||
|
By Region |
|
||
|
Key Market Drivers: |
|
||
|
Key Market Restraints: |
|
||
|
Key Opportunities: |
|
||
|
Companies Covered in the report: |
|
||


