


Feed Additives Market Synopsis
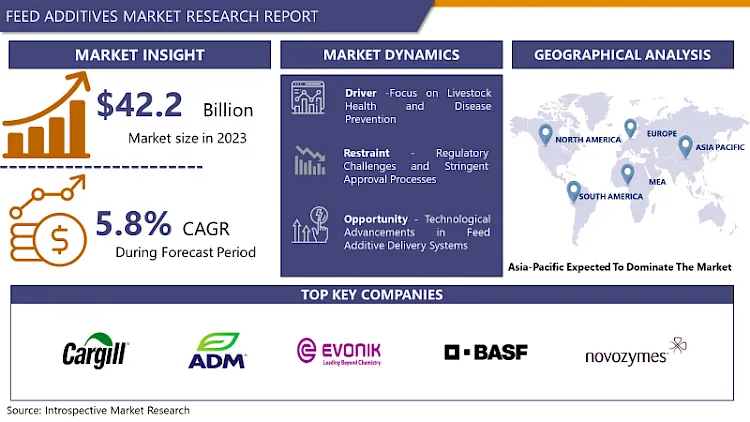
Feed Additives Market Size Was Valued at USD 44.65 Billion in 2024, and is Projected to Reach USD 70.1 Billion by 2032, Growing at a CAGR of 5.8% From 2025-2032.
Feed additives are substances incorporated into animal feed to improve its nutritional value, enhance animal health, and optimize production efficiency. These additives can include vitamins, minerals, amino acids, enzymes, probiotics, prebiotics, antioxidants, and growth promoters. They are used to address specific dietary deficiencies, enhance digestion, boost immunity, and promote growth in livestock, poultry, and aquaculture. Additionally, feed additives can help mitigate the negative effects of stress and disease, contributing to overall animal welfare and performance.
The Feed Additives market is an important sub-sector in the global agriculture market for animal production animals that has significant importance in the improvement of performance and production efficiency. Animal feed supplements are intervention compounds that are added to the feed with a view to supplement nutrients, support the health status of animals and boost production. These are Vitamins, minerals, amino acids, enzymes, Probiotics, prebiotics, and other compounds depending on the needs of the animal.
Feed additives market has grown abundant traction due to the increasing requirement of animal protein across the global market. This paper will discuss how population pressure puts pressure on the production of meat, dairy, and eggs as the world population increases. The result is that producers have shifted attention towards enhancing the performance of animal produced in order to feed the increasing population while at the same time reducing the negative effects on the environment. Feed additives can provide practical and effective means of improving feed conversion and animal health while at the same time lowering the environmental impact of meat production systems for cattle and poultry.
Furthermore, the consumer awareness about the quality, safety, and sustainability of the food products consumed has also been on the rise; this has further led to the demand for feed additives. People want products from animals raised for consumption in a proper and proper way that would not be a threat to their safety and health. These objectives can be achieved through the use of feed additives that EA has an interest in since they help to promote the health of the animals and reduce the use of antibiotics and other chemicals while improving the quality of animal products to consumers.
Besides, demand generation, growth in feed additives industry is also conditioned by technological development and innovations. Feed additives remained a dynamic sector of production as manufacturers work on new formulations and delivery forms to enhance feed efficacy and digestibility. This consists of, for example, microencapsulation to protect ingredients from degradation in the gastrointestinal tract, and to improve their bioavailability in the body through particles of nano- and micro-sizes for maximized delivery of nutrients to animals.
However, there are certain challenges that are seen in the feed additives market and there are certain constraints as well. There has been growing awareness of the regulatory policies and laws that govern the consumption of various foods and addenda such as the use of antibiotics and growth promoters in feeding the animals. The controversies surrounding the use of antimicrobial, susceptibility of livestock to diseases and potential harm to human health, the use and incorporation of such additives into animal feed has been prohibited or restricted. Regulatory requirements: The regulation of feed additives is a crucial and complex matter for manufacturers as it shapes the development of novel products that are both safe and efficient for animals.
Manufacturers are also required to assess and operate in these regulatory environments and at the same time they are pressed to constantly search for new feed additive solutions.In addition, various issues such as high cost of raw materials in addition to changes in the price of commodities act as risks to feed additive manufacturers. Fluctuations of feed ingredients can affect profits and the prices that firms set for their products; therefore, it calls for sound procurement standards and innovative supply chain systems to enshrine.
However, there is still considerable potential for the further development of the feed additives market; the need for animal protein, spread awareness of food hygiene and diet safety, innovative technologies and other factors also remain positive. Over time, the feed additives market is expected to stabilize, but it will require cooperation between manufacturers, regulators, producers, and consumers to support its expansion.
.webp)
Feed Additives Market Trend Analysis
Rising Demand for Natural and Sustainable Feed Additives
- The feed additives market is seeing a trend with a higher inclination towards natural as well as eco-friendly products due to a growing consciousness among the consumers and stringent rules within the industry. Thus, as the consciousness regarding the effects of maximum tillage and growing concerns towards the quality and health impacts of the biochemical additives the farmers and the feed producing companies are in search for the alternation. Key natural feed additives administered from plant s?, essential oil and probiotics have been increasingly used for pelleted feeds because of their perceived benefits. Consumers are coming up with more demands for information and analysis in the chains of food production, thus driving key stakeholders to adopt sustainable strategies and quality products that meet these expectations. Therefore, it can be expected that the market for natural and sustainable feed additives will experience consistent and further growth in the future years.
- The laws of almost all countries around the world are putting more strict measures on the use of synthetic additives in animal feed making people to turning to natural ones. Animal farming to a large extent has shifted from using traditional antibiotic agents due to Concerns over consumer preferences indicate that they have embraced a more health conscious lifestyle geared toward occasioning a decrease in antibiotic use. Moreover, it is worth mentioning that modern technologies and studies allow the usage of innovative natural additives that can positively affect the organism of animals, enriches feed factor, and decreases the negative influence on the environment. The search for natural and sustainable feed additives is escalating and multiple companies are strengthening their research to develop solutions that meet the requirements of the agricultural industry and are effective yet safe to use while ensuring compliance to high levels of regulatory policies.
Technological Advancements in Feed Additive Delivery Systems
- The feed additives market marked the rise of the delivery systems due to the growing importance of applications that are accurate and efficient in feed manufacturing and are also environmentally friendly. A common one is the enhanced use of nanoencapsulation methods, whereby the active ingredients are contained in structures of dimensions in the nanometer range and which offer enhanced stability, bioavailability and controlled release in the animal digestive tract. Nanoencapsulation also provides betterSHY encapsulation, protection of additives including vitamins as well as probiotics from degradation brought about by feed processing as well as digestion, resulting in enhanced efficacy with reduced wastage . Moreover, some novel applications such as microencapsulation and lipid-based delivery systems have also emerged to enhance nutrient delivery by providing sustained release of feed additives, optimising the efficacy of these additives and reducing the need for frequent inclusion while minimising the adverse effects on the environment and feed manufacturing cost.
- Furthermore, in precision feeding and information technology, innovations have implemented changes in scientific feed additive delivery systems that provide strain-specific nutritional management programs based on the needs of each animal or on-feed intake and digestion performance parameters. Sensors combined with data analytics and automated feed delivery systems help farmers set appropriate feed rations and deliver feed at the right time ensuring optimal feed efficiency and cattle health. Furthermore, the use of blockchain and IoT in feed supply chain provides realization of traceability and increased transparency in the process to meet the standards and cope with the challenging requirements of consumers linked with food safety and sustainable production. Altogether, these technological enhancements contribute to the enhancement of feed additives and the creation of increased competitive opportunities within the sector and provide a better approach to animal farming and husbandry.
Feed Additives Market Segment Analysis:
Feed Additives Market is Segmented based on Type, Source, Form and Livestock.
By Type, Amino acids segment is expected to dominate the market during the forecast period
- The feed additives market, many kinds of additives perform vital functions in bolstering the nutritive value of feeds as well as the general well-being of animals raised for food production, both livestock and poultry. Some of the nutrients include the amino acids lysine and methionine used for protein synthesis, vitamins and minerals that guarantee animals get the right preformed nutrients for muscle formation and other bodily structures. Phosphates are other gemstones which contributes to the formation of bones as well as management of metabolism. They play the role of providing the hardness and strength to the face and surface of bones and teeth in animals. They play a very important role in different metabolic activities and immunological reactions, and also supplements general wellbeing and ability to the body to fight diseases.
- Also, acidifiers are effective in maintaining the pH level in the delicacy/ DIGESTIVE tract, thereby enhancing the growth and functioning of friendly gut flora as well as assisting in nutrient assimilation. Other components include carotenoids, well-known for their antioxidant effects and pigmentation of skin and feathers in poultry and enhancement of reproductive function. Some of the roles include: modulation of nutrient structure, enhancement of the degree of degradation through enzymes, and yielding enhanced nutrient value of foods. Other additives are many and diverse, and they include enriched with Probiotics, Prebiotics and antimicrobial substances of various kinds, all of which have specific roles to be played in the overall health and productivity of the animals. Altogether due to the different kinds of feed additives, which are covering all the nutritional requirements and health issues when it comes to animal feeding, animal agriculture has becomes efficient and sustainable.
By End Use Sector, Synthetic segment held the largest share
- In the feed additives market, products can be broadly categorized into two main sources: It is divided into two major types which include the synthetic and natural. Synthetic feed additives are chemical compounds which is produced synthetically for the purpose of improving the feed value of animal feeds whereby these feeds are enriched with vital nutrients for animal intake, digestion and to boost the general health and growth of the animals. These additives are generally manufactured through industrial methods, Other additives that may be incorporated into feed include vitamins, amino acids, antibiotics, and growth promoters. They are appreciated for filtering nutrient delivery and for their effectiveness in supplementing nutritional needs of livestock.
- However, natural feed additives include plants and plant by-products, natural herbs and spices, minerals, and microorganisms. These additives are widely used because the consumers are now paying more attention towards natural and organic products than the synthetic products because of environmental hazardous effects and avoidable health risks connected with such chemical products. This viewpoint shows that natural feed additives on offer have so many benefits such as increased feed conversion rates, animal welfare, and less on antibiotic use. Also, they are considered to be less risky by consumers and therefore preferred in markets that appeal to consumer values such as sustainability and concerns towards animal cruelty. The demand for feed additives originating from synthetic chemicals may decline as consumers mature and regulation changes requiring natural ingredients and materials to be incorporated. Nevertheless, both synthetic and natural feeds shall be important in fulfilling the diversities of the feed essence.
Feed Additives Market Regional Insights:
Asia-Pacific is Expected to Dominate the Market Over the Forecast period
- The Asia Pacific region is set to come into its own in the feed additives market for the following reasons throughout the forecast period. First, due to increased population growth, changes in the work-life balance with increasing urbanization, and the growth of their per capita income, the demand for meat and dairy products in the region has increased significantly. This means that there should be improved management of livestock so as to improve on the feed production systems which in return will call for the use of feed additives for the improvement of animal health, growth and productivity. Also, the part ahs a strong horticulture base where countries like China and India are major producers of livestock. Given the strong focus on agriculture in this region, the increasing population, coupled with the rising number of farmers and producers getting educated on the importance of feed additives in the Asia-Pacific region, the market is expected to see significant growth within the forecast period.
- In addition, favorable government polices and encourage made towards increasing the sustainability of livestock farming is also driving the adoptions of feed additives in the region. As the governments of Asia-Pacific become aware of the issue of food security, they start concentrating efforts on various initiatives related to the reduction of negative effects of livestock production on environment and enhancement of animal welfare regulation. In this regard, feed additives are of great significance when it comes to modulating feed conversion, minimizing the emission of the greenhouse gases commonly associated with livestock farming, and consequently drawing down on the ecological impacts of this sub-sector of animal production. Coupled with the growth in livestock farming business in the Asia-Pacific region and favorable government policies, this has pointed out towards the Asia-Pacific region dominance in the feed additives market during the forecast period.
Active Key Players in the Feed Additives Market
- Cargill, Incorporated (US)
- ADM (US)
- International Flavors & Fragrances (US)
- Evonik Industries AG (Germany)
- BASF SE (Germany)
- DSM (Netherlands)
- Ajinomoto (Japan)
- Novozymes (Denmark)
- CHR. HANSEN (Denmark)
- TEGASA (Spain)
- Nutreco (Netherlands)
- Kemin Industries Inc (US)
- Adisseo (France)
- BRF (Brazil)
- Solvay (Belgium)
- Global Nutrition International (France)
- Centafarm SRL (Italy)
- Bentoli (US)
- Nuqo Feed Additives (France)
- Novus International Inc. (US)
- Other Active Players
Key Industry Developments in the Feed Additives Market
- In January 2023, Evonik Industries AG (Germany) invested USD 26.5 million in expanding its methyl mercapto-propionaldehyde (MMP) production plant in Wesseling, Germany, strengthening its global methionine production network. MMP is a key component in producing MetAMINO (DL-methionine), used to enhance livestock farming in animal feed. This investment bolsters the European methionine network, ensuring a stable supply of MMP to the MetAMINO production hub in Antwerp, Belgium, and reaffirming Evonik Industries AG's commitment to the global DL-methionine market. The expansion is enabled by a new production process that eliminates the need to store chemical intermediates on-site, prioritizing safety and efficiency. This expansion enhances Evonik Industries AG's position in the competitive feed additives market.
- In August 2023 Adisseo, a Chinese conglomerate operating in the animal nutrition industry, shared plans to expand its footprint by constructing a new powder methionine plant in Fujian province in China. The company invested nearly USD 680 million in this facility, which is expected to be operational by 2027.
|
Global Feed Additives Market |
|||
|
Base Year: |
2024 |
Forecast Period: |
2025-2032 |
|
Historical Data: |
2018 to 2023 |
Market Size in 2024: |
USD 44.65 Bn. |
|
Forecast Period 2025-32 CAGR: |
9.20% |
Market Size in 2032: |
USD 70.1 Bn. |
|
Segments Covered: |
By Type |
|
|
|
By Source |
|
||
|
By Form |
|
||
|
By Livestock |
|
||
|
By Region |
|
||
|
Key Market Drivers: |
|
||
|
Key Market Restraints: |
|
||
|
Key Opportunities: |
|
||
|
Companies Covered in the report: |
|
||
Chapter 1: Introduction
1.1 Scope and Coverage
Chapter 2:Executive Summary
Chapter 3: Market Landscape
3.1 Market Dynamics
3.1.1 Drivers
3.1.2 Restraints
3.1.3 Opportunities
3.1.4 Challenges
3.2 Market Trend Analysis
3.3 PESTLE Analysis
3.4 Porter's Five Forces Analysis
3.5 Industry Value Chain Analysis
3.6 Ecosystem
3.7 Regulatory Landscape
3.8 Price Trend Analysis
3.9 Patent Analysis
3.10 Technology Evolution
3.11 Investment Pockets
3.12 Import-Export Analysis
Chapter 4: Feed Additives Market by Type (2018-2032)
4.1 Feed Additives Market Snapshot and Growth Engine
4.2 Market Overview
4.3 Amino acids
4.3.1 Introduction and Market Overview
4.3.2 Historic and Forecasted Market Size in Value USD and Volume Units
4.3.3 Key Market Trends, Growth Factors, and Opportunities
4.3.4 Geographic Segmentation Analysis
4.4 Phosphates
4.5 Vitamins
4.6 Acidifiers
4.7 Carotenoids
4.8 Enzymes
4.9 Others
Chapter 5: Feed Additives Market by Source (2018-2032)
5.1 Feed Additives Market Snapshot and Growth Engine
5.2 Market Overview
5.3 Synthetic
5.3.1 Introduction and Market Overview
5.3.2 Historic and Forecasted Market Size in Value USD and Volume Units
5.3.3 Key Market Trends, Growth Factors, and Opportunities
5.3.4 Geographic Segmentation Analysis
5.4 Natural
Chapter 6: Feed Additives Market by Form (2018-2032)
6.1 Feed Additives Market Snapshot and Growth Engine
6.2 Market Overview
6.3 Dry
6.3.1 Introduction and Market Overview
6.3.2 Historic and Forecasted Market Size in Value USD and Volume Units
6.3.3 Key Market Trends, Growth Factors, and Opportunities
6.3.4 Geographic Segmentation Analysis
6.4 Liquid
Chapter 7: Feed Additives Market by Livestock (2018-2032)
7.1 Feed Additives Market Snapshot and Growth Engine
7.2 Market Overview
7.3 Poultry
7.3.1 Introduction and Market Overview
7.3.2 Historic and Forecasted Market Size in Value USD and Volume Units
7.3.3 Key Market Trends, Growth Factors, and Opportunities
7.3.4 Geographic Segmentation Analysis
7.4 Ruminants
7.5 Swine
7.6 Aquatic animals
7.7 Other livestock
Chapter 8: Company Profiles and Competitive Analysis
8.1 Competitive Landscape
8.1.1 Competitive Benchmarking
8.1.2 Feed Additives Market Share by Manufacturer (2024)
8.1.3 Industry BCG Matrix
8.1.4 Heat Map Analysis
8.1.5 Mergers and Acquisitions
8.2 THERMO FISHER SCIENTIFIC INC. (US)
8.2.1 Company Overview
8.2.2 Key Executives
8.2.3 Company Snapshot
8.2.4 Role of the Company in the Market
8.2.5 Sustainability and Social Responsibility
8.2.6 Operating Business Segments
8.2.7 Product Portfolio
8.2.8 Business Performance
8.2.9 Key Strategic Moves and Recent Developments
8.2.10 SWOT Analysis
8.3 BIO-RAD LABORATORIES INC. (US)
8.4 MERCK GROUP (GERMANY)
8.5 CELL SIGNALING TECHNOLOGY INC. (US)
8.6 GENSCRIPT (CHINA)
8.7 BIOLEGEND (US)
8.8 ROCKLAND IMMUNOCHEMICALS (US)
8.9 OTHER KEY PLAYERS
8.10
Chapter 9: Global Feed Additives Market By Region
9.1 Overview
9.2. North America Feed Additives Market
9.2.1 Key Market Trends, Growth Factors and Opportunities
9.2.2 Top Key Companies
9.2.3 Historic and Forecasted Market Size by Segments
9.2.4 Historic and Forecasted Market Size by Type
9.2.4.1 Amino acids
9.2.4.2 Phosphates
9.2.4.3 Vitamins
9.2.4.4 Acidifiers
9.2.4.5 Carotenoids
9.2.4.6 Enzymes
9.2.4.7 Others
9.2.5 Historic and Forecasted Market Size by Source
9.2.5.1 Synthetic
9.2.5.2 Natural
9.2.6 Historic and Forecasted Market Size by Form
9.2.6.1 Dry
9.2.6.2 Liquid
9.2.7 Historic and Forecasted Market Size by Livestock
9.2.7.1 Poultry
9.2.7.2 Ruminants
9.2.7.3 Swine
9.2.7.4 Aquatic animals
9.2.7.5 Other livestock
9.2.8 Historic and Forecast Market Size by Country
9.2.8.1 US
9.2.8.2 Canada
9.2.8.3 Mexico
9.3. Eastern Europe Feed Additives Market
9.3.1 Key Market Trends, Growth Factors and Opportunities
9.3.2 Top Key Companies
9.3.3 Historic and Forecasted Market Size by Segments
9.3.4 Historic and Forecasted Market Size by Type
9.3.4.1 Amino acids
9.3.4.2 Phosphates
9.3.4.3 Vitamins
9.3.4.4 Acidifiers
9.3.4.5 Carotenoids
9.3.4.6 Enzymes
9.3.4.7 Others
9.3.5 Historic and Forecasted Market Size by Source
9.3.5.1 Synthetic
9.3.5.2 Natural
9.3.6 Historic and Forecasted Market Size by Form
9.3.6.1 Dry
9.3.6.2 Liquid
9.3.7 Historic and Forecasted Market Size by Livestock
9.3.7.1 Poultry
9.3.7.2 Ruminants
9.3.7.3 Swine
9.3.7.4 Aquatic animals
9.3.7.5 Other livestock
9.3.8 Historic and Forecast Market Size by Country
9.3.8.1 Russia
9.3.8.2 Bulgaria
9.3.8.3 The Czech Republic
9.3.8.4 Hungary
9.3.8.5 Poland
9.3.8.6 Romania
9.3.8.7 Rest of Eastern Europe
9.4. Western Europe Feed Additives Market
9.4.1 Key Market Trends, Growth Factors and Opportunities
9.4.2 Top Key Companies
9.4.3 Historic and Forecasted Market Size by Segments
9.4.4 Historic and Forecasted Market Size by Type
9.4.4.1 Amino acids
9.4.4.2 Phosphates
9.4.4.3 Vitamins
9.4.4.4 Acidifiers
9.4.4.5 Carotenoids
9.4.4.6 Enzymes
9.4.4.7 Others
9.4.5 Historic and Forecasted Market Size by Source
9.4.5.1 Synthetic
9.4.5.2 Natural
9.4.6 Historic and Forecasted Market Size by Form
9.4.6.1 Dry
9.4.6.2 Liquid
9.4.7 Historic and Forecasted Market Size by Livestock
9.4.7.1 Poultry
9.4.7.2 Ruminants
9.4.7.3 Swine
9.4.7.4 Aquatic animals
9.4.7.5 Other livestock
9.4.8 Historic and Forecast Market Size by Country
9.4.8.1 Germany
9.4.8.2 UK
9.4.8.3 France
9.4.8.4 The Netherlands
9.4.8.5 Italy
9.4.8.6 Spain
9.4.8.7 Rest of Western Europe
9.5. Asia Pacific Feed Additives Market
9.5.1 Key Market Trends, Growth Factors and Opportunities
9.5.2 Top Key Companies
9.5.3 Historic and Forecasted Market Size by Segments
9.5.4 Historic and Forecasted Market Size by Type
9.5.4.1 Amino acids
9.5.4.2 Phosphates
9.5.4.3 Vitamins
9.5.4.4 Acidifiers
9.5.4.5 Carotenoids
9.5.4.6 Enzymes
9.5.4.7 Others
9.5.5 Historic and Forecasted Market Size by Source
9.5.5.1 Synthetic
9.5.5.2 Natural
9.5.6 Historic and Forecasted Market Size by Form
9.5.6.1 Dry
9.5.6.2 Liquid
9.5.7 Historic and Forecasted Market Size by Livestock
9.5.7.1 Poultry
9.5.7.2 Ruminants
9.5.7.3 Swine
9.5.7.4 Aquatic animals
9.5.7.5 Other livestock
9.5.8 Historic and Forecast Market Size by Country
9.5.8.1 China
9.5.8.2 India
9.5.8.3 Japan
9.5.8.4 South Korea
9.5.8.5 Malaysia
9.5.8.6 Thailand
9.5.8.7 Vietnam
9.5.8.8 The Philippines
9.5.8.9 Australia
9.5.8.10 New Zealand
9.5.8.11 Rest of APAC
9.6. Middle East & Africa Feed Additives Market
9.6.1 Key Market Trends, Growth Factors and Opportunities
9.6.2 Top Key Companies
9.6.3 Historic and Forecasted Market Size by Segments
9.6.4 Historic and Forecasted Market Size by Type
9.6.4.1 Amino acids
9.6.4.2 Phosphates
9.6.4.3 Vitamins
9.6.4.4 Acidifiers
9.6.4.5 Carotenoids
9.6.4.6 Enzymes
9.6.4.7 Others
9.6.5 Historic and Forecasted Market Size by Source
9.6.5.1 Synthetic
9.6.5.2 Natural
9.6.6 Historic and Forecasted Market Size by Form
9.6.6.1 Dry
9.6.6.2 Liquid
9.6.7 Historic and Forecasted Market Size by Livestock
9.6.7.1 Poultry
9.6.7.2 Ruminants
9.6.7.3 Swine
9.6.7.4 Aquatic animals
9.6.7.5 Other livestock
9.6.8 Historic and Forecast Market Size by Country
9.6.8.1 Turkiye
9.6.8.2 Bahrain
9.6.8.3 Kuwait
9.6.8.4 Saudi Arabia
9.6.8.5 Qatar
9.6.8.6 UAE
9.6.8.7 Israel
9.6.8.8 South Africa
9.7. South America Feed Additives Market
9.7.1 Key Market Trends, Growth Factors and Opportunities
9.7.2 Top Key Companies
9.7.3 Historic and Forecasted Market Size by Segments
9.7.4 Historic and Forecasted Market Size by Type
9.7.4.1 Amino acids
9.7.4.2 Phosphates
9.7.4.3 Vitamins
9.7.4.4 Acidifiers
9.7.4.5 Carotenoids
9.7.4.6 Enzymes
9.7.4.7 Others
9.7.5 Historic and Forecasted Market Size by Source
9.7.5.1 Synthetic
9.7.5.2 Natural
9.7.6 Historic and Forecasted Market Size by Form
9.7.6.1 Dry
9.7.6.2 Liquid
9.7.7 Historic and Forecasted Market Size by Livestock
9.7.7.1 Poultry
9.7.7.2 Ruminants
9.7.7.3 Swine
9.7.7.4 Aquatic animals
9.7.7.5 Other livestock
9.7.8 Historic and Forecast Market Size by Country
9.7.8.1 Brazil
9.7.8.2 Argentina
9.7.8.3 Rest of SA
Chapter 10 Analyst Viewpoint and Conclusion
10.1 Recommendations and Concluding Analysis
10.2 Potential Market Strategies
Chapter 11 Research Methodology
11.1 Research Process
11.2 Primary Research
11.3 Secondary Research
|
Global Feed Additives Market |
|||
|
Base Year: |
2024 |
Forecast Period: |
2025-2032 |
|
Historical Data: |
2018 to 2023 |
Market Size in 2024: |
USD 44.65 Bn. |
|
Forecast Period 2025-32 CAGR: |
9.20% |
Market Size in 2032: |
USD 70.1 Bn. |
|
Segments Covered: |
By Type |
|
|
|
By Source |
|
||
|
By Form |
|
||
|
By Livestock |
|
||
|
By Region |
|
||
|
Key Market Drivers: |
|
||
|
Key Market Restraints: |
|
||
|
Key Opportunities: |
|
||
|
Companies Covered in the report: |
|
||


