


Medicated Feed Additives Market Synopsis
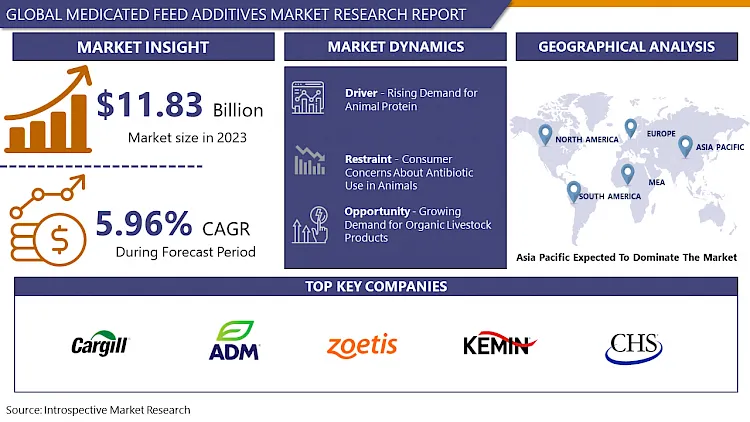
Global Medicated Feed Additives Market Size Was Valued at USD 11.83 Billion in 2023, and is Projected to Reach USD 19.92 Billion by 2032, Growing at a CAGR of 5.96 % From 2024-2032.
Medicated feed additives encompass substances incorporated into animal feed to administer targeted medications or supplements to livestock. Their vital function includes preserving animal health, averting diseases, and fostering growth. Administered via feed, these additives offer a convenient and accurate dosing method, thereby enhancing the general welfare and productivity of livestock.
Medicated feed additives are extensively utilized in livestock farming to address diverse health issues and optimize growth and productivity. These additives administer specific medications or supplements through animal feed, targeting ailments like bacterial infections, parasitic infestations, and nutrient deficiencies. By directly incorporating medications into feed, medicated feed additives provide a convenient and efficient treatment method, ensuring consistent delivery of essential nutrients and medications to livestock.
A significant advantage of medicated feed additives is their effectiveness in preventing and managing diseases among livestock populations. Through the inclusion of medications in feed formulations, farmers can proactively tackle health challenges and mitigate the spread of infections within their herds or flocks. Additionally, these additives contribute to enhanced growth rates and feed conversion efficiency, thereby improving overall productivity in livestock operations.
The future demand for medicated feed additives is poised for growth as livestock producers seek efficient strategies to uphold animal health and maximize profitability. With ongoing advancements in veterinary medicine and a heightened emphasis on animal welfare, there is an increasing acknowledgment of the pivotal role played by medicated feed additives in promoting livestock health and well-being. Moreover, as the global population expands, there will be a heightened necessity for sustainable and effective livestock production methods, further propelling the demand for medicated feed additives as integral components of modern animal husbandry practices.
.webp)
 Medicated Feed Additives Market Trend Analysis
Rising Demand for Animal Protein
- The growing demand for animal protein emerges as a key factor driving the expansion of the medicated feed additives market. As global populations increase and dietary preferences shift towards protein-rich foods, there is a notable rise in the consumption of animal-derived products. This surge in demand necessitates the enhancement of livestock health and productivity to meet the escalating needs of the food industry.
- Medicated feed additives play a crucial role in fulfilling this demand by improving the health and performance of livestock. Through the delivery of essential medications and supplements via animal feed, these additives contribute to disease prevention, growth promotion, and overall well-being. Consequently, farmers and producers can effectively address the increasing demand for animal protein while upholding rigorous standards of animal health and welfare.
- Moreover, the utilization of medicated feed additives not only supports the heightened production of animal protein but also fosters sustainable and efficient practices in livestock farming. By proactively addressing health issues and reducing reliance on antibiotics, medicated feed additives help mitigate the risk of disease outbreaks and minimize the environmental impact of livestock production. As the demand for animal protein continues to grow, the medicated feed additives market is poised for sustained expansion, driven by the ongoing imperative to optimize livestock health and fulfill the requirements of a burgeoning global population.
Growing Demand for Organic Livestock Products
- The increasing desire for organic livestock products presents a notable opportunity for the expansion of the medicated feed additives market. As consumers prioritize organic and sustainably sourced foods, the demand for livestock products from animals raised without antibiotics or synthetic additives is on the rise. This preference for organic livestock products forms a distinct market segment, prompting the need for innovative solutions to ensure animal health and welfare while adhering to organic standards.
- Medicated feed additives provide a practical approach to address the unique challenges encountered by organic livestock producers. Although conventional antibiotics and growth promoters are restricted in organic farming, medicated feed additives can be employed to support animal health and productivity while complying with organic certification criteria. Through the delivery of essential medications and supplements via animal feed, these additives empower organic livestock producers to prevent diseases, foster growth, and enhance overall animal well-being.
- Moreover, the integration of medicated feed additives in organic livestock production aligns with the principles of sustainable agriculture. By reducing antibiotic usage and mitigating the risk of disease outbreaks, medicated feed additives promote environmentally friendly farming practices and bolster the sustainability of organic farming systems. With the increasing demand for organic livestock products fueled by consumer preferences for healthier and sustainable food choices, the medicated feed additives market is poised to seize this opportunity by providing customized solutions tailored to the specific requirements of organic livestock producers.
Medicated Feed Additives Market Segment Analysis:
Medicated Feed Additives Market Segmented on the basis of Type, Mixture Type, and Livestock.
By Type, Antibiotics segment is expected to dominate the market during the forecast period
- Antibiotics are positioned to lead the growth of the medicated feed additives market due to their extensive use in livestock farming. These substances are vital for preventing and treating bacterial infections, thereby fostering animal health and productivity. As the global demand for animal protein escalates, the utilization of antibiotics in medicated feed additives is anticipated to surge, fueled by the necessity to enhance livestock production and fulfill the increasing requirements of the food sector.
- Moreover, antibiotics offer various benefits in livestock farming, including enhanced growth rates, improved feed efficiency, and decreased mortality rates among animals. Through the integration of antibiotics into feed formulations, farmers can effectively manage bacterial infections and uphold the overall well-being of their livestock. Despite growing concerns regarding antibiotic resistance and regulatory constraints on their usage, antibiotics remain integral to medicated feed additives, serving as a critical tool for addressing health challenges in livestock populations. Consequently, antibiotics are expected to sustain their dominance in the medicated feed additives market, propelling ongoing growth and advancements in the livestock industry.
By Livestock, Poultry segment held the largest share of 44.12% in 2022
- The poultry segment stands out as the primary driver propelling the expansion of the medicated feed additives market. Holding the largest portion, poultry farming extensively relies on medicated feed additives to bolster the health and performance of poultry flocks. These additives are instrumental in preventing and managing common poultry diseases like bacterial infections and parasitic infestations, while also fostering growth and overall well-being.
- The intensive nature of poultry production and the susceptibility of poultry to various health issues contribute significantly to the dominance of the poultry segment. Medicated feed additives offer poultry farmers a convenient and efficient solution to address these challenges, ensuring the optimal health and productivity of their flocks. Furthermore, as the global demand for poultry products continues to rise, the utilization of medicated feed additives in the poultry segment is anticipated to grow, consolidating its position as a prominent market segment within the medicated feed additives industry.
Medicated Feed Additives Market Regional Insights:
Asia Pacific is Expected to Dominate the Market Over the Forecast Period
- Asia Pacific is poised to lead the regional expansion of the medicated feed additives market. The region's burgeoning population and escalating demand for animal protein, particularly in emerging economies such as China and India, offer significant growth opportunities for the medicated feed additives industry. The intensive nature of livestock farming in the Asia Pacific, combined with frequent disease outbreaks, fuels the need for medicated feed additives to ensure optimal health and productivity of livestock.
- Furthermore, the increasing adoption of intensive farming methods and growing awareness among farmers regarding the advantages of medicated feed additives contribute to market growth in the region. Additionally, heightened investments in animal health and welfare initiatives by governments and regulatory bodies across the Asia Pacific are expected to promote the widespread adoption of medicated feed additives. Asia Pacific is expected to uphold its dominance in the medicated feed additives market, driving considerable growth and innovation in the livestock sector across the region.
Medicated Feed Additives Market Top Key Players:
- Phibro Animal Health Corporation (U.S.)
- Zoetis Inc. (U.S.)
- Cargill Inc. (U.S.)
- ADM (U.S.)
- CHS Inc. (U.S.)
- Purina Animal Nutrition (Land O' Lakes) (U.S.)
- Kemin Industries (U.S)
- Alltech Inc. (U.S.)
- HI-PRO Feeds (Canada)
- Adisseo France SAS (France)
- Zagro (Singapore)
- Biostadt India Limited (India)
- Provimi Animal Nutrition (India), and Other Major Players
Key Industry Developments in the Medicated Feed Additives Market:
- In October 2023, Elanco announced the expansion of its prebiotic feed additive portfolio, catering to the growing demand for gut health solutions in animal production.
- In October 2023: Nutreco Partnered with a technology startup to develop AI-powered tools for optimizing feed formulations and minimizing the use of medicated additives.
|
Global Medicated Feed Additives Market |
|||
|
Base Year: |
2023 |
Forecast Period: |
2024-2032 |
|
Historical Data: |
2017 to 2023 |
Market Size in 2023: |
USD 11.83 Bn. |
|
Forecast Period 2023-30 CAGR: |
5.96 % |
Market Size in 2032: |
USD 19.92 Bn. |
|
Segments Covered: |
By Type |
|
|
|
By Mixture Type |
|
||
|
By Livestock |
|
||
|
By Region |
|
||
|
Key Market Drivers: |
|
||
|
Key Market Restraints: |
|
||
|
Key Opportunities: |
|
||
|
Companies Covered in the report: |
|
||
Chapter 1: Introduction
1.1 Scope and Coverage
Chapter 2:Executive Summary
Chapter 3: Market Landscape
3.1 Market Dynamics
3.1.1 Drivers
3.1.2 Restraints
3.1.3 Opportunities
3.1.4 Challenges
3.2 Market Trend Analysis
3.3 PESTLE Analysis
3.4 Porter's Five Forces Analysis
3.5 Industry Value Chain Analysis
3.6 Ecosystem
3.7 Regulatory Landscape
3.8 Price Trend Analysis
3.9 Patent Analysis
3.10 Technology Evolution
3.11 Investment Pockets
3.12 Import-Export Analysis
Chapter 4: Medicated Feed Additives Market by Type (2018-2032)
4.1 Medicated Feed Additives Market Snapshot and Growth Engine
4.2 Market Overview
4.3 Antioxidants
4.3.1 Introduction and Market Overview
4.3.2 Historic and Forecasted Market Size in Value USD and Volume Units
4.3.3 Key Market Trends, Growth Factors, and Opportunities
4.3.4 Geographic Segmentation Analysis
4.4 Antibiotics
4.5 Probiotics & Prebiotics
4.6 Enzymes
4.7 Amino acids
Chapter 5: Medicated Feed Additives Market by Mixture Type (2018-2032)
5.1 Medicated Feed Additives Market Snapshot and Growth Engine
5.2 Market Overview
5.3 Concentrates
5.3.1 Introduction and Market Overview
5.3.2 Historic and Forecasted Market Size in Value USD and Volume Units
5.3.3 Key Market Trends, Growth Factors, and Opportunities
5.3.4 Geographic Segmentation Analysis
5.4 Supplements
5.5 Premix Feeds
5.6 Base Mixes
Chapter 6: Medicated Feed Additives Market by Livestock (2018-2032)
6.1 Medicated Feed Additives Market Snapshot and Growth Engine
6.2 Market Overview
6.3 Ruminants
6.3.1 Introduction and Market Overview
6.3.2 Historic and Forecasted Market Size in Value USD and Volume Units
6.3.3 Key Market Trends, Growth Factors, and Opportunities
6.3.4 Geographic Segmentation Analysis
6.4 Swine
6.5 Aquaculture
6.6 Poultry
Chapter 7: Company Profiles and Competitive Analysis
7.1 Competitive Landscape
7.1.1 Competitive Benchmarking
7.1.2 Medicated Feed Additives Market Share by Manufacturer (2024)
7.1.3 Industry BCG Matrix
7.1.4 Heat Map Analysis
7.1.5 Mergers and Acquisitions
7.2 ADAMA AGRICULTURAL SOLUTIONS LTD. (ISRAEL)
7.2.1 Company Overview
7.2.2 Key Executives
7.2.3 Company Snapshot
7.2.4 Role of the Company in the Market
7.2.5 Sustainability and Social Responsibility
7.2.6 Operating Business Segments
7.2.7 Product Portfolio
7.2.8 Business Performance
7.2.9 Key Strategic Moves and Recent Developments
7.2.10 SWOT Analysis
7.3 ARYSTA LIFESCIENCE(US)
7.4 BASF SE (GERMANY)
7.5 BAYER CROPSCIENCE AG (GERMANY)
7.6 BELCHIM CROP PROTECTION (BELGIUM)
7.7 BOTANOCAP LTD. (ISRAEL)
7.8 CHINA NATIONAL CHEMICAL CORPORATION (CHINA)
7.9 ECOSAFE NATURAL PRODUCTS INC. (CANADA)
7.10 FMC CORPORATION (US)
7.11 GAT MICROENCAPSULATION GMBH (AUSTRIA)
7.12 ISRAEL CHEMICAL COMPANY (ISRAEL)
7.13 K + S GROUP (GERMANY)
7.14 MCLAUGHLIN GORMLEY KING COMPANY (US)
7.15 NUFARM LIMITED (AUSTRALIA)
7.16 REED PACIFIC PTY LIMITED (AUSTRALIA)
7.17 SUMITOMO CHEMICALS (JAPAN)
7.18 SYNGENTA AG (SWITZERLAND)
7.19 THE DOW CHEMICAL COMPANY (US)
7.20 THE MONSANTO COMPANY (US)
7.21 UPL CORPORATION LTD. (INDIA)
7.22 YARA INTERNATIONAL (NORWAY)
Chapter 8: Global Medicated Feed Additives Market By Region
8.1 Overview
8.2. North America Medicated Feed Additives Market
8.2.1 Key Market Trends, Growth Factors and Opportunities
8.2.2 Top Key Companies
8.2.3 Historic and Forecasted Market Size by Segments
8.2.4 Historic and Forecasted Market Size by Type
8.2.4.1 Antioxidants
8.2.4.2 Antibiotics
8.2.4.3 Probiotics & Prebiotics
8.2.4.4 Enzymes
8.2.4.5 Amino acids
8.2.5 Historic and Forecasted Market Size by Mixture Type
8.2.5.1 Concentrates
8.2.5.2 Supplements
8.2.5.3 Premix Feeds
8.2.5.4 Base Mixes
8.2.6 Historic and Forecasted Market Size by Livestock
8.2.6.1 Ruminants
8.2.6.2 Swine
8.2.6.3 Aquaculture
8.2.6.4 Poultry
8.2.7 Historic and Forecast Market Size by Country
8.2.7.1 US
8.2.7.2 Canada
8.2.7.3 Mexico
8.3. Eastern Europe Medicated Feed Additives Market
8.3.1 Key Market Trends, Growth Factors and Opportunities
8.3.2 Top Key Companies
8.3.3 Historic and Forecasted Market Size by Segments
8.3.4 Historic and Forecasted Market Size by Type
8.3.4.1 Antioxidants
8.3.4.2 Antibiotics
8.3.4.3 Probiotics & Prebiotics
8.3.4.4 Enzymes
8.3.4.5 Amino acids
8.3.5 Historic and Forecasted Market Size by Mixture Type
8.3.5.1 Concentrates
8.3.5.2 Supplements
8.3.5.3 Premix Feeds
8.3.5.4 Base Mixes
8.3.6 Historic and Forecasted Market Size by Livestock
8.3.6.1 Ruminants
8.3.6.2 Swine
8.3.6.3 Aquaculture
8.3.6.4 Poultry
8.3.7 Historic and Forecast Market Size by Country
8.3.7.1 Russia
8.3.7.2 Bulgaria
8.3.7.3 The Czech Republic
8.3.7.4 Hungary
8.3.7.5 Poland
8.3.7.6 Romania
8.3.7.7 Rest of Eastern Europe
8.4. Western Europe Medicated Feed Additives Market
8.4.1 Key Market Trends, Growth Factors and Opportunities
8.4.2 Top Key Companies
8.4.3 Historic and Forecasted Market Size by Segments
8.4.4 Historic and Forecasted Market Size by Type
8.4.4.1 Antioxidants
8.4.4.2 Antibiotics
8.4.4.3 Probiotics & Prebiotics
8.4.4.4 Enzymes
8.4.4.5 Amino acids
8.4.5 Historic and Forecasted Market Size by Mixture Type
8.4.5.1 Concentrates
8.4.5.2 Supplements
8.4.5.3 Premix Feeds
8.4.5.4 Base Mixes
8.4.6 Historic and Forecasted Market Size by Livestock
8.4.6.1 Ruminants
8.4.6.2 Swine
8.4.6.3 Aquaculture
8.4.6.4 Poultry
8.4.7 Historic and Forecast Market Size by Country
8.4.7.1 Germany
8.4.7.2 UK
8.4.7.3 France
8.4.7.4 The Netherlands
8.4.7.5 Italy
8.4.7.6 Spain
8.4.7.7 Rest of Western Europe
8.5. Asia Pacific Medicated Feed Additives Market
8.5.1 Key Market Trends, Growth Factors and Opportunities
8.5.2 Top Key Companies
8.5.3 Historic and Forecasted Market Size by Segments
8.5.4 Historic and Forecasted Market Size by Type
8.5.4.1 Antioxidants
8.5.4.2 Antibiotics
8.5.4.3 Probiotics & Prebiotics
8.5.4.4 Enzymes
8.5.4.5 Amino acids
8.5.5 Historic and Forecasted Market Size by Mixture Type
8.5.5.1 Concentrates
8.5.5.2 Supplements
8.5.5.3 Premix Feeds
8.5.5.4 Base Mixes
8.5.6 Historic and Forecasted Market Size by Livestock
8.5.6.1 Ruminants
8.5.6.2 Swine
8.5.6.3 Aquaculture
8.5.6.4 Poultry
8.5.7 Historic and Forecast Market Size by Country
8.5.7.1 China
8.5.7.2 India
8.5.7.3 Japan
8.5.7.4 South Korea
8.5.7.5 Malaysia
8.5.7.6 Thailand
8.5.7.7 Vietnam
8.5.7.8 The Philippines
8.5.7.9 Australia
8.5.7.10 New Zealand
8.5.7.11 Rest of APAC
8.6. Middle East & Africa Medicated Feed Additives Market
8.6.1 Key Market Trends, Growth Factors and Opportunities
8.6.2 Top Key Companies
8.6.3 Historic and Forecasted Market Size by Segments
8.6.4 Historic and Forecasted Market Size by Type
8.6.4.1 Antioxidants
8.6.4.2 Antibiotics
8.6.4.3 Probiotics & Prebiotics
8.6.4.4 Enzymes
8.6.4.5 Amino acids
8.6.5 Historic and Forecasted Market Size by Mixture Type
8.6.5.1 Concentrates
8.6.5.2 Supplements
8.6.5.3 Premix Feeds
8.6.5.4 Base Mixes
8.6.6 Historic and Forecasted Market Size by Livestock
8.6.6.1 Ruminants
8.6.6.2 Swine
8.6.6.3 Aquaculture
8.6.6.4 Poultry
8.6.7 Historic and Forecast Market Size by Country
8.6.7.1 Turkiye
8.6.7.2 Bahrain
8.6.7.3 Kuwait
8.6.7.4 Saudi Arabia
8.6.7.5 Qatar
8.6.7.6 UAE
8.6.7.7 Israel
8.6.7.8 South Africa
8.7. South America Medicated Feed Additives Market
8.7.1 Key Market Trends, Growth Factors and Opportunities
8.7.2 Top Key Companies
8.7.3 Historic and Forecasted Market Size by Segments
8.7.4 Historic and Forecasted Market Size by Type
8.7.4.1 Antioxidants
8.7.4.2 Antibiotics
8.7.4.3 Probiotics & Prebiotics
8.7.4.4 Enzymes
8.7.4.5 Amino acids
8.7.5 Historic and Forecasted Market Size by Mixture Type
8.7.5.1 Concentrates
8.7.5.2 Supplements
8.7.5.3 Premix Feeds
8.7.5.4 Base Mixes
8.7.6 Historic and Forecasted Market Size by Livestock
8.7.6.1 Ruminants
8.7.6.2 Swine
8.7.6.3 Aquaculture
8.7.6.4 Poultry
8.7.7 Historic and Forecast Market Size by Country
8.7.7.1 Brazil
8.7.7.2 Argentina
8.7.7.3 Rest of SA
Chapter 9 Analyst Viewpoint and Conclusion
9.1 Recommendations and Concluding Analysis
9.2 Potential Market Strategies
Chapter 10 Research Methodology
10.1 Research Process
10.2 Primary Research
10.3 Secondary Research
|
Global Medicated Feed Additives Market |
|||
|
Base Year: |
2023 |
Forecast Period: |
2024-2032 |
|
Historical Data: |
2017 to 2023 |
Market Size in 2023: |
USD 11.83 Bn. |
|
Forecast Period 2023-30 CAGR: |
5.96 % |
Market Size in 2032: |
USD 19.92 Bn. |
|
Segments Covered: |
By Type |
|
|
|
By Mixture Type |
|
||
|
By Livestock |
|
||
|
By Region |
|
||
|
Key Market Drivers: |
|
||
|
Key Market Restraints: |
|
||
|
Key Opportunities: |
|
||
|
Companies Covered in the report: |
|
||


