


Fatty Acid Market Synopsis
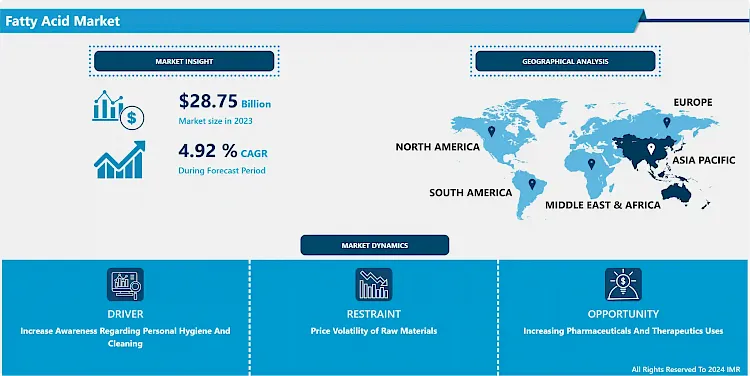
Fatty Acid Market Size Was Valued at USD 28.75 Billion in 2023 and is Projected to Reach USD 44.3 Billion by 2032, Growing at a CAGR of 4.92 % From 2024-2032.
Triglycerides and phospholipids contain the long hydrocarbon chains known as fatty acids. Based on the number of bonds between the carbon atoms, fatty acids can be divided into saturated, monounsaturated, and poly-unsaturated types. Saturated fatty acids are defined as having no double bonds and a linear structure. Monounsaturated fatty acids are defined as having a single double bond, while polyunsaturated fatty acids have multiple double bonds. Essential fatty acids are obtained from a variety of external sources, including plants, vegetable oils, nuts and seeds, animal fats, and others because they cannot be synthesized by the human body.
Essential fatty acids such as omega-3 and omega-6 fatty acids are crucial for the development, functioning, and maintenance of the brain and other nervous tissues; for vision processes; for the improvement of immune and inflammatory responses; for maintaining the concentrations of triglycerides; aid in lowering the risk factors for heart disease, and to maintain normal blood pressure. Fatty acids (FAs) are lipid biomolecules that are present in all organisms and perform a variety of functions. However, unlike other biomolecules, for example, amino acids, fatty acids are more numerous, and their composition can vary greatly across taxa. Aquatic bacteria, plants, and even invertebrates synthesize specific fatty acids that are unique to them, and they are called FA-markers.

 The Fatty Acid Market Trend Analysis
Increase Awareness Regarding Personal Hygiene And Cleaning
-
Increasing awareness regarding personal hygiene and cleaning practices is of utmost importance, especially in the context of public health and preventing the spread of infectious diseases. Personal hygiene refers to maintaining cleanliness and adopting healthy habits to safeguard oneself and others from harmful germs and pathogens. Fatty acids, with their versatile properties and applications in cleaning products, can play a significant role in enhancing the effectiveness of hygiene practices.
- Effective personal hygiene starts with simple yet powerful habits, such as regular handwashing with soap and water. Clean hands are essential for preventing the transmission of viruses and bacteria that can be picked up from various surfaces, including doorknobs, handrails, and shared objects. Proper hand hygiene, especially before handling food and after using the restroom, is crucial for reducing the risk of infections.
- As people's awareness of their health increases, more people are taking omega fatty acid supplements. The body needs omega fatty acids, which are abundant in fish oils. The symptoms of rheumatoid arthritis can be reduced with the help of omega-3 supplements, which can be taken either as dietary supplements or as therapeutic supplements. The consumption of Omega-3 and Omega-6 fatty acids helps with disease prevention and treatment, improves cardiovascular health, promotes a healthy metabolism, reduces joint pain and inflammation, enhances brain function, etc. According to the World Health Organization (WHO), 17.9 million people worldwide pass away each year as a result of cardiovascular diseases. Therefore, it is anticipated that rising awareness of health issues, particularly heart diseases, will fuel the market for fatty acids. Thus, the increasing sales of fatty acids supplement is another factor driving the growth of the fatty acid market revenue.
Increasing Pharmaceuticals And Therapeutics Uses
-
Over the years, there has been a significant increase in research focused on the potential health benefits of fatty acids. Studies have explored their impact on cardiovascular health, brain function, inflammation, and various other health conditions. As more evidence emerges supporting the positive effects of fatty acids, pharmaceutical companies have an opportunity to develop targeted medications and therapeutic solutions based on this research.
- Consumers are increasingly seeking natural and plant-based alternatives to synthetic drugs and pharmaceuticals. Fatty acids, being naturally occurring compounds found in various food sources, align well with this growing demand for natural and nutraceutical solutions. This creates opportunities for pharmaceutical companies to develop fatty acid-based products that appeal to health-conscious consumers.
- Advances in genomics and personalized medicine have paved the way for more targeted and individualized therapies. Fatty acids, with their diverse physiological effects and potential to modulate specific pathways, offer opportunities for personalized medicine approaches. Tailoring treatments based on an individual's unique fatty acid profile could lead to more effective and personalized therapeutic interventions.
Segmentation Analysis of the Fatty Acid Market
Fatty Acid Market segments cover the Type, Source, Form, Application, and Region. By Source, the plant-based segment is anticipated to dominate the market over the forecast period.
- Plant-based fats and oils can be a major component of the product (e.g., vegan smoked salmon) or a minor additive depending on the amount used. Fats and oils commonly incorporated into plant-based imitation fish products included canola oil, sunflower oil, and flaxseed oil. Fats are an essential component that improves overall palatability and contributes to the flavor, tenderness, and mouthfeel, and give succulence to products that can otherwise be dry, Thus the plant-based fatty oil dominates the market during the forecast period.
- Algal oil is a plant-based oil that is added to some products in small amounts as a source of plant-based omega-3 fatty acids DHA and EPA, and to impart a fish-like taste. Consumers around the world are becoming more conscious of their health and environmental impact. Plant-based fatty acids, sourced from plants such as flaxseed, chia seed, algae, and soybean, align with the growing demand for natural and sustainable ingredients. These sources are renewable, biodegradable, and often cultivated through eco-friendly practices, making them attractive options for health-conscious and environmentally-conscious consumers.
- The popularity of plant-based diets, such as veganism and vegetarianism, has been steadily increasing. Plant-based fatty acids fit well with these dietary preferences, as they offer a viable alternative to animal-based fatty acids found in meat, dairy, and fish products. As more consumers adopt plant-based lifestyles, the demand for plant-based fatty acids is likely to rise.
Regional Analysis of the Fatty Acid Market
Asia Pacific is expected to Dominate the Market over the Forecast period.
- Asia Pacific is home to a significant portion of the world's population, including countries like China and India with massive consumer bases. The large and growing population in this region drives the demand for various products, including food, beverages, personal care items, and pharmaceuticals, all of which utilize fatty acids as key ingredients.
- The rising middle-class population in Asia Pacific countries has led to increased disposable income, resulting in higher consumer spending on various products, including those containing fatty acids. As people become more health-conscious and seek products with added nutritional value, the demand for functional foods and dietary supplements enriched with fatty acids has grown significantly.
- Rapid urbanization in the Asia Pacific has led to changes in lifestyle and dietary habits. Urban dwellers have busier lifestyles, leading to increased consumption of convenience foods and processed products, which often contain fatty acids as food additives or ingredients.
- The personal care and cosmetics industry in the Asia Pacific region has witnessed robust growth in recent years, fueled by increasing consumer awareness about personal grooming and appearance. Fatty acids are widely used in skincare and hair care products, driving the demand for fatty acids in the personal care sector.
Top Key Players Covered in the Fatty Acid Market
The major key player in the Fatty Acid market include;
- BASF SE (Germany)
- Akzo Nobel N.V (Netherlands)
- Ashland Inc. (US)
- WujiangJinyu Lanolin Co. (China)
- Vantage Oleochemicals (US)
- Aker BioMarine AS (Norway)
- Ferro Corporation(US)
- Oleon N.V. (Belgium)
- Arizona Chemicals (US)
- Eastman Chemical Company (US)
- Colgate-Palmolive Ltd (India)
- Godrej Industries (India)
- Ferro Corporation (US)
- Longyan Zhuoyue New Energy Co. Ltd. (China)
- Eastman Chemical Corporation (US). and Other Major Players.
Key Industry Developments in the Fatty Acid Market
- In August 2022, a Seraphina Therapeutics study discovered a new fatty acid, eyeing the C15:0 supplement formulation. C15:0 is utilized by human bodies for making the 2nd-ever discovered full-acting endocannabinoid, known as PDC.
- In November 2022, Epax launched a long-chain monounsaturated fatty acid ingredient: Cetoleic 10. This ingredient consists of cetoleic acid, an omega-11 marine lipid, and gondoic acid (omega-9). The extract is extracted from North Atlantic fish, which is lower in docosahexaenoic acid (DHA) and eicosapentaenoic acid (EPA).
|
Fatty Acid Market |
|||
|
Base Year: |
2023 |
Forecast Period: |
2024-2032 |
|
Historical Data: |
2017 to 2023 |
Market Size in 2023: |
USD 28.75 Bn. |
|
Forecast Period 2024-32 CAGR: |
4.92% |
Market Size in 2032: |
USD 44.3 Bn. |
|
Segments Covered: |
By Type |
|
|
|
By Source |
|
||
|
By Form |
|
||
|
By Application |
|
||
|
By Region |
|
||
|
Key Market Drivers: |
|
||
|
Key Market Restraints: |
|
||
|
Key Opportunities: |
|
||
|
Companies Covered in the report: |
|
||
Chapter 1: Introduction
1.1 Scope and Coverage
Chapter 2:Executive Summary
Chapter 3: Market Landscape
3.1 Market Dynamics
3.1.1 Drivers
3.1.2 Restraints
3.1.3 Opportunities
3.1.4 Challenges
3.2 Market Trend Analysis
3.3 PESTLE Analysis
3.4 Porter's Five Forces Analysis
3.5 Industry Value Chain Analysis
3.6 Ecosystem
3.7 Regulatory Landscape
3.8 Price Trend Analysis
3.9 Patent Analysis
3.10 Technology Evolution
3.11 Investment Pockets
3.12 Import-Export Analysis
Chapter 4: Fatty Acid Market by Type (2018-2032)
4.1 Fatty Acid Market Snapshot and Growth Engine
4.2 Market Overview
4.3 Saturated
4.3.1 Introduction and Market Overview
4.3.2 Historic and Forecasted Market Size in Value USD and Volume Units
4.3.3 Key Market Trends, Growth Factors, and Opportunities
4.3.4 Geographic Segmentation Analysis
4.4 Monounsaturated
4.5 Poly-Unsaturated
Chapter 5: Fatty Acid Market by Source (2018-2032)
5.1 Fatty Acid Market Snapshot and Growth Engine
5.2 Market Overview
5.3 Animal Source
5.3.1 Introduction and Market Overview
5.3.2 Historic and Forecasted Market Size in Value USD and Volume Units
5.3.3 Key Market Trends, Growth Factors, and Opportunities
5.3.4 Geographic Segmentation Analysis
5.4 Plant Source
Chapter 6: Fatty Acid Market by Form (2018-2032)
6.1 Fatty Acid Market Snapshot and Growth Engine
6.2 Market Overview
6.3 Oil
6.3.1 Introduction and Market Overview
6.3.2 Historic and Forecasted Market Size in Value USD and Volume Units
6.3.3 Key Market Trends, Growth Factors, and Opportunities
6.3.4 Geographic Segmentation Analysis
6.4 Powder
6.5 Capsule
Chapter 7: Fatty Acid Market by Application (2018-2032)
7.1 Fatty Acid Market Snapshot and Growth Engine
7.2 Market Overview
7.3 Food & Beverages
7.3.1 Introduction and Market Overview
7.3.2 Historic and Forecasted Market Size in Value USD and Volume Units
7.3.3 Key Market Trends, Growth Factors, and Opportunities
7.3.4 Geographic Segmentation Analysis
7.4 Animal Feed
7.5 Pharmaceuticals & Nutraceuticals
7.6 Personal Care
7.7 Others
Chapter 8: Company Profiles and Competitive Analysis
8.1 Competitive Landscape
8.1.1 Competitive Benchmarking
8.1.2 Fatty Acid Market Share by Manufacturer (2024)
8.1.3 Industry BCG Matrix
8.1.4 Heat Map Analysis
8.1.5 Mergers and Acquisitions
8.2 HENKEL AG & CO. KGAA(GERMANY)
8.2.1 Company Overview
8.2.2 Key Executives
8.2.3 Company Snapshot
8.2.4 Role of the Company in the Market
8.2.5 Sustainability and Social Responsibility
8.2.6 Operating Business Segments
8.2.7 Product Portfolio
8.2.8 Business Performance
8.2.9 Key Strategic Moves and Recent Developments
8.2.10 SWOT Analysis
8.3 H.B. FULLER COMPANY (U.S.)
8.4 3M COMPANY (U.S.)
8.5 ARKEMA GROUP (FRANCE)
8.6 SIKA AG (SWITZERLAND)
8.7 AVERY DENNISON CORPORATION (U.S.)
8.8 DOW CHEMICAL COMPANY(U.S.)
8.9 JOWAT SE (GERMANY)
8.10 BEARDOW ADAMS GROUP (U.K.)
8.11 BOSTIK (FRANCE)
8.12 BÜHNEN GMBH & CO. KG (GERMANY)
8.13 SIPOL ADHESIVES (SPAIN)
8.14 HEXION INC. (U.S.)
8.15 TEX YEAR INDUSTRIES INC. (TAIWAN)
8.16 KLEIBERIT ADHESIVES (GERMANY)
8.17
Chapter 9: Global Fatty Acid Market By Region
9.1 Overview
9.2. North America Fatty Acid Market
9.2.1 Key Market Trends, Growth Factors and Opportunities
9.2.2 Top Key Companies
9.2.3 Historic and Forecasted Market Size by Segments
9.2.4 Historic and Forecasted Market Size by Type
9.2.4.1 Saturated
9.2.4.2 Monounsaturated
9.2.4.3 Poly-Unsaturated
9.2.5 Historic and Forecasted Market Size by Source
9.2.5.1 Animal Source
9.2.5.2 Plant Source
9.2.6 Historic and Forecasted Market Size by Form
9.2.6.1 Oil
9.2.6.2 Powder
9.2.6.3 Capsule
9.2.7 Historic and Forecasted Market Size by Application
9.2.7.1 Food & Beverages
9.2.7.2 Animal Feed
9.2.7.3 Pharmaceuticals & Nutraceuticals
9.2.7.4 Personal Care
9.2.7.5 Others
9.2.8 Historic and Forecast Market Size by Country
9.2.8.1 US
9.2.8.2 Canada
9.2.8.3 Mexico
9.3. Eastern Europe Fatty Acid Market
9.3.1 Key Market Trends, Growth Factors and Opportunities
9.3.2 Top Key Companies
9.3.3 Historic and Forecasted Market Size by Segments
9.3.4 Historic and Forecasted Market Size by Type
9.3.4.1 Saturated
9.3.4.2 Monounsaturated
9.3.4.3 Poly-Unsaturated
9.3.5 Historic and Forecasted Market Size by Source
9.3.5.1 Animal Source
9.3.5.2 Plant Source
9.3.6 Historic and Forecasted Market Size by Form
9.3.6.1 Oil
9.3.6.2 Powder
9.3.6.3 Capsule
9.3.7 Historic and Forecasted Market Size by Application
9.3.7.1 Food & Beverages
9.3.7.2 Animal Feed
9.3.7.3 Pharmaceuticals & Nutraceuticals
9.3.7.4 Personal Care
9.3.7.5 Others
9.3.8 Historic and Forecast Market Size by Country
9.3.8.1 Russia
9.3.8.2 Bulgaria
9.3.8.3 The Czech Republic
9.3.8.4 Hungary
9.3.8.5 Poland
9.3.8.6 Romania
9.3.8.7 Rest of Eastern Europe
9.4. Western Europe Fatty Acid Market
9.4.1 Key Market Trends, Growth Factors and Opportunities
9.4.2 Top Key Companies
9.4.3 Historic and Forecasted Market Size by Segments
9.4.4 Historic and Forecasted Market Size by Type
9.4.4.1 Saturated
9.4.4.2 Monounsaturated
9.4.4.3 Poly-Unsaturated
9.4.5 Historic and Forecasted Market Size by Source
9.4.5.1 Animal Source
9.4.5.2 Plant Source
9.4.6 Historic and Forecasted Market Size by Form
9.4.6.1 Oil
9.4.6.2 Powder
9.4.6.3 Capsule
9.4.7 Historic and Forecasted Market Size by Application
9.4.7.1 Food & Beverages
9.4.7.2 Animal Feed
9.4.7.3 Pharmaceuticals & Nutraceuticals
9.4.7.4 Personal Care
9.4.7.5 Others
9.4.8 Historic and Forecast Market Size by Country
9.4.8.1 Germany
9.4.8.2 UK
9.4.8.3 France
9.4.8.4 The Netherlands
9.4.8.5 Italy
9.4.8.6 Spain
9.4.8.7 Rest of Western Europe
9.5. Asia Pacific Fatty Acid Market
9.5.1 Key Market Trends, Growth Factors and Opportunities
9.5.2 Top Key Companies
9.5.3 Historic and Forecasted Market Size by Segments
9.5.4 Historic and Forecasted Market Size by Type
9.5.4.1 Saturated
9.5.4.2 Monounsaturated
9.5.4.3 Poly-Unsaturated
9.5.5 Historic and Forecasted Market Size by Source
9.5.5.1 Animal Source
9.5.5.2 Plant Source
9.5.6 Historic and Forecasted Market Size by Form
9.5.6.1 Oil
9.5.6.2 Powder
9.5.6.3 Capsule
9.5.7 Historic and Forecasted Market Size by Application
9.5.7.1 Food & Beverages
9.5.7.2 Animal Feed
9.5.7.3 Pharmaceuticals & Nutraceuticals
9.5.7.4 Personal Care
9.5.7.5 Others
9.5.8 Historic and Forecast Market Size by Country
9.5.8.1 China
9.5.8.2 India
9.5.8.3 Japan
9.5.8.4 South Korea
9.5.8.5 Malaysia
9.5.8.6 Thailand
9.5.8.7 Vietnam
9.5.8.8 The Philippines
9.5.8.9 Australia
9.5.8.10 New Zealand
9.5.8.11 Rest of APAC
9.6. Middle East & Africa Fatty Acid Market
9.6.1 Key Market Trends, Growth Factors and Opportunities
9.6.2 Top Key Companies
9.6.3 Historic and Forecasted Market Size by Segments
9.6.4 Historic and Forecasted Market Size by Type
9.6.4.1 Saturated
9.6.4.2 Monounsaturated
9.6.4.3 Poly-Unsaturated
9.6.5 Historic and Forecasted Market Size by Source
9.6.5.1 Animal Source
9.6.5.2 Plant Source
9.6.6 Historic and Forecasted Market Size by Form
9.6.6.1 Oil
9.6.6.2 Powder
9.6.6.3 Capsule
9.6.7 Historic and Forecasted Market Size by Application
9.6.7.1 Food & Beverages
9.6.7.2 Animal Feed
9.6.7.3 Pharmaceuticals & Nutraceuticals
9.6.7.4 Personal Care
9.6.7.5 Others
9.6.8 Historic and Forecast Market Size by Country
9.6.8.1 Turkiye
9.6.8.2 Bahrain
9.6.8.3 Kuwait
9.6.8.4 Saudi Arabia
9.6.8.5 Qatar
9.6.8.6 UAE
9.6.8.7 Israel
9.6.8.8 South Africa
9.7. South America Fatty Acid Market
9.7.1 Key Market Trends, Growth Factors and Opportunities
9.7.2 Top Key Companies
9.7.3 Historic and Forecasted Market Size by Segments
9.7.4 Historic and Forecasted Market Size by Type
9.7.4.1 Saturated
9.7.4.2 Monounsaturated
9.7.4.3 Poly-Unsaturated
9.7.5 Historic and Forecasted Market Size by Source
9.7.5.1 Animal Source
9.7.5.2 Plant Source
9.7.6 Historic and Forecasted Market Size by Form
9.7.6.1 Oil
9.7.6.2 Powder
9.7.6.3 Capsule
9.7.7 Historic and Forecasted Market Size by Application
9.7.7.1 Food & Beverages
9.7.7.2 Animal Feed
9.7.7.3 Pharmaceuticals & Nutraceuticals
9.7.7.4 Personal Care
9.7.7.5 Others
9.7.8 Historic and Forecast Market Size by Country
9.7.8.1 Brazil
9.7.8.2 Argentina
9.7.8.3 Rest of SA
Chapter 10 Analyst Viewpoint and Conclusion
10.1 Recommendations and Concluding Analysis
10.2 Potential Market Strategies
Chapter 11 Research Methodology
11.1 Research Process
11.2 Primary Research
11.3 Secondary Research
|
Fatty Acid Market |
|||
|
Base Year: |
2023 |
Forecast Period: |
2024-2032 |
|
Historical Data: |
2017 to 2023 |
Market Size in 2023: |
USD 28.75 Bn. |
|
Forecast Period 2024-32 CAGR: |
4.92% |
Market Size in 2032: |
USD 44.3 Bn. |
|
Segments Covered: |
By Type |
|
|
|
By Source |
|
||
|
By Form |
|
||
|
By Application |
|
||
|
By Region |
|
||
|
Key Market Drivers: |
|
||
|
Key Market Restraints: |
|
||
|
Key Opportunities: |
|
||
|
Companies Covered in the report: |
|
||


