


Eubiotics Market Synopsis
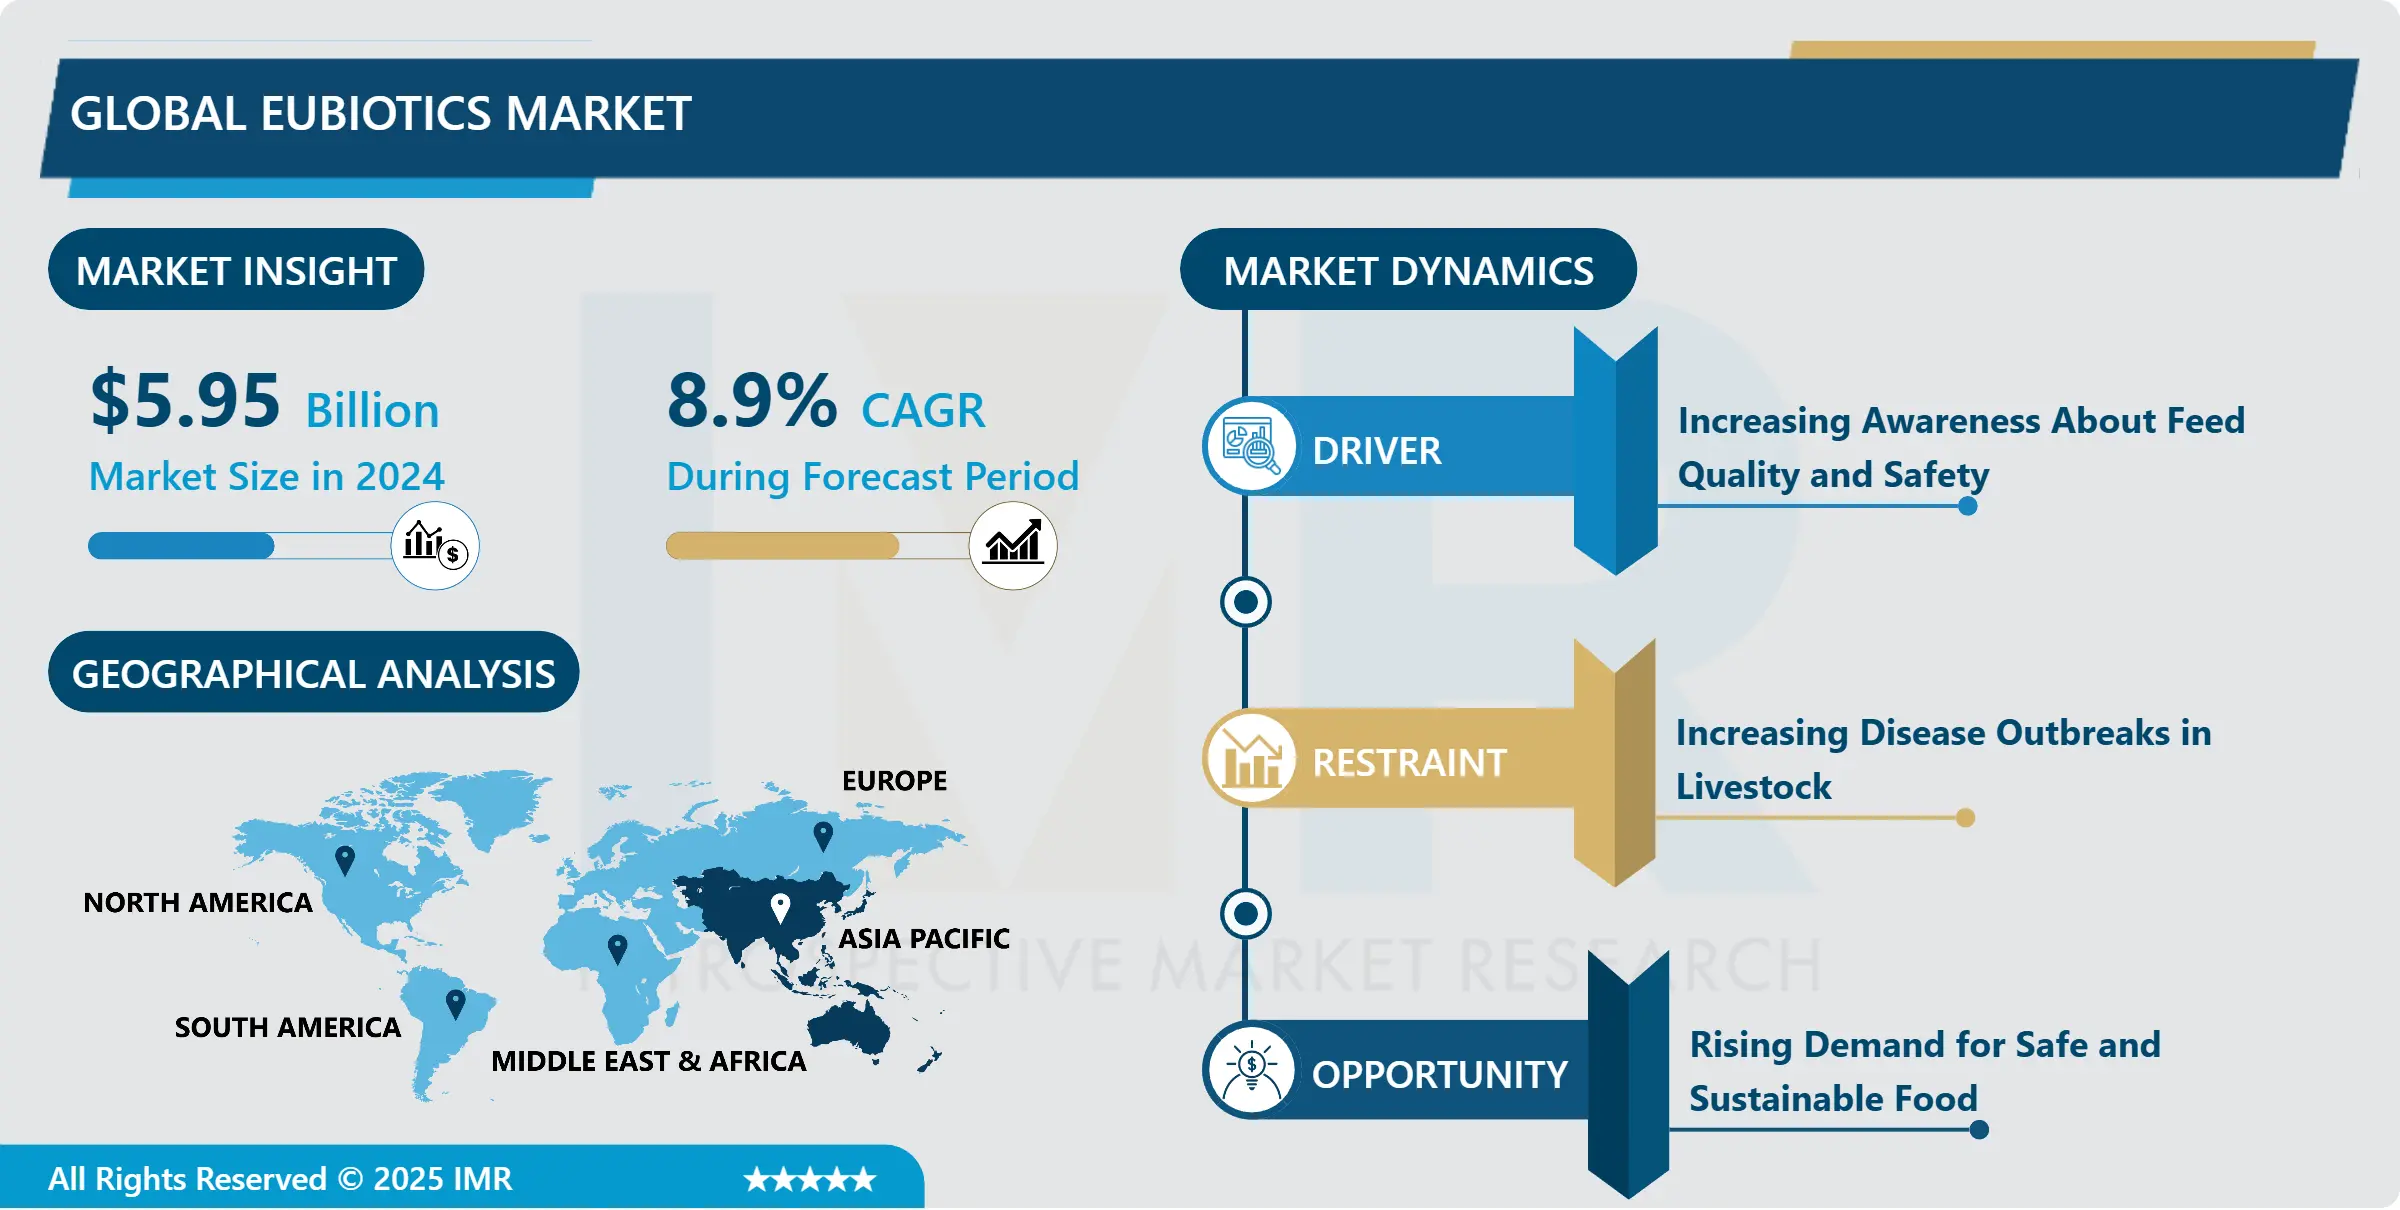
Eubiotics Market Size Was Valued at USD 5.95 Billion in 2024 and is Projected to Reach USD 11.77 Billion by 2032, Growing at a CAGR of 8.9% From 2025-2032.
Eubiotics are feed additives that enhance gut health and performance in livestock. They include probiotics, prebiotics, organic acids, and essential oils. Probiotics introduce beneficial bacteria, prebiotics provide food, and organic acids and essential oils control harmful pathogens. Eubiotics improve nutrient absorption, immunity, and digestive disorders, leading to improved growth rates and feed efficiency. They also serve as alternatives to traditional antibiotics.
Eubiotics, including organic acids, probiotics, prebiotics, and essential oils, provide several benefits for a variety of businesses. These supplements improve immunological response, food absorption, and general health by supporting gastrointestinal health in pets, cattle, and aquaculture. Addressing worries about antimicrobial resistance and residues in food items, they lessen the demand for antibiotics. Eubiotics also increase growth rates and feed conversion efficiency, which maximizes output results in animal husbandry.
The surge in demand for eubiotics can be attributed to several factors. Consumers are increasingly inclined towards natural alternatives over conventional additives, reflecting a broader movement towards clean-label and sustainable practices. Stringent regulations restricting antibiotic usage in animal feed have accelerated the adoption of eubiotics as safer and more environmentally friendly substitutes. Furthermore, the growing recognition of the gut microbiome's significance in maintaining health has sparked interest in eubiotics across various sectors, including human nutrition and pharmaceuticals.
Global population expanding and dietary preferences shifting towards protein-rich diets, the demand for eubiotics is poised to increase. Emerging economies experiencing rapid urbanization and industrialization present significant markets for eubiotics, driven by the expansion of livestock production and heightened consumer awareness. In summary, the multifaceted advantages of eubiotics, combined with evolving consumer preferences and regulatory pressures, are driving their demand across diverse industries worldwide.
Eubiotics Market Trend Analysis
Increasing Awareness About Feed Quality and Safety
- The rising consciousness regarding the quality and safety of animal feed stands as a pivotal driver for the eubiotics market. With escalating concerns about food safety and the ecological impact of livestock farming on human health, consumers, regulatory bodies, and industry players are increasingly prioritizing measures to ensure the safety and standard of animal feed.
- Eubiotics emerge as a crucial solution in this context, offering natural and sustainable substitutes to conventional feed additives like antibiotics and synthetic growth enhancers. By fostering gut health and enhancing nutrient absorption in livestock, eubiotics contribute significantly to the production of safer and superior-quality animal products.
- Consumers gain a deeper understanding of the interplay between animal feed, animal welfare, and food safety, and there arises a growing demand for transparency and accountability across the feed supply chain. This shift towards clean-label and eco-friendly products further propels the adoption of eubiotics, which are perceived as safer and more environmentally conscious alternatives.
Rising Demand for Safe and Sustainable Food
- The rising demand for safe and sustainable food provides a significant opportunity for the eubiotics market. Consumers are increasingly concerned about the safety and sustainability of their food choices, leading to a preference for products produced using environmentally friendly practices. Eubiotics, including probiotics, prebiotics, organic acids, and essential oils, offer a natural and safe alternative to conventional additives in animal nutrition.
- Consumers seek assurances regarding the origin and production methods of their food, there is a growing inclination towards products that promote animal health and welfare while maintaining safety and environmental sustainability. Eubiotics play a pivotal role in meeting these expectations by enhancing gut health, optimizing nutrient absorption, and reducing reliance on antibiotics in livestock farming.
- Adoption of eubiotics aligns with regulatory initiatives aimed at fostering sustainable agriculture and minimizing the environmental footprint of food production. Companies that can leverage this trend by providing innovative eubiotic solutions tailored to modern consumer preferences are poised to capitalize on the escalating demand for safe and sustainable food options.
Eubiotics Market Segment Analysis:
Eubiotics Market Segmented on the basis of type, application, and end-users.
By Type, Probiotics segment is expected to dominate the market during the forecast period
- The probiotics segment is anticipated to lead the eubiotics market due to several compelling factors. Firstly, there's a growing acknowledgment of the significance of gut health in both human and animal nutrition. Probiotics, comprising beneficial live microorganisms, are widely recognized for their capacity to restore and maintain a balanced gut microbiome, resulting in enhanced digestion, immune function, and overall health.
- Increasing consumer awareness of the potential health advantages associated with probiotics has spurred demand across various sectors, including functional foods, dietary supplements, and animal feed. With a rising focus on preventive healthcare and natural remedies, probiotics are increasingly sought after as a safe and effective means to support well-being.
- Stringent regulations limiting antibiotic usage in animal feed have reinforced the demand for probiotics as safer and more sustainable alternatives. As livestock producers strive to enhance animal performance and fulfill consumer preferences for antibiotic-free products, the adoption of probiotics continues to escalate.
By Livestock, Poultry segment is expected to dominate the market during the forecast period
- The livestock and poultry segment is poised to dominate the eubiotics market for several reasons. Firstly, with the global population steadily increasing, there's a growing demand for protein-rich foods like meat and eggs, driving the need for effective solutions to improve animal health and productivity in these sectors.
- Concerns regarding disease management, antibiotic resistance, and environmental sustainability have heightened the appeal of eubiotics. These natural additives offer a sustainable approach to enhancing gut health, and nutrient absorption, and reducing antibiotic dependency in livestock and poultry farming, making them increasingly attractive to both producers and consumers.
- Regulatory restrictions on antibiotic use in animal feed further bolster the demand for eubiotics as safer alternatives. Given their proven efficacy in improving animal performance and well-being, eubiotics are poised to play a pivotal role in shaping the future of livestock and poultry production, thus cementing their expected dominance in the eubiotics market.
Eubiotics Market Regional Insights:
Asia Pacific is Expected to Dominate the Market Over the Forecast period
- The Asia-Pacific region is poised to lead the eubiotics market for several reasons. Rapid urbanization and economic expansion in nations such as China, India, and Southeast Asian countries are reshaping dietary preferences and consumer behaviors. With a growing middle class and rising incomes, there's a heightened demand for protein-rich foods, particularly meat and dairy.
- The Asia-Pacific region boasts a significant share of the global livestock population, encompassing poultry, swine, and ruminants. As the appetite for animal protein grows, so does the adoption of eubiotics to bolster animal health, productivity, and growth.
- Regulatory initiatives to curb antibiotic usage in animal feed are gaining momentum across the region, creating conducive conditions for the uptake of eubiotics as safer alternatives. Furthermore, increasing awareness among farmers and livestock producers regarding the advantages of eubiotics further propels market expansion in the area.
- The Asia-Pacific region is experiencing significant growth in the eubiotics market due to ongoing research and development, collaborations between industry players, academic institutions, and government agencies, and diverse agricultural landscapes and farming practices. This has led to market players expanding their presence and operations in this dynamic region to capitalize on the immense growth potential of the eubiotics market.
Eubiotics Market Top Key Players:
- Novus International, Inc. (US)
- UAS Laboratories (US)
- Advanced BioNutrition Corp (US)
- Kemin Industries, Inc. (US)
- DuPont de Nemours, Inc. (US)
- Cargill, Incorporated (US)
- ADM Animal Nutrition (US)
- Alltech, Inc. (US)
- Lallemand, Inc. (Canada)
- BENEO (Germany)
- Evonik Industries AG (Germany)
- BASF SE (Germany)
- Berg & Schmidt GmbH & Co. KG (Germany)
- Associated British Foods plc (UK)
- Nutreco N.V. (Netherlands)
- Orffa International Holding B.V. (Netherlands)
- DSM (Netherlands)
- Bluestar Adisseo Co. (France)
- Adisseo France SAS (France)
- Lesaffre Group (France)
- Pancosma SA (Switzerland)
- Novozymes (Denmark)
- Chr. Hansen Holding A/S (Denmark)
- BEHN MEYER (Singapore)
- Calpis Co., Ltd. (Japan), and Other Active Players.
Key Industry Developments in the Eubiotics Market:
- In January 2023, Cargill and BASF announced an expansion of their partnership in feed enzyme distribution and development to encompass the United States. This move aims to create a joint innovation pipeline to support the needs of the region's animal protein producers. With the growing demand for animal protein, producers are facing challenges in meeting consumer needs, prompting the companies to join forces in addressing these demands through collaborative efforts.
|
Global Eubiotics Market |
|||
|
Base Year: |
2024 |
Forecast Period: |
2025-2032 |
|
Historical Data: |
2018 to 2023 |
Market Size in 2024: |
USD 5.95 Bn. |
|
Forecast Period 2024-32 CAGR: |
8.9 % |
Market Size in 2032: |
USD 11.77 Bn. |
|
Segments Covered: |
By Type |
|
|
|
By Livestock |
|
||
|
By Function |
|
||
|
By Form |
|
||
|
By Region |
|
||
|
Key Market Drivers: |
|
||
|
Key Market Restraints: |
|
||
|
Key Opportunities: |
|
||
|
Companies Covered in the Report: |
|
||
Chapter 1: Introduction
1.1 Scope and Coverage
Chapter 2:Executive Summary
Chapter 3: Market Landscape
3.1 Market Dynamics
3.1.1 Drivers
3.1.2 Restraints
3.1.3 Opportunities
3.1.4 Challenges
3.2 Market Trend Analysis
3.3 PESTLE Analysis
3.4 Porter's Five Forces Analysis
3.5 Industry Value Chain Analysis
3.6 Ecosystem
3.7 Regulatory Landscape
3.8 Price Trend Analysis
3.9 Patent Analysis
3.10 Technology Evolution
3.11 Investment Pockets
3.12 Import-Export Analysis
Chapter 4: Eubiotics Market by Type (2018-2032)
4.1 Eubiotics Market Snapshot and Growth Engine
4.2 Market Overview
4.3 Prebiotics
4.3.1 Introduction and Market Overview
4.3.2 Historic and Forecasted Market Size in Value USD and Volume Units
4.3.3 Key Market Trends, Growth Factors, and Opportunities
4.3.4 Geographic Segmentation Analysis
4.4 Probiotics
4.5 Organic Acids
4.6 Essential Oils
Chapter 5: Eubiotics Market by Livestock (2018-2032)
5.1 Eubiotics Market Snapshot and Growth Engine
5.2 Market Overview
5.3 Swine
5.3.1 Introduction and Market Overview
5.3.2 Historic and Forecasted Market Size in Value USD and Volume Units
5.3.3 Key Market Trends, Growth Factors, and Opportunities
5.3.4 Geographic Segmentation Analysis
5.4 Poultry
5.5 Ruminants
5.6 Aquatic Animals
Chapter 6: Eubiotics Market by Function (2018-2032)
6.1 Eubiotics Market Snapshot and Growth Engine
6.2 Market Overview
6.3 Nutrition & Gut Health
6.3.1 Introduction and Market Overview
6.3.2 Historic and Forecasted Market Size in Value USD and Volume Units
6.3.3 Key Market Trends, Growth Factors, and Opportunities
6.3.4 Geographic Segmentation Analysis
6.4 Yield
6.5 Immunity
6.6 Productivity
Chapter 7: Eubiotics Market by Form (2018-2032)
7.1 Eubiotics Market Snapshot and Growth Engine
7.2 Market Overview
7.3 Liquid
7.3.1 Introduction and Market Overview
7.3.2 Historic and Forecasted Market Size in Value USD and Volume Units
7.3.3 Key Market Trends, Growth Factors, and Opportunities
7.3.4 Geographic Segmentation Analysis
7.4 Dry
7.5 Solid
Chapter 8: Company Profiles and Competitive Analysis
8.1 Competitive Landscape
8.1.1 Competitive Benchmarking
8.1.2 Eubiotics Market Share by Manufacturer (2024)
8.1.3 Industry BCG Matrix
8.1.4 Heat Map Analysis
8.1.5 Mergers and Acquisitions
8.2 PEPSICO INC.
8.2.1 Company Overview
8.2.2 Key Executives
8.2.3 Company Snapshot
8.2.4 Role of the Company in the Market
8.2.5 Sustainability and Social Responsibility
8.2.6 Operating Business Segments
8.2.7 Product Portfolio
8.2.8 Business Performance
8.2.9 Key Strategic Moves and Recent Developments
8.2.10 SWOT Analysis
8.3 WORLD WATERS
8.4 ALL HARMLESS HARV
8.5 MARKET INC.
8.6 CALIWATER LLC
8.7 SIBBERI
8.8 DRINKSEVA
8.9 STEAZ
8.10 THE COCA-COLA COMPANY
8.11 OVIVA MAPLE WATER COMPANY
8.12 ARTY WATER COMPANY
8.13 HAPPY TREE GROUP AND MAJOR KEY PLAYERS
Chapter 9: Global Eubiotics Market By Region
9.1 Overview
9.2. North America Eubiotics Market
9.2.1 Key Market Trends, Growth Factors and Opportunities
9.2.2 Top Key Companies
9.2.3 Historic and Forecasted Market Size by Segments
9.2.4 Historic and Forecasted Market Size by Type
9.2.4.1 Prebiotics
9.2.4.2 Probiotics
9.2.4.3 Organic Acids
9.2.4.4 Essential Oils
9.2.5 Historic and Forecasted Market Size by Livestock
9.2.5.1 Swine
9.2.5.2 Poultry
9.2.5.3 Ruminants
9.2.5.4 Aquatic Animals
9.2.6 Historic and Forecasted Market Size by Function
9.2.6.1 Nutrition & Gut Health
9.2.6.2 Yield
9.2.6.3 Immunity
9.2.6.4 Productivity
9.2.7 Historic and Forecasted Market Size by Form
9.2.7.1 Liquid
9.2.7.2 Dry
9.2.7.3 Solid
9.2.8 Historic and Forecast Market Size by Country
9.2.8.1 US
9.2.8.2 Canada
9.2.8.3 Mexico
9.3. Eastern Europe Eubiotics Market
9.3.1 Key Market Trends, Growth Factors and Opportunities
9.3.2 Top Key Companies
9.3.3 Historic and Forecasted Market Size by Segments
9.3.4 Historic and Forecasted Market Size by Type
9.3.4.1 Prebiotics
9.3.4.2 Probiotics
9.3.4.3 Organic Acids
9.3.4.4 Essential Oils
9.3.5 Historic and Forecasted Market Size by Livestock
9.3.5.1 Swine
9.3.5.2 Poultry
9.3.5.3 Ruminants
9.3.5.4 Aquatic Animals
9.3.6 Historic and Forecasted Market Size by Function
9.3.6.1 Nutrition & Gut Health
9.3.6.2 Yield
9.3.6.3 Immunity
9.3.6.4 Productivity
9.3.7 Historic and Forecasted Market Size by Form
9.3.7.1 Liquid
9.3.7.2 Dry
9.3.7.3 Solid
9.3.8 Historic and Forecast Market Size by Country
9.3.8.1 Russia
9.3.8.2 Bulgaria
9.3.8.3 The Czech Republic
9.3.8.4 Hungary
9.3.8.5 Poland
9.3.8.6 Romania
9.3.8.7 Rest of Eastern Europe
9.4. Western Europe Eubiotics Market
9.4.1 Key Market Trends, Growth Factors and Opportunities
9.4.2 Top Key Companies
9.4.3 Historic and Forecasted Market Size by Segments
9.4.4 Historic and Forecasted Market Size by Type
9.4.4.1 Prebiotics
9.4.4.2 Probiotics
9.4.4.3 Organic Acids
9.4.4.4 Essential Oils
9.4.5 Historic and Forecasted Market Size by Livestock
9.4.5.1 Swine
9.4.5.2 Poultry
9.4.5.3 Ruminants
9.4.5.4 Aquatic Animals
9.4.6 Historic and Forecasted Market Size by Function
9.4.6.1 Nutrition & Gut Health
9.4.6.2 Yield
9.4.6.3 Immunity
9.4.6.4 Productivity
9.4.7 Historic and Forecasted Market Size by Form
9.4.7.1 Liquid
9.4.7.2 Dry
9.4.7.3 Solid
9.4.8 Historic and Forecast Market Size by Country
9.4.8.1 Germany
9.4.8.2 UK
9.4.8.3 France
9.4.8.4 The Netherlands
9.4.8.5 Italy
9.4.8.6 Spain
9.4.8.7 Rest of Western Europe
9.5. Asia Pacific Eubiotics Market
9.5.1 Key Market Trends, Growth Factors and Opportunities
9.5.2 Top Key Companies
9.5.3 Historic and Forecasted Market Size by Segments
9.5.4 Historic and Forecasted Market Size by Type
9.5.4.1 Prebiotics
9.5.4.2 Probiotics
9.5.4.3 Organic Acids
9.5.4.4 Essential Oils
9.5.5 Historic and Forecasted Market Size by Livestock
9.5.5.1 Swine
9.5.5.2 Poultry
9.5.5.3 Ruminants
9.5.5.4 Aquatic Animals
9.5.6 Historic and Forecasted Market Size by Function
9.5.6.1 Nutrition & Gut Health
9.5.6.2 Yield
9.5.6.3 Immunity
9.5.6.4 Productivity
9.5.7 Historic and Forecasted Market Size by Form
9.5.7.1 Liquid
9.5.7.2 Dry
9.5.7.3 Solid
9.5.8 Historic and Forecast Market Size by Country
9.5.8.1 China
9.5.8.2 India
9.5.8.3 Japan
9.5.8.4 South Korea
9.5.8.5 Malaysia
9.5.8.6 Thailand
9.5.8.7 Vietnam
9.5.8.8 The Philippines
9.5.8.9 Australia
9.5.8.10 New Zealand
9.5.8.11 Rest of APAC
9.6. Middle East & Africa Eubiotics Market
9.6.1 Key Market Trends, Growth Factors and Opportunities
9.6.2 Top Key Companies
9.6.3 Historic and Forecasted Market Size by Segments
9.6.4 Historic and Forecasted Market Size by Type
9.6.4.1 Prebiotics
9.6.4.2 Probiotics
9.6.4.3 Organic Acids
9.6.4.4 Essential Oils
9.6.5 Historic and Forecasted Market Size by Livestock
9.6.5.1 Swine
9.6.5.2 Poultry
9.6.5.3 Ruminants
9.6.5.4 Aquatic Animals
9.6.6 Historic and Forecasted Market Size by Function
9.6.6.1 Nutrition & Gut Health
9.6.6.2 Yield
9.6.6.3 Immunity
9.6.6.4 Productivity
9.6.7 Historic and Forecasted Market Size by Form
9.6.7.1 Liquid
9.6.7.2 Dry
9.6.7.3 Solid
9.6.8 Historic and Forecast Market Size by Country
9.6.8.1 Turkiye
9.6.8.2 Bahrain
9.6.8.3 Kuwait
9.6.8.4 Saudi Arabia
9.6.8.5 Qatar
9.6.8.6 UAE
9.6.8.7 Israel
9.6.8.8 South Africa
9.7. South America Eubiotics Market
9.7.1 Key Market Trends, Growth Factors and Opportunities
9.7.2 Top Key Companies
9.7.3 Historic and Forecasted Market Size by Segments
9.7.4 Historic and Forecasted Market Size by Type
9.7.4.1 Prebiotics
9.7.4.2 Probiotics
9.7.4.3 Organic Acids
9.7.4.4 Essential Oils
9.7.5 Historic and Forecasted Market Size by Livestock
9.7.5.1 Swine
9.7.5.2 Poultry
9.7.5.3 Ruminants
9.7.5.4 Aquatic Animals
9.7.6 Historic and Forecasted Market Size by Function
9.7.6.1 Nutrition & Gut Health
9.7.6.2 Yield
9.7.6.3 Immunity
9.7.6.4 Productivity
9.7.7 Historic and Forecasted Market Size by Form
9.7.7.1 Liquid
9.7.7.2 Dry
9.7.7.3 Solid
9.7.8 Historic and Forecast Market Size by Country
9.7.8.1 Brazil
9.7.8.2 Argentina
9.7.8.3 Rest of SA
Chapter 10 Analyst Viewpoint and Conclusion
10.1 Recommendations and Concluding Analysis
10.2 Potential Market Strategies
Chapter 11 Research Methodology
11.1 Research Process
11.2 Primary Research
11.3 Secondary Research
|
Global Eubiotics Market |
|||
|
Base Year: |
2024 |
Forecast Period: |
2025-2032 |
|
Historical Data: |
2018 to 2023 |
Market Size in 2024: |
USD 5.95 Bn. |
|
Forecast Period 2024-32 CAGR: |
8.9 % |
Market Size in 2032: |
USD 11.77 Bn. |
|
Segments Covered: |
By Type |
|
|
|
By Livestock |
|
||
|
By Function |
|
||
|
By Form |
|
||
|
By Region |
|
||
|
Key Market Drivers: |
|
||
|
Key Market Restraints: |
|
||
|
Key Opportunities: |
|
||
|
Companies Covered in the Report: |
|
||


