


Global Enterprise Asset Management (EAM) Market Overview
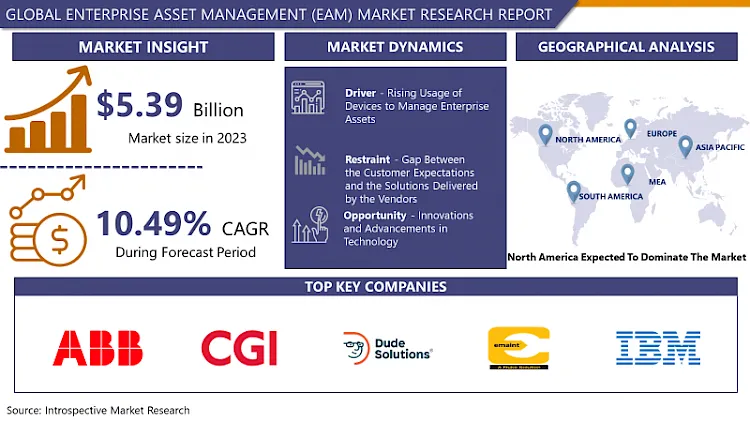
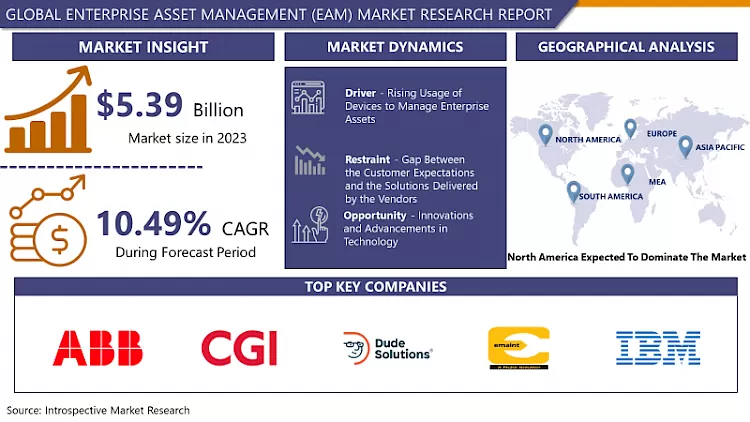
The Global Enterprise Asset Management (EAM) Market size is expected to grow from USD 5.39 billion in 2023 to USD 13.23 billion by 2032, at a CAGR of 10.49% during the forecast period (2024-2032).
Enterprise asset management (EAM) systems emerged in the 1980s as an extension of the Computerized Maintenance Management Systems (CMMS). Enterprise asset management (EAM) systems were designed to substitute manual maintenance systems, and also to satisfy a need to establish robust asset management procedures as the numbers of assets utilized by enterprises grew.
Enterprise asset management (EAM) is a critical business area for any large enterprise that depends on physical assets for production. Furthermore, Enterprise asset management (EAM) refers to a set of tools, software, and practices including Enterprise asset management (EAM) software, that allows organizations to operate productive facility management. Moreover, organizations can productively maintain, control, and analyze their physical assets and infrastructure during all phases of the asset lifecycle, including maintenance, acquisition, and disposal with the help of the comprehensive Enterprise asset management (EAM) process. This wide-range suite of capabilities provides asset managers full transparency into the present and historical state of assets so they can enhance asset quality and utilization, improve uptime, reduce operational costs, and ultimately increase revenue and Rate of Interest. Additionally, Enterprise asset management (EAM) includes work management, asset maintenance, planning and scheduling, supply chain management, and environmental, health and safety initiatives. With the rise in the Internet of Things (IoT) era, with everything from valves to vehicles connected by sensors and systems, practitioners are integrating advanced analytics and artificial intelligence (AI) into enterprise asset management. Moreover, data collected from instrumented assets is evaluated using AI techniques thus, the resulting insights help maintenance teams make better decisions, perform preventive maintenance, elevate efficiency, and maximize investments in their physical assets.
Market Dynamics And Key Factors Of Enterprise Asset Management (EAM) Market
Drivers:
Enterprise asset management, informs maintenance managers regarding the whereabouts of an asset, what are its requirements, who should work on it, and when. Enterprise asset management (EAM) automates critical asset management workflows and makes them accessible and auditable thus, creating centralized asset information. Moreover, to maintain equipment for stable and continuous operations Enterprise asset management (EAM) software supports preventive skills. It helps certify warranty compliance and preempt issues that interrupt production thus, promoting the growth of the Enterprise asset management (EAM) market in the period of forecast. Additionally, AI-powered remote monitoring provides actionable insight into current and anticipated states of assets. It aggregates data across departments and information silos, permitting for fewer, more accurate alerts and enhanced decision-making thus, monitoring data more smartly.
Moreover, historical and real-time data accumulated from IoT devices and analytical and diagnostic tools aids extend the reliability, availability, and usable life of physical assets. Equipment lifecycles of aging assets are extended through more informed maintenance strategies and by incorporating risk management into business processes to enhance return on investment thus, driving the development of the Enterprise asset management (EAM) market throughout forecast. Furthermore, IoT, AI, and analytics elevate equipment maintenance practices. Additionally, due to the use of AI and IoT, asset traceability and tracking meet increasingly complex environmental, health and safety demands. Enterprise asset management (EAM) aids in establishing a single technology system to manage virtually all asset types. Furthermore, processes are integrated and standardized for wide-ranging asset functions across an enterprise thus, strengthening the expansion of the Enterprise asset management (EAM) market during the forecast period.
Restraints:
Many enterprises suffer from a lack of understanding of the inherent design capabilities of their assets and secondly, how best to utilize within their ranges to increase the asset life cycle. For some assets, operating below or above the design range may negatively affect the life of the asset thus retarding the Enterprise asset management (EAM) market development. Moreover, during the functional phase of assets, there are many issues regarding the maintenance such as over maintenance and under maintenance, these both issues can incur huge costs thus, restricting the growth of the Enterprise asset management (EAM) market growth. With the rise in the adoption of cloud-based solutions, there has been a significant rise in cyber-attacks. As cloud-based solutions require the transfer of data from the field to the cloud, the chances of malicious attacks on servers, networks, and communication channels increase thus, hampering the growth of the Enterprise asset management (EAM) market. Furthermore, the gap between the customer expectations and the solutions delivered by the vendors is one of the major factors hindering the Enterprise asset management (EAM) market expansion during the forecast period.
Market Segmentation
Depending on the Component, the solutions segment is anticipated to have the highest share of the enterprise asset management (EAM) market. The rapid growth in the demand for advanced solutions for robust and cost-effective Enterprise asset management (EAM) systems and the growing inclination of the enterprises towards controlling cost with lesser maintenance are the main factors driving the growth of this segment. Additionally, an increase in the production hours and increased asset life is further promoting the growth of this segment.
Depending on the Technology Used, the Enterprise asset management (EAM) market is segmented into cloud-based and on-premises technology. Cloud-based technology is anticipated to dominate the market in the period of forecast owing to the low implementation cost and very fast implementation by the provider. Moreover, storage options can be extended according to the needs without any problem. Automatic updates are provided by the vendors therefore, no need for the IT department to worry about maintenance or payment for future upgrades. With remote access, employees can access the information wherever they are and uses less energy as compared to traditional data centers. Furthermore, there is no need to implement hardware and components that can take hours or days to install on the premises.
Depending on Enterprise Type, large enterprises are predicted to lead the Enterprise asset management (EAM) market. Large enterprises are involved in many businesses and to maintain a proper record of business-related work they are opting for solutions provided by the enterprise asset management. Many problems related to logistics, frequency of workers as well to enhance the life cycle of the asset, large enterprises are incorporating the usage of Enterprise asset management (EAM) systems. The small enterprise segment is projected to expand at the highest growth rate in the forecast period owing to the rise in the number of small enterprises and the growing demand for Enterprise asset management (EAM) among them. To ensure proper usage of assets and to increase assets life expectancy, small enterprises are incorporating the usage of the Enterprise asset management (EAM) system.
Depending on the Function, the asset lifecycle management segment is expected to grow at a significant rate. As asset management and utilization is an important task for the enterprises and to cut down the cost involved in the purchase of new physical assets, asset lifecycle management plays an important role thus, stimulating the growth of this segment.
Depending on the End-User, the transportation segment is predicted to expand at the highest growth rate owing to the rapid growth in the demand for connected automated vehicles. Moreover, with the global enterprise's transition to industry 4.0, smart manufacturing, and the rise in the number of electronic contents per vehicle are driving the growth of this segment.
Players Covered in Enterprise Asset Management (EAM) market are :
- ABB (Switzerland)
- CGI Inc. (Canada)
- Dude Solutions Inc. (US)
- eMaint Enterprises LLC (US)
- IBM Corporation (US)
- IFS AB (Sweden)
- Infor (US)
- Oracle Corporation (US)
- Ramco Systems Ltd. (Chennai)
- SAP SE (Germany)
- Schneider Electric SA (France)
- IPS (Germany)
- Accruent (US)
- AVEVA Group plc (UK)
- Aptean (US)
- Professional Datasolutions Inc (US)
- AssetWorks LLC (US)
- Ultimo Software Solutions Inc (US)
- EZOfficeInventory (US)
- AssetInfinity (India)
- InnoMaint Software (India)
- Aladinme (UAE)
- Limble (US)
- Redlist (US)
- TrackX (US)
- Cheqroom (Belgium)
- The Asset Guardian (Canada)
- GoCodes (US)
- Fleetio (US)
- Upkeep Maintenance Management (US) and other major players.
Regional Analysis of Enterprise asset management (EAM) Market:
North America region is forecasted to dominate the enterprise asset management (EAM) market owing to the presence of major players, rise in the adoption of advanced technologies and the investments by governments to develop advanced technologies are some major factors promoting the growth of Enterprise asset management (EAM) market in this region. Moreover, the favorable conditions for the emergence of new private businesses are fueling the growth of the market in this region.
Asia-Pacific region is expected to grow at the highest growth rate owing to the high investments and the growing demand for automation technology. Moreover, due to the presence of a highly developed IT sector and a rapid rise in cloud-based solutions is driving the growth of the market in countries such as China, Japan, India, and Australia. The rise in the number of enterprise asset management (EAM) providers and to meet the stringent regulatory compliances are some factors stimulating the market growth.
Europe region is estimated to grow at a significant growth rate owing to the rapid adoption of enterprise asset management (EAM) systems in this region. The growing awareness about the beneficial effects of Enterprise asset management (EAM) in this region and the readiness for adoption shown by the major small and large companies are the major factors strengthening the expansion of the market in this region.
Key Industry Developments in Enterprise Asset Management (EAM) Market
- In March 2023, OpenGov, a leading cloud software provider, launched its Enterprise Asset Management Software, which focuses on GIS-based asset tracking, work order management, and infrastructure maintenance for public agencies in the U.S. The software has become increasingly important due to national issues of deferred maintenance and the Infrastructure Investment and Jobs Act, offering significant opportunities for the "EAM" space.
- In December 2022, Hexagon's Asset Lifecycle Intelligence division released HxGN EAM v12, the latest version of its SaaS-based Enterprise Asset Management product. The update includes an expansion of the Asset Performance Management module with Root Cause Analysis features, the ability to calculate and visualize Asset Investment Planning with EcoSys, and enhanced capabilities for HxGN EAM Digital Work Mobile.
|
Global Enterprise Asset Management (EAM) Market |
|||
|
Base Year: |
2022 |
Forecast Period: |
2023-2030 |
|
Historical Data: |
2017 to 2030 |
Market Size in 2023: |
USD 5.39 Bn. |
|
Forecast Period 2023-32 CAGR: |
10.49% |
Market Size in 2030: |
USD 13.23 Bn. |
|
Segments Covered: |
By Component |
|
|
|
By Deployment Type |
|
||
|
By Enterprise Size |
|
||
|
By End Users |
|
||
|
By Region |
|
||
|
Key Market Drivers: |
|
||
|
Key Market Restraints: |
|
||
|
Key Opportunities: |
|
||
|
Companies Covered in the report: |
|
||
1.1 Scope and Coverage
Chapter 2:Executive Summary
Chapter 3: Market Landscape
3.1 Market Dynamics
3.1.1 Drivers
3.1.2 Restraints
3.1.3 Opportunities
3.1.4 Challenges
3.2 Market Trend Analysis
3.3 PESTLE Analysis
3.4 Porter's Five Forces Analysis
3.5 Industry Value Chain Analysis
3.6 Ecosystem
3.7 Regulatory Landscape
3.8 Price Trend Analysis
3.9 Patent Analysis
3.10 Technology Evolution
3.11 Investment Pockets
3.12 Import-Export Analysis
Chapter 4: Enterprise Asset Management (EAM) Market by Component (2018-2032)
4.1 Enterprise Asset Management (EAM) Market Snapshot and Growth Engine
4.2 Market Overview
4.3 Solutions
4.3.1 Introduction and Market Overview
4.3.2 Historic and Forecasted Market Size in Value USD and Volume Units
4.3.3 Key Market Trends, Growth Factors, and Opportunities
4.3.4 Geographic Segmentation Analysis
4.4 Services
Chapter 5: Enterprise Asset Management (EAM) Market by Deployment Type (2018-2032)
5.1 Enterprise Asset Management (EAM) Market Snapshot and Growth Engine
5.2 Market Overview
5.3 Cloud-Based
5.3.1 Introduction and Market Overview
5.3.2 Historic and Forecasted Market Size in Value USD and Volume Units
5.3.3 Key Market Trends, Growth Factors, and Opportunities
5.3.4 Geographic Segmentation Analysis
5.4 On-Premise
Chapter 6: Enterprise Asset Management (EAM) Market by Enterprise Size (2018-2032)
6.1 Enterprise Asset Management (EAM) Market Snapshot and Growth Engine
6.2 Market Overview
6.3 Large Enterprises
6.3.1 Introduction and Market Overview
6.3.2 Historic and Forecasted Market Size in Value USD and Volume Units
6.3.3 Key Market Trends, Growth Factors, and Opportunities
6.3.4 Geographic Segmentation Analysis
6.4 SMEs
Chapter 7: Enterprise Asset Management (EAM) Market by End Users (2018-2032)
7.1 Enterprise Asset Management (EAM) Market Snapshot and Growth Engine
7.2 Market Overview
7.3 Energy & Utilities
7.3.1 Introduction and Market Overview
7.3.2 Historic and Forecasted Market Size in Value USD and Volume Units
7.3.3 Key Market Trends, Growth Factors, and Opportunities
7.3.4 Geographic Segmentation Analysis
7.4 Chemicals
7.5 Petroleum & Mining
7.6 Manufacturing
7.7 Others
Chapter 8: Company Profiles and Competitive Analysis
8.1 Competitive Landscape
8.1.1 Competitive Benchmarking
8.1.2 Enterprise Asset Management (EAM) Market Share by Manufacturer (2024)
8.1.3 Industry BCG Matrix
8.1.4 Heat Map Analysis
8.1.5 Mergers and Acquisitions
8.2 BASF SE (GERMANY)
8.2.1 Company Overview
8.2.2 Key Executives
8.2.3 Company Snapshot
8.2.4 Role of the Company in the Market
8.2.5 Sustainability and Social Responsibility
8.2.6 Operating Business Segments
8.2.7 Product Portfolio
8.2.8 Business Performance
8.2.9 Key Strategic Moves and Recent Developments
8.2.10 SWOT Analysis
8.3 CDTI ADVANCED MATERIALS INC. (U. S)
8.4 CONTINENTAL AG (GERMANY)
8.5 EBERSPÄCHER (GERMANY)
8.6 FAURECIA (FRANCE)
8.7 BOSAL (BELGIUM)
8.8 YUTAKA GIKEN COMPANY LIMITED (JAPAN)
8.9 SEJONG INDUSTRIAL CO. LTD (KOREA)
8.10 MARELLI EUROPE S.P.A (ITALY)
8.11 SANGO CO. LTD (JAPAN)
8.12 TENNECO INC (U. S)
Chapter 9: Global Enterprise Asset Management (EAM) Market By Region
9.1 Overview
9.2. North America Enterprise Asset Management (EAM) Market
9.2.1 Key Market Trends, Growth Factors and Opportunities
9.2.2 Top Key Companies
9.2.3 Historic and Forecasted Market Size by Segments
9.2.4 Historic and Forecasted Market Size by Component
9.2.4.1 Solutions
9.2.4.2 Services
9.2.5 Historic and Forecasted Market Size by Deployment Type
9.2.5.1 Cloud-Based
9.2.5.2 On-Premise
9.2.6 Historic and Forecasted Market Size by Enterprise Size
9.2.6.1 Large Enterprises
9.2.6.2 SMEs
9.2.7 Historic and Forecasted Market Size by End Users
9.2.7.1 Energy & Utilities
9.2.7.2 Chemicals
9.2.7.3 Petroleum & Mining
9.2.7.4 Manufacturing
9.2.7.5 Others
9.2.8 Historic and Forecast Market Size by Country
9.2.8.1 US
9.2.8.2 Canada
9.2.8.3 Mexico
9.3. Eastern Europe Enterprise Asset Management (EAM) Market
9.3.1 Key Market Trends, Growth Factors and Opportunities
9.3.2 Top Key Companies
9.3.3 Historic and Forecasted Market Size by Segments
9.3.4 Historic and Forecasted Market Size by Component
9.3.4.1 Solutions
9.3.4.2 Services
9.3.5 Historic and Forecasted Market Size by Deployment Type
9.3.5.1 Cloud-Based
9.3.5.2 On-Premise
9.3.6 Historic and Forecasted Market Size by Enterprise Size
9.3.6.1 Large Enterprises
9.3.6.2 SMEs
9.3.7 Historic and Forecasted Market Size by End Users
9.3.7.1 Energy & Utilities
9.3.7.2 Chemicals
9.3.7.3 Petroleum & Mining
9.3.7.4 Manufacturing
9.3.7.5 Others
9.3.8 Historic and Forecast Market Size by Country
9.3.8.1 Russia
9.3.8.2 Bulgaria
9.3.8.3 The Czech Republic
9.3.8.4 Hungary
9.3.8.5 Poland
9.3.8.6 Romania
9.3.8.7 Rest of Eastern Europe
9.4. Western Europe Enterprise Asset Management (EAM) Market
9.4.1 Key Market Trends, Growth Factors and Opportunities
9.4.2 Top Key Companies
9.4.3 Historic and Forecasted Market Size by Segments
9.4.4 Historic and Forecasted Market Size by Component
9.4.4.1 Solutions
9.4.4.2 Services
9.4.5 Historic and Forecasted Market Size by Deployment Type
9.4.5.1 Cloud-Based
9.4.5.2 On-Premise
9.4.6 Historic and Forecasted Market Size by Enterprise Size
9.4.6.1 Large Enterprises
9.4.6.2 SMEs
9.4.7 Historic and Forecasted Market Size by End Users
9.4.7.1 Energy & Utilities
9.4.7.2 Chemicals
9.4.7.3 Petroleum & Mining
9.4.7.4 Manufacturing
9.4.7.5 Others
9.4.8 Historic and Forecast Market Size by Country
9.4.8.1 Germany
9.4.8.2 UK
9.4.8.3 France
9.4.8.4 The Netherlands
9.4.8.5 Italy
9.4.8.6 Spain
9.4.8.7 Rest of Western Europe
9.5. Asia Pacific Enterprise Asset Management (EAM) Market
9.5.1 Key Market Trends, Growth Factors and Opportunities
9.5.2 Top Key Companies
9.5.3 Historic and Forecasted Market Size by Segments
9.5.4 Historic and Forecasted Market Size by Component
9.5.4.1 Solutions
9.5.4.2 Services
9.5.5 Historic and Forecasted Market Size by Deployment Type
9.5.5.1 Cloud-Based
9.5.5.2 On-Premise
9.5.6 Historic and Forecasted Market Size by Enterprise Size
9.5.6.1 Large Enterprises
9.5.6.2 SMEs
9.5.7 Historic and Forecasted Market Size by End Users
9.5.7.1 Energy & Utilities
9.5.7.2 Chemicals
9.5.7.3 Petroleum & Mining
9.5.7.4 Manufacturing
9.5.7.5 Others
9.5.8 Historic and Forecast Market Size by Country
9.5.8.1 China
9.5.8.2 India
9.5.8.3 Japan
9.5.8.4 South Korea
9.5.8.5 Malaysia
9.5.8.6 Thailand
9.5.8.7 Vietnam
9.5.8.8 The Philippines
9.5.8.9 Australia
9.5.8.10 New Zealand
9.5.8.11 Rest of APAC
9.6. Middle East & Africa Enterprise Asset Management (EAM) Market
9.6.1 Key Market Trends, Growth Factors and Opportunities
9.6.2 Top Key Companies
9.6.3 Historic and Forecasted Market Size by Segments
9.6.4 Historic and Forecasted Market Size by Component
9.6.4.1 Solutions
9.6.4.2 Services
9.6.5 Historic and Forecasted Market Size by Deployment Type
9.6.5.1 Cloud-Based
9.6.5.2 On-Premise
9.6.6 Historic and Forecasted Market Size by Enterprise Size
9.6.6.1 Large Enterprises
9.6.6.2 SMEs
9.6.7 Historic and Forecasted Market Size by End Users
9.6.7.1 Energy & Utilities
9.6.7.2 Chemicals
9.6.7.3 Petroleum & Mining
9.6.7.4 Manufacturing
9.6.7.5 Others
9.6.8 Historic and Forecast Market Size by Country
9.6.8.1 Turkiye
9.6.8.2 Bahrain
9.6.8.3 Kuwait
9.6.8.4 Saudi Arabia
9.6.8.5 Qatar
9.6.8.6 UAE
9.6.8.7 Israel
9.6.8.8 South Africa
9.7. South America Enterprise Asset Management (EAM) Market
9.7.1 Key Market Trends, Growth Factors and Opportunities
9.7.2 Top Key Companies
9.7.3 Historic and Forecasted Market Size by Segments
9.7.4 Historic and Forecasted Market Size by Component
9.7.4.1 Solutions
9.7.4.2 Services
9.7.5 Historic and Forecasted Market Size by Deployment Type
9.7.5.1 Cloud-Based
9.7.5.2 On-Premise
9.7.6 Historic and Forecasted Market Size by Enterprise Size
9.7.6.1 Large Enterprises
9.7.6.2 SMEs
9.7.7 Historic and Forecasted Market Size by End Users
9.7.7.1 Energy & Utilities
9.7.7.2 Chemicals
9.7.7.3 Petroleum & Mining
9.7.7.4 Manufacturing
9.7.7.5 Others
9.7.8 Historic and Forecast Market Size by Country
9.7.8.1 Brazil
9.7.8.2 Argentina
9.7.8.3 Rest of SA
Chapter 10 Analyst Viewpoint and Conclusion
10.1 Recommendations and Concluding Analysis
10.2 Potential Market Strategies
Chapter 11 Research Methodology
11.1 Research Process
11.2 Primary Research
11.3 Secondary Research
|
Global Enterprise Asset Management (EAM) Market |
|||
|
Base Year: |
2022 |
Forecast Period: |
2023-2030 |
|
Historical Data: |
2017 to 2030 |
Market Size in 2023: |
USD 5.39 Bn. |
|
Forecast Period 2023-32 CAGR: |
10.49% |
Market Size in 2030: |
USD 13.23 Bn. |
|
Segments Covered: |
By Component |
|
|
|
By Deployment Type |
|
||
|
By Enterprise Size |
|
||
|
By End Users |
|
||
|
By Region |
|
||
|
Key Market Drivers: |
|
||
|
Key Market Restraints: |
|
||
|
Key Opportunities: |
|
||
|
Companies Covered in the report: |
|
||
Frequently Asked Questions :
The forecast period in the Enterprise Asset Management (EAM) Market research report is 2023-2032.
ABB (Switzerland),CGI Inc. (Canada), Dude Solutions Inc. (US), eMaint Enterprises LLC (US), IBM Corporation (US), IFS AB (Sweden), Infor (US),Oracle Corporation (US), Ramco Systems Ltd. (Chennai), SAP SE (Germany), Schneider Electric SA (France), IPS (Germany), Accruent (US), AVEVA Group plc (UK), Aptean (US), Professional Datasolutions Inc (US), AssetWorks LLC (US), Ultimo Software Solutions Inc (US), EZOfficeInventory (US), AssetInfinity (India), InnoMaint Software (India), Aladinme (UAE), Limble (US), Redlist (US), TrackX (US), Cheqroom (Belgium), The Asset Guardian (Canada), GoCodes (US), Fleetio (US), Upkeep Maintenance Management (US), and other major players.
The Enterprise Asset Management (EAM) Market is segmented into component, deployment model, enterprise size, end users, and region. By Component, the market is categorized into Solutions and Services. By Deployment Type, the market is categorized into Cloud-Based and On-Premise. By Enterprise Size, the market is categorized into Large Enterprises and SMEs. By End Users, the market is categorized into Energy & Utilities, Chemicals, Petroleum & Mining, Manufacturing, and Others. By region, it is analyzed across North America (U.S.; Canada; Mexico), Europe (Germany; U.K.; France; Italy; Russia; Spain, etc.), Asia-Pacific (China; India; Japan; Southeast Asia, etc.), South America (Brazil; Argentina, etc.), Middle East & Africa (Saudi Arabia; South Africa, etc.).
Enterprise asset management (EAM) refers to a set of tools, software, and practices including Enterprise asset management (EAM) software, that allows organizations to operate productive facility management.
The Global Enterprise Asset Management (EAM) Market size is expected to grow from USD 5.39 billion in 2023 to USD 13.23 billion by 2032, at a CAGR of 10.49% during the forecast period (2024-2032).


