


Digital Power Utility Market Synopsis
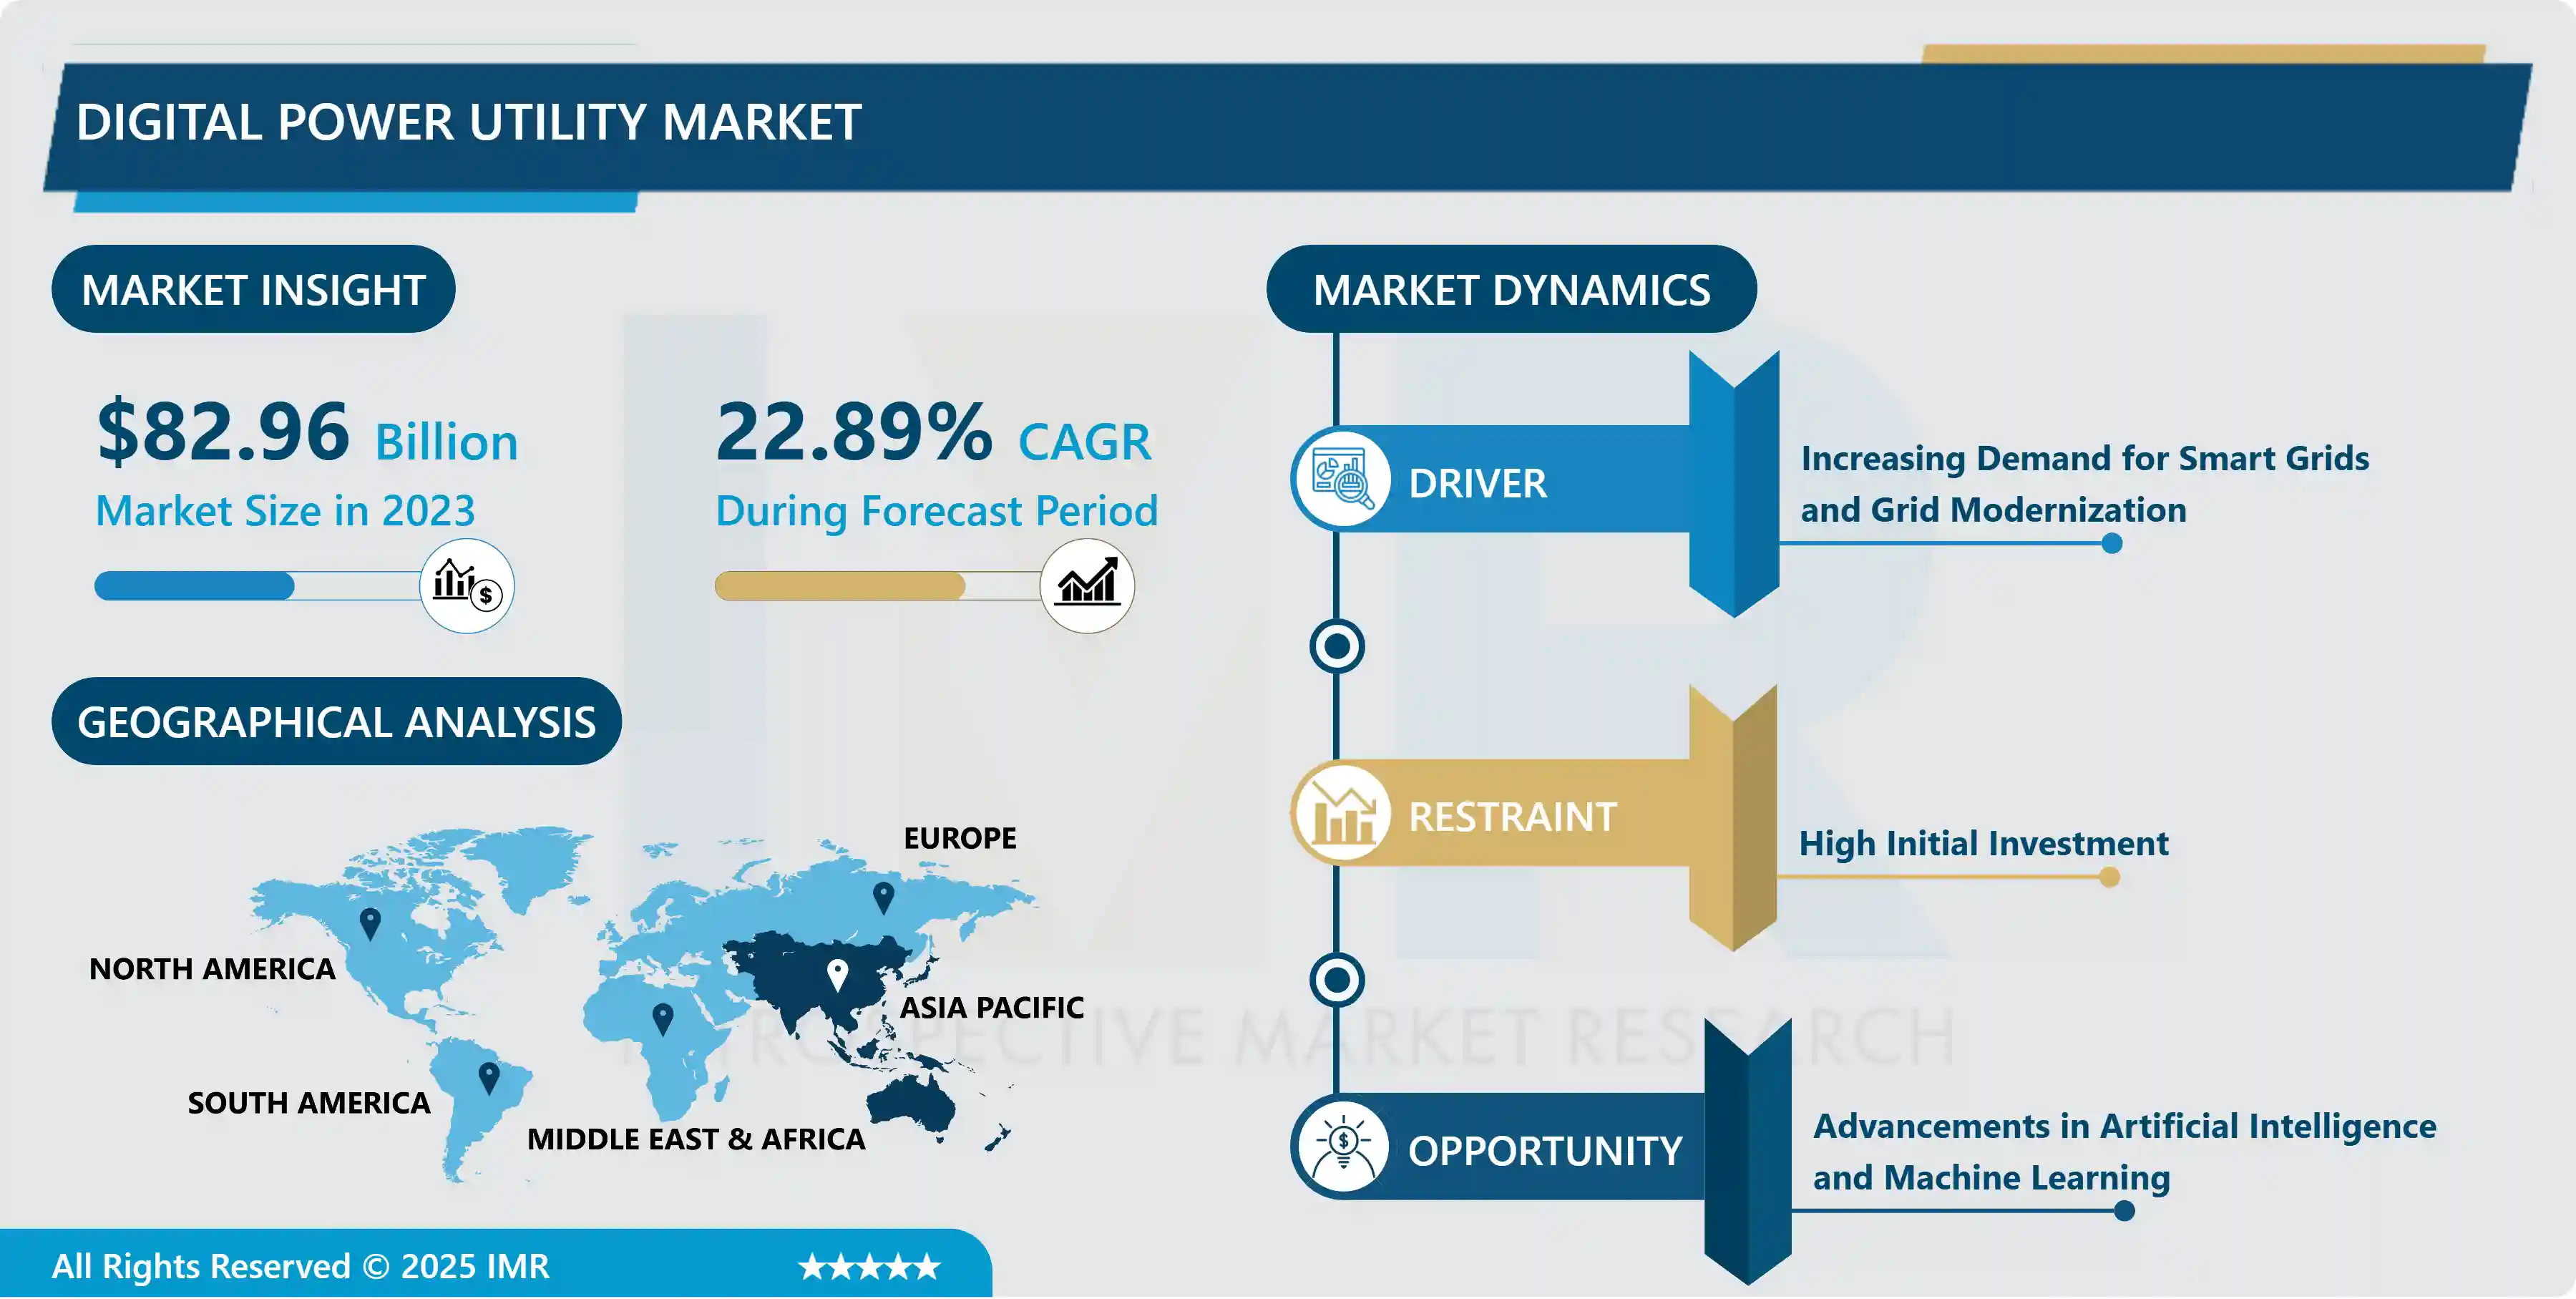
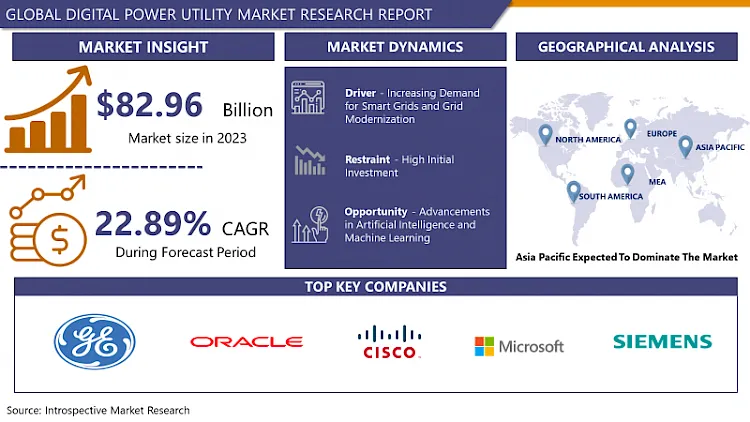
Digital Power Utility Market Size Was Valued at USD 82.96 Billion in 2023 and is Projected to Reach USD 530.3 Billion by 2032, Growing at a CAGR of 22.89% From 2024-2032.
Digital power utilities encompass the integration of advanced technologies, such as cloud computing and Internet of Things applications, into the operations of power generation, transmission, and distribution processes. This transformative approach enables utility companies to optimize their operations, enhance asset management, and improve overall efficiency.
Traditionally viewed as late adopters of technology, power utilities worldwide are undergoing a transformative shift toward digitization. Recent technological advancements in the power sector have encouraged utility companies to embrace digital solutions for optimized operations and enhanced customer satisfaction.
Start-ups and established enterprises now offer technologies and platforms to power producers and utilities, enabling them to decrease costs, increase revenues, and explore new business opportunities. These digital solutions focus on areas such as optimized operation and maintenance, effective asset management, and managing electrical loads, providing tangible benefits for the energy ecosystem.
Digital power utility solutions play a crucial role in overcoming operational challenges in electricity generation, transmission, and distribution, reducing energy losses, and enhancing the overall efficiency of these processes. Real-time asset control, cloud integration, and Internet of Things applications contribute to improved security, storage, and flexibility in power distribution, aligning with the global shift towards sustainable energy practices.
Digital Power Utility Market Trend Analysis
Increasing Demand for Smart Grids and Grid Modernization
- The increasing demand for smart grids and grid modernization in the digital power utility market is primarily driven by the imperative to enhance overall system efficiency and reliability. Traditional power grids face challenges in adapting to dynamic energy demands, incorporating renewable energy sources, and efficiently managing electricity distribution. Smart grids leverage advanced digital technologies to optimize the flow of electricity, monitor and control grid components in real time, and proactively respond to fluctuations in demand. This results in reduced energy losses, improved reliability, and a more resilient power infrastructure, aligning with the industry's pursuit of operational excellence.
- Another crucial driver behind the push for smart grids is the increasing integration of renewable energy sources and the growing emphasis on demand response mechanisms. With a rising share of renewable energy in the power mix, smart grids enable seamless integration by efficiently managing the variability associated with sources like solar and wind. Additionally, these digital systems facilitate demand response programs, allowing utilities to engage consumers in actively managing their energy consumption.
Advancements in Artificial Intelligence and Machine Learning
- Advancements in artificial intelligence (AI) and machine learning (ML) present a significant opportunity for the digital power utility market by enabling predictive maintenance and asset optimization. AI algorithms can analyze vast amounts of data from power generation equipment, predicting potential failures or maintenance needs before they occur. This proactive approach minimizes downtime, enhances asset lifespan, and optimizes overall operational efficiency. Machine learning models can continuously learn from real-time data, adapting to evolving conditions and ensuring that power utilities can maintain a reliable and resilient infrastructure.
- The integration of AI and ML in the digital power utility sector opens avenues for the development of smart grids and efficient energy consumption. AI algorithms can analyze consumption patterns, forecast demand, and dynamically adjust power distribution in real time. Machine learning models can optimize energy routing, balancing the load across the grid and reducing energy losses.
Digital Power Utility Market Segment Analysis:
Digital Power Utility Market Segmented on the basis of Technology, Deployment, and Sector.
By Technology, Hardware segment is expected to dominate the market during the forecast period
- The dominance of the hardware segment in the digital power utility market can be attributed to the ongoing need for infrastructure modernization and substantial investments in physical assets. As power utilities transition towards digitization, there is a critical requirement for upgrading and deploying new hardware components such as sensors, smart meters, and communication devices. These physical technologies form the backbone of the digital ecosystem, facilitating the collection of real-time data and enabling seamless connectivity across the power grid.
- The hardware segment's dominance is further fueled by the integration of Internet of Things (IoT) devices and edge computing technologies. As power utilities implement IoT solutions for monitoring and control, the demand for specialized hardware capable of handling edge computing tasks increases. Edge devices play a crucial role in processing data at the source, reducing latency and improving the overall responsiveness of the digital power utility ecosystem.
By Sector, Power Generation segment held the largest share of 48.5% in 2022
- The power generation segment in the digital power utility market is primarily driven by the increasing integration of renewable energy sources. As the global focus shifts towards sustainable and clean energy, power generation companies are investing significantly in technologies that support the efficient harnessing and integration of renewable sources such as solar and wind. Digital solutions within the power generation segment enable real-time monitoring and optimization of renewable energy assets, ensuring their seamless integration into the power grid.
- Power generation companies are leveraging digital technologies to enhance operational efficiency and grid resilience. Advanced analytics, machine learning, and predictive maintenance in the power generation segment enable proactive identification of equipment failures, reducing downtime and maintenance costs. Digital solutions also facilitate optimal utilization of existing power generation assets, maximizing output while minimizing environmental impact.
Digital Power Utility Market Regional Insights:
Asia Pacific is Expected to Dominate the Market Over the Forecast period
- The dominance and rapid growth of the digital power utility market in the Asia-Pacific (APAC) region can be attributed to significant government investments in renewable energy and grid modernization projects. Many APAC countries, including China and India, have prioritized the transition to sustainable energy sources. Substantial financial commitments from governments to support renewable energy initiatives and modernize power grids create a conducive environment for the adoption of digital power utility technologies.
- The APAC region experiences rapid urbanization and a surge in energy demand driven by economic development. This growth necessitates a resilient and technologically advanced power infrastructure, leading to increased adoption of digital power utilities. Additionally, favorable regulatory policies play a pivotal role in fostering digitalization in the power sector. Governments in the APAC region have recognized the benefits of digital technologies in improving energy efficiency, reducing losses, and meeting environmental goals. Supportive regulatory frameworks encourage utilities to invest in digital solutions, contributing to the region's leadership in the digital power utility market.
- The Below graph shows that the robust surge in energy consumption across the Asia-Pacific region has become a catalyst for the expanding Digital Power Utility Market. As the energy demand continues to rise, the need for advanced technologies in the power sector becomes increasingly evident. This escalating trend underscores the critical role played by digital solutions in enhancing efficiency, reliability, and sustainability within the utility industry. The growing recognition of these benefits is propelling the Digital Power Utility Market to new heights, reflecting the imperative for innovative solutions to meet the evolving energy landscape in the Asia-Pacific region.
Digital Power Utility Market Top Key Players:
- General Electric Company (U.S.)
- Oracle Corporation (U.S.)
- Cisco Systems Inc. (U.S.)
- Microsoft Corporation (U.S.)
- Siemens AG (Germany)
- SAP SE (Germany)
- Accenture plc (Ireland)
- Capgemini SE (France)
- Schneider Electric SE (France)
- ABB Ltd. (Switzerland)
- State Grid Corporation (China)
- China Southern Power Grid (China)
- China National Nuclear (China)
- Huawei Technologies (China)
- China Electronics Corporation (China)
- Nari Group (China)
- Holley Metering (China)
- XinAo Measurement and Control (China)
- Zhejiang Yongtailong Technology (China)
- Toshiba Corporation (Japan)
- Mitsubishi Electric Corporation (Japan)
- Panasonic Corporation (Japan)
- Fujitsu Limited (Japan)
- Yokogawa Electric Corporation (Japan)
Key Industry Developments in the Digital Power Utility Market
- In April 2024, Siemens launched Electrification X, a new addition to its Xcelerator portfolio, to transform aging electrification infrastructure. This dynamic, open, and interoperable portfolio enables seamless digital transformation of electrification infrastructure across commercial, industrial, and utility applications. Customers can access IoT SaaS offerings and software solutions for enhancing energy efficiency, enabling e-mobility, and optimizing industrial energy systems through Electrification X.
- In April 2024, Axel Springer SE and Microsoft Corp. announced an expanded, multifaceted partnership across advertising, AI, content, and cloud computing. The cooperation aims to leverage cutting-edge innovation to support independent journalism around the world.
|
Digital Power Utility Market |
||||
|
Base Year: |
2023 |
Forecast Period: |
2024-2032 |
|
|
Historical Data: |
2017 to 2023 |
Market Size in 2023: |
USD 82.96 Bn |
|
|
CAGR (2024-2032): |
22.89% |
Market Size in 2032: |
USD 530.3 Bn |
|
|
Segments Covered: |
By Technology |
|
|
|
|
By Deployment |
|
|
||
|
By Sector |
|
|
||
|
By Region |
|
|
||
|
Key Market Drivers: |
|
|||
|
Key Market Restraints: |
|
|||
|
Key Opportunities: |
|
|||
|
Companies Covered in the Report: |
|
|||
Chapter 1: Introduction
1.1 Scope and Coverage
Chapter 2:Executive Summary
Chapter 3: Market Landscape
3.1 Market Dynamics
3.1.1 Drivers
3.1.2 Restraints
3.1.3 Opportunities
3.1.4 Challenges
3.2 Market Trend Analysis
3.3 PESTLE Analysis
3.4 Porter's Five Forces Analysis
3.5 Industry Value Chain Analysis
3.6 Ecosystem
3.7 Regulatory Landscape
3.8 Price Trend Analysis
3.9 Patent Analysis
3.10 Technology Evolution
3.11 Investment Pockets
3.12 Import-Export Analysis
Chapter 4: Digital Power Utility Market by Technology (2018-2032)
4.1 Digital Power Utility Market Snapshot and Growth Engine
4.2 Market Overview
4.3 Hardware
4.3.1 Introduction and Market Overview
4.3.2 Historic and Forecasted Market Size in Value USD and Volume Units
4.3.3 Key Market Trends, Growth Factors, and Opportunities
4.3.4 Geographic Segmentation Analysis
4.4 Integrated Solutions
Chapter 5: Digital Power Utility Market by Deployment (2018-2032)
5.1 Digital Power Utility Market Snapshot and Growth Engine
5.2 Market Overview
5.3 On-Premises
5.3.1 Introduction and Market Overview
5.3.2 Historic and Forecasted Market Size in Value USD and Volume Units
5.3.3 Key Market Trends, Growth Factors, and Opportunities
5.3.4 Geographic Segmentation Analysis
5.4 Cloud-Based
Chapter 6: Digital Power Utility Market by Sector (2018-2032)
6.1 Digital Power Utility Market Snapshot and Growth Engine
6.2 Market Overview
6.3 Power Generation
6.3.1 Introduction and Market Overview
6.3.2 Historic and Forecasted Market Size in Value USD and Volume Units
6.3.3 Key Market Trends, Growth Factors, and Opportunities
6.3.4 Geographic Segmentation Analysis
6.4 Transmission and Distribution
6.5 Power Consumption
6.6 Energy Storage
6.7 Energy Trading
Chapter 7: Company Profiles and Competitive Analysis
7.1 Competitive Landscape
7.1.1 Competitive Benchmarking
7.1.2 Digital Power Utility Market Share by Manufacturer (2024)
7.1.3 Industry BCG Matrix
7.1.4 Heat Map Analysis
7.1.5 Mergers and Acquisitions
7.2 ALIVECOR INCBAYER AG
7.2.1 Company Overview
7.2.2 Key Executives
7.2.3 Company Snapshot
7.2.4 Role of the Company in the Market
7.2.5 Sustainability and Social Responsibility
7.2.6 Operating Business Segments
7.2.7 Product Portfolio
7.2.8 Business Performance
7.2.9 Key Strategic Moves and Recent Developments
7.2.10 SWOT Analysis
7.3 EVIDATION HEALTH INCFITBIT INCHAPPIFY HEALTH
7.4 KONINKLIJKE PHILIPS NV
7.5 NEUROTRACK TECHNOLOGIES INCGLAXOSMITHKLINE INCNOVARTIS INTERNATIONAL AG
7.6 F. HOFFMANN-LA ROCHE LTD.
Chapter 8: Global Digital Power Utility Market By Region
8.1 Overview
8.2. North America Digital Power Utility Market
8.2.1 Key Market Trends, Growth Factors and Opportunities
8.2.2 Top Key Companies
8.2.3 Historic and Forecasted Market Size by Segments
8.2.4 Historic and Forecasted Market Size by Technology
8.2.4.1 Hardware
8.2.4.2 Integrated Solutions
8.2.5 Historic and Forecasted Market Size by Deployment
8.2.5.1 On-Premises
8.2.5.2 Cloud-Based
8.2.6 Historic and Forecasted Market Size by Sector
8.2.6.1 Power Generation
8.2.6.2 Transmission and Distribution
8.2.6.3 Power Consumption
8.2.6.4 Energy Storage
8.2.6.5 Energy Trading
8.2.7 Historic and Forecast Market Size by Country
8.2.7.1 US
8.2.7.2 Canada
8.2.7.3 Mexico
8.3. Eastern Europe Digital Power Utility Market
8.3.1 Key Market Trends, Growth Factors and Opportunities
8.3.2 Top Key Companies
8.3.3 Historic and Forecasted Market Size by Segments
8.3.4 Historic and Forecasted Market Size by Technology
8.3.4.1 Hardware
8.3.4.2 Integrated Solutions
8.3.5 Historic and Forecasted Market Size by Deployment
8.3.5.1 On-Premises
8.3.5.2 Cloud-Based
8.3.6 Historic and Forecasted Market Size by Sector
8.3.6.1 Power Generation
8.3.6.2 Transmission and Distribution
8.3.6.3 Power Consumption
8.3.6.4 Energy Storage
8.3.6.5 Energy Trading
8.3.7 Historic and Forecast Market Size by Country
8.3.7.1 Russia
8.3.7.2 Bulgaria
8.3.7.3 The Czech Republic
8.3.7.4 Hungary
8.3.7.5 Poland
8.3.7.6 Romania
8.3.7.7 Rest of Eastern Europe
8.4. Western Europe Digital Power Utility Market
8.4.1 Key Market Trends, Growth Factors and Opportunities
8.4.2 Top Key Companies
8.4.3 Historic and Forecasted Market Size by Segments
8.4.4 Historic and Forecasted Market Size by Technology
8.4.4.1 Hardware
8.4.4.2 Integrated Solutions
8.4.5 Historic and Forecasted Market Size by Deployment
8.4.5.1 On-Premises
8.4.5.2 Cloud-Based
8.4.6 Historic and Forecasted Market Size by Sector
8.4.6.1 Power Generation
8.4.6.2 Transmission and Distribution
8.4.6.3 Power Consumption
8.4.6.4 Energy Storage
8.4.6.5 Energy Trading
8.4.7 Historic and Forecast Market Size by Country
8.4.7.1 Germany
8.4.7.2 UK
8.4.7.3 France
8.4.7.4 The Netherlands
8.4.7.5 Italy
8.4.7.6 Spain
8.4.7.7 Rest of Western Europe
8.5. Asia Pacific Digital Power Utility Market
8.5.1 Key Market Trends, Growth Factors and Opportunities
8.5.2 Top Key Companies
8.5.3 Historic and Forecasted Market Size by Segments
8.5.4 Historic and Forecasted Market Size by Technology
8.5.4.1 Hardware
8.5.4.2 Integrated Solutions
8.5.5 Historic and Forecasted Market Size by Deployment
8.5.5.1 On-Premises
8.5.5.2 Cloud-Based
8.5.6 Historic and Forecasted Market Size by Sector
8.5.6.1 Power Generation
8.5.6.2 Transmission and Distribution
8.5.6.3 Power Consumption
8.5.6.4 Energy Storage
8.5.6.5 Energy Trading
8.5.7 Historic and Forecast Market Size by Country
8.5.7.1 China
8.5.7.2 India
8.5.7.3 Japan
8.5.7.4 South Korea
8.5.7.5 Malaysia
8.5.7.6 Thailand
8.5.7.7 Vietnam
8.5.7.8 The Philippines
8.5.7.9 Australia
8.5.7.10 New Zealand
8.5.7.11 Rest of APAC
8.6. Middle East & Africa Digital Power Utility Market
8.6.1 Key Market Trends, Growth Factors and Opportunities
8.6.2 Top Key Companies
8.6.3 Historic and Forecasted Market Size by Segments
8.6.4 Historic and Forecasted Market Size by Technology
8.6.4.1 Hardware
8.6.4.2 Integrated Solutions
8.6.5 Historic and Forecasted Market Size by Deployment
8.6.5.1 On-Premises
8.6.5.2 Cloud-Based
8.6.6 Historic and Forecasted Market Size by Sector
8.6.6.1 Power Generation
8.6.6.2 Transmission and Distribution
8.6.6.3 Power Consumption
8.6.6.4 Energy Storage
8.6.6.5 Energy Trading
8.6.7 Historic and Forecast Market Size by Country
8.6.7.1 Turkiye
8.6.7.2 Bahrain
8.6.7.3 Kuwait
8.6.7.4 Saudi Arabia
8.6.7.5 Qatar
8.6.7.6 UAE
8.6.7.7 Israel
8.6.7.8 South Africa
8.7. South America Digital Power Utility Market
8.7.1 Key Market Trends, Growth Factors and Opportunities
8.7.2 Top Key Companies
8.7.3 Historic and Forecasted Market Size by Segments
8.7.4 Historic and Forecasted Market Size by Technology
8.7.4.1 Hardware
8.7.4.2 Integrated Solutions
8.7.5 Historic and Forecasted Market Size by Deployment
8.7.5.1 On-Premises
8.7.5.2 Cloud-Based
8.7.6 Historic and Forecasted Market Size by Sector
8.7.6.1 Power Generation
8.7.6.2 Transmission and Distribution
8.7.6.3 Power Consumption
8.7.6.4 Energy Storage
8.7.6.5 Energy Trading
8.7.7 Historic and Forecast Market Size by Country
8.7.7.1 Brazil
8.7.7.2 Argentina
8.7.7.3 Rest of SA
Chapter 9 Analyst Viewpoint and Conclusion
9.1 Recommendations and Concluding Analysis
9.2 Potential Market Strategies
Chapter 10 Research Methodology
10.1 Research Process
10.2 Primary Research
10.3 Secondary Research
|
Digital Power Utility Market |
||||
|
Base Year: |
2023 |
Forecast Period: |
2024-2032 |
|
|
Historical Data: |
2017 to 2023 |
Market Size in 2023: |
USD 82.96 Bn |
|
|
CAGR (2024-2032): |
22.89% |
Market Size in 2032: |
USD 530.3 Bn |
|
|
Segments Covered: |
By Technology |
|
|
|
|
By Deployment |
|
|
||
|
By Sector |
|
|
||
|
By Region |
|
|
||
|
Key Market Drivers: |
|
|||
|
Key Market Restraints: |
|
|||
|
Key Opportunities: |
|
|||
|
Companies Covered in the Report: |
|
|||


