


Global Blood Urea Nitrogen Diagnostics Market Overview
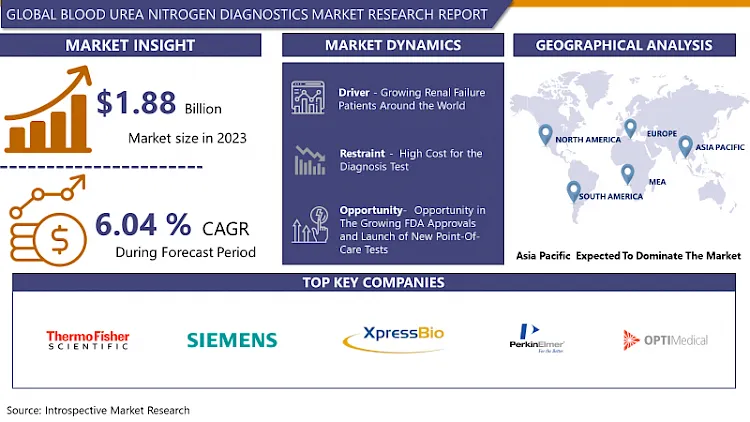
The Global Blood Urea Nitrogen Diagnostics Market size is expected to grow from USD 1.99 billion in 2024 to USD 3.19 billion by 2032, at a CAGR of 6.04 % during the forecast period (2025-2032).
A blood urea nitrogen (BUN) test assesses the concentration of urea nitrogen in the bloodstream. Urea nitrogen is a byproduct resulting from the breakdown of proteins in the diet, synthesized in the liver, and transported through the blood to the kidneys for filtration and elimination. This test is frequently included in a comprehensive metabolic panel, a set of diagnostic tests. Its primary purpose is to aid in the detection and monitoring of kidney diseases or disorders.
By measuring the BUN levels, healthcare providers can gather valuable insights into kidney function. Elevated BUN levels may indicate conditions such as acute or chronic kidney disease, dehydration, or heart failure, where kidneys may not effectively filter waste from the blood. Conversely, abnormally low BUN levels could suggest liver disease or malnutrition.
During the BUN test, a blood sample is typically drawn from a vein in the arm. Results are interpreted alongside other tests to provide a comprehensive view of metabolic health. Monitoring BUN levels over time helps healthcare professionals assess kidney function stability or progression of kidney-related conditions, guiding treatment decisions and adjustments in patient care.
In addition to its role in diagnosing and monitoring kidney function, the BUN test also serves as an indicator of overall health and hydration status. Since urea nitrogen is produced from protein breakdown and cleared by the kidneys, abnormal BUN levels can reflect issues beyond kidney function alone.

Market Dynamics And Factors For Blood Urea Nitrogen Diagnostics Market
Blood Urea Nitrogen Diagnostics Market Drivers- Growing Renal Failure Patients Around the World
- In the last few decades increasing the number of kidney failure and kidney disease patients is the major factor that drives the growth of the blood urea nitrogen diagnostic market. Kidney disease includes Fabry disease, cystinosis, glomerulonephritis, IgA nephropathy, lupus nephritis, atypical hemolytic uremic syndrome, and polycystic kidney disease. The blood urea nitrogen diagnostic test is prescribed when any kidney disease suspect in people. This test helps to understand if there is any need to carry out dialysis or not.
- Owing to rising noncommunicable diseases, changing lifestyles, and habits, growing aging population the cases of kidney-diseased patients increased. For instance, about 200,000-350,000 people are affected per year by IgA nephropathy is a common form of primary glomerulonephritis. In the year 2020, 431,288 people were diagnosed with kidney cancer in the world. Diabetes is the leading cause of chronic kidney diseases. In recent years, the prevalence of diabetes is increased. The following figure shows the number of diabetics in the world.Thus, the growing number of kidney disease patients supports the growth of the blood urea nitrogen diagnostics market.
Blood Urea Nitrogen Diagnostics Market Limiting Factors- High Cost for the Diagnosis Test
- The cost associated with the testing equipment is high is the key factor responsible for restricting the market growth. The prices of the kits, chemical reagents, and other instruments required for the blood urea nitrogen diagnostic test are high. Moreover, to perform the diagnostic test, there is a requirement for extra training for technicians which increases the prices of the diagnostic test.
- The new advanced techniques used in the laboratory for the detection of blood urea nitrogen also increase the cost of tests which may hamper the growth of the market.
Blood Urea Nitrogen Diagnostics Market Opportunity- Opportunity in The Growing FDA Approvals and Launch of New Point-Of-Care Tests
- With the rising FDA approvals of the diagnostic test and launching of the novel, point-of-care diagnostics tests will provide a lucrative opportunity for the blood urea nitrogen diagnostics market during the forecast periods. Due to the growing prevalence of renal chronic diseases, the manufacturers of the healthcare sector rising their investment in the research and development of new point-of-care tests for diagnosis.
- For instance, in 2022 Bloom Diagnostic, a manufacturer of medical devices launched a new kidney test product named bloom kidney test. Additionally, the FDA approvals of such a diagnostic test are also increased. For instance, FDA approved the blood urea nitrogen point-of-care tests of Siemens Healthineers. Thus, the rising R&D of point-of-care tests and FDA approvals offers a profitable opportunity for the market in the analysis period.
Segmentation Analysis Of Blood Urea Nitrogen Diagnostics Market
By Test Type, the ELISA test (Enzyme-linked immunosorbent assay) is expected to account for the largest market share in the forecasted period. ELISA is the most ideal test for the detection of urea nitrogen in the blood and it is commonly used in laboratories. The ELISA test has several benefits such as, it has a simple procedure, high specificity, and sensitivity, and high efficiency and cost-effectiveness. Moreover, this test is safe and eco-friendly because there is no requirement for any radioactive substance and a large number of organic solvents. Additionally, the growing research and development investment in the ELISA kit, the rising geriatric population, and growth in the biopharmaceutical and biotechnology industries increase the market share of the ELISA test in the blood urea nitrogen diagnostics.
By Application, the laboratory segment is predicted to have the maximum market share in blood urea nitrogen diagnostics. The blood urea nitrogen diagnostic test is mostly performed in the laboratory. According to the Centers for disease control and prevention, 70% of the decisions of medical are based on the result of the laboratory and nearly 14 billion laboratory tests are ordered annually. Statista stated that in 2020 there were 331 million laboratory tests conducted in Russia’s public as well as private organizations. Owing to the growing prevalence of various chronic diseases the number of diagnostic laboratories and clinical laboratories is increasing. The test performed in the laboratories is safe, accurate, and cost-effective. Thus, the laboratory has the highest market share in blood urea nitrogen diagnostics.
Regional Analysis Of Blood Urea Nitrogen Diagnostics Market
Asia Pacific region is expected to have the largest market share of the Blood Urea Nitrogen Diagnostics market in the projected period. In this region, the largest population suffers from chronic kidney disease. This is due to the growing prevalence of diabetes. Diabetes is the main cause of chronic kidney disease. For instance, according to Statista, in 2021 there were 206 million people in the western pacific and 90 million people in Southeast Asia suffering from diabetes. China and India in this region have the highest population with the fastest aging population. Chronic kidney diseases mostly affected aged people. In addition to this, geographic, climatic, cultural, social, and environmental diversity in this region is higher than in other regions of the world. The large population in this region experienced the climate-related burden of infectious disease. These infectious diseases are the cause of chronic kidney disease. Thus, in the APAC region, the highest number of kidney failure patients and hence require to test urea nitrogen in the blood which supports the growth of the market of this region.
Top Key Players Covered In Blood Urea Nitrogen Diagnostics Market
- Siemens AG (Germany)
- StressMarq Biosciences Inc (Columbia)
- Thermo Fisher Scientific (US)
- Xpress Bio Life Science (US)
- PerkinElmer, Inc. (US)
- OPTI Medical Systems, Inc. (USA)
- Abbott Laboratories (US)
- F. Hoffmann-La Roche AG (Switzerland)
- Danaher Corporation (US)
- Bio-Rad Laboratories, Inc. (US)
- Sysmex Corporation (Japan)
- BioVision Inc. (US)
- Randox Laboratories Ltd. (UK)
- HORIBA, Ltd. (Japan)
- Cutera (USA), and other active players.
Key Industry Development In The Blood Urea Nitrogen Diagnostics Market
- In July 2022, the world's leading provider of scientific services, Thermo Fisher Scientific Inc., is presenting cutting-edge diagnostic technologies, assays, and a full range of solutions for researchers creating new diagnostics. Thermo Fisher is exhibiting in booth #1413 at the 74th American Association for Clinical Chemistry Annual Scientific Meeting and Clinical Laboratory Exposition (AACC 2022), which takes place at the McCormick Place Convention Center in Chicago, July 24-28.
|
Global Blood Urea Nitrogen Diagnostics Market |
|||
|
Base Year: |
2024 |
Forecast Period: |
2025 - 2032 |
|
Historical Data: |
2018 to 2023 |
Market Size in 2024: |
USD 1.99 Bn. |
|
Forecast Period 2024 - 32CAGR: |
6.04 % |
Market Size in 2032: |
USD 3.19 Bn. |
|
Segments Covered: |
By Test Type |
|
|
|
By Application |
|
||
|
By Region |
|
||
|
Key Market Drivers: |
|
||
|
Key Market Restraints: |
|
||
|
Key Opportunities: |
|
||
|
Companies Covered in the report: |
|
||
Chapter 1: Introduction
1.1 Scope and Coverage
Chapter 2:Executive Summary
Chapter 3: Market Landscape
3.1 Market Dynamics
3.1.1 Drivers
3.1.2 Restraints
3.1.3 Opportunities
3.1.4 Challenges
3.2 Market Trend Analysis
3.3 PESTLE Analysis
3.4 Porter's Five Forces Analysis
3.5 Industry Value Chain Analysis
3.6 Ecosystem
3.7 Regulatory Landscape
3.8 Price Trend Analysis
3.9 Patent Analysis
3.10 Technology Evolution
3.11 Investment Pockets
3.12 Import-Export Analysis
Chapter 4: Blood Urea Nitrogen Diagnostics Market by Test Type (2018-2032)
4.1 Blood Urea Nitrogen Diagnostics Market Snapshot and Growth Engine
4.2 Market Overview
4.3 ELISA
4.3.1 Introduction and Market Overview
4.3.2 Historic and Forecasted Market Size in Value USD and Volume Units
4.3.3 Key Market Trends, Growth Factors, and Opportunities
4.3.4 Geographic Segmentation Analysis
4.4 Colorimetric
4.5 Spectrophotometric
Chapter 5: Blood Urea Nitrogen Diagnostics Market by Application (2018-2032)
5.1 Blood Urea Nitrogen Diagnostics Market Snapshot and Growth Engine
5.2 Market Overview
5.3 Hospital
5.3.1 Introduction and Market Overview
5.3.2 Historic and Forecasted Market Size in Value USD and Volume Units
5.3.3 Key Market Trends, Growth Factors, and Opportunities
5.3.4 Geographic Segmentation Analysis
5.4 Laboratory
Chapter 6: Company Profiles and Competitive Analysis
6.1 Competitive Landscape
6.1.1 Competitive Benchmarking
6.1.2 Blood Urea Nitrogen Diagnostics Market Share by Manufacturer (2024)
6.1.3 Industry BCG Matrix
6.1.4 Heat Map Analysis
6.1.5 Mergers and Acquisitions
6.2 ETHICON (US)
6.2.1 Company Overview
6.2.2 Key Executives
6.2.3 Company Snapshot
6.2.4 Role of the Company in the Market
6.2.5 Sustainability and Social Responsibility
6.2.6 Operating Business Segments
6.2.7 Product Portfolio
6.2.8 Business Performance
6.2.9 Key Strategic Moves and Recent Developments
6.2.10 SWOT Analysis
6.3 INTUITIVE SURGICAL (US)
6.4 TELEFLEX INCORPORATED (US)
6.5 ZIMMER BIOMET (US)
6.6 CONMED CORPORATION (US)
6.7 APPLIED MEDICAL (US)
6.8 INTUITIVE SURGICAL (US)
6.9 BECTON
6.10 DICKINSON (US)
6.11 ZIMMER BIOMET (US)
6.12 STRYKER (US)
6.13 DJO SURGICAL (US)
6.14 LEXINGTON MEDICAL (US)
6.15 DEXTERA SURGICAL INC. (US)
6.16 B. BRAUN (GERMANY)
6.17 SMITH+NEPHEW (UK)
6.18 PURPLE SURGICAL (UK)
6.19 WELFARE MEDICAL LTD. (UK)
6.20 GRENA LTD. (UK)
6.21 MEDTRONIC (IRELAND)
6.22 MERIL LIFE (INDIA)
6.23 FRANKENMAN INTERNATIONAL LIMITED (HONG KONG)
6.24 TOUCHSTONE INTERNATIONAL MEDICAL SCIENCE CO. LTD. (CHINA)
6.25 REACH SURGICAL INC. (CHINA)
6.26
Chapter 7: Global Blood Urea Nitrogen Diagnostics Market By Region
7.1 Overview
7.2. North America Blood Urea Nitrogen Diagnostics Market
7.2.1 Key Market Trends, Growth Factors and Opportunities
7.2.2 Top Key Companies
7.2.3 Historic and Forecasted Market Size by Segments
7.2.4 Historic and Forecasted Market Size by Test Type
7.2.4.1 ELISA
7.2.4.2 Colorimetric
7.2.4.3 Spectrophotometric
7.2.5 Historic and Forecasted Market Size by Application
7.2.5.1 Hospital
7.2.5.2 Laboratory
7.2.6 Historic and Forecast Market Size by Country
7.2.6.1 US
7.2.6.2 Canada
7.2.6.3 Mexico
7.3. Eastern Europe Blood Urea Nitrogen Diagnostics Market
7.3.1 Key Market Trends, Growth Factors and Opportunities
7.3.2 Top Key Companies
7.3.3 Historic and Forecasted Market Size by Segments
7.3.4 Historic and Forecasted Market Size by Test Type
7.3.4.1 ELISA
7.3.4.2 Colorimetric
7.3.4.3 Spectrophotometric
7.3.5 Historic and Forecasted Market Size by Application
7.3.5.1 Hospital
7.3.5.2 Laboratory
7.3.6 Historic and Forecast Market Size by Country
7.3.6.1 Russia
7.3.6.2 Bulgaria
7.3.6.3 The Czech Republic
7.3.6.4 Hungary
7.3.6.5 Poland
7.3.6.6 Romania
7.3.6.7 Rest of Eastern Europe
7.4. Western Europe Blood Urea Nitrogen Diagnostics Market
7.4.1 Key Market Trends, Growth Factors and Opportunities
7.4.2 Top Key Companies
7.4.3 Historic and Forecasted Market Size by Segments
7.4.4 Historic and Forecasted Market Size by Test Type
7.4.4.1 ELISA
7.4.4.2 Colorimetric
7.4.4.3 Spectrophotometric
7.4.5 Historic and Forecasted Market Size by Application
7.4.5.1 Hospital
7.4.5.2 Laboratory
7.4.6 Historic and Forecast Market Size by Country
7.4.6.1 Germany
7.4.6.2 UK
7.4.6.3 France
7.4.6.4 The Netherlands
7.4.6.5 Italy
7.4.6.6 Spain
7.4.6.7 Rest of Western Europe
7.5. Asia Pacific Blood Urea Nitrogen Diagnostics Market
7.5.1 Key Market Trends, Growth Factors and Opportunities
7.5.2 Top Key Companies
7.5.3 Historic and Forecasted Market Size by Segments
7.5.4 Historic and Forecasted Market Size by Test Type
7.5.4.1 ELISA
7.5.4.2 Colorimetric
7.5.4.3 Spectrophotometric
7.5.5 Historic and Forecasted Market Size by Application
7.5.5.1 Hospital
7.5.5.2 Laboratory
7.5.6 Historic and Forecast Market Size by Country
7.5.6.1 China
7.5.6.2 India
7.5.6.3 Japan
7.5.6.4 South Korea
7.5.6.5 Malaysia
7.5.6.6 Thailand
7.5.6.7 Vietnam
7.5.6.8 The Philippines
7.5.6.9 Australia
7.5.6.10 New Zealand
7.5.6.11 Rest of APAC
7.6. Middle East & Africa Blood Urea Nitrogen Diagnostics Market
7.6.1 Key Market Trends, Growth Factors and Opportunities
7.6.2 Top Key Companies
7.6.3 Historic and Forecasted Market Size by Segments
7.6.4 Historic and Forecasted Market Size by Test Type
7.6.4.1 ELISA
7.6.4.2 Colorimetric
7.6.4.3 Spectrophotometric
7.6.5 Historic and Forecasted Market Size by Application
7.6.5.1 Hospital
7.6.5.2 Laboratory
7.6.6 Historic and Forecast Market Size by Country
7.6.6.1 Turkiye
7.6.6.2 Bahrain
7.6.6.3 Kuwait
7.6.6.4 Saudi Arabia
7.6.6.5 Qatar
7.6.6.6 UAE
7.6.6.7 Israel
7.6.6.8 South Africa
7.7. South America Blood Urea Nitrogen Diagnostics Market
7.7.1 Key Market Trends, Growth Factors and Opportunities
7.7.2 Top Key Companies
7.7.3 Historic and Forecasted Market Size by Segments
7.7.4 Historic and Forecasted Market Size by Test Type
7.7.4.1 ELISA
7.7.4.2 Colorimetric
7.7.4.3 Spectrophotometric
7.7.5 Historic and Forecasted Market Size by Application
7.7.5.1 Hospital
7.7.5.2 Laboratory
7.7.6 Historic and Forecast Market Size by Country
7.7.6.1 Brazil
7.7.6.2 Argentina
7.7.6.3 Rest of SA
Chapter 8 Analyst Viewpoint and Conclusion
8.1 Recommendations and Concluding Analysis
8.2 Potential Market Strategies
Chapter 9 Research Methodology
9.1 Research Process
9.2 Primary Research
9.3 Secondary Research
|
Global Blood Urea Nitrogen Diagnostics Market |
|||
|
Base Year: |
2024 |
Forecast Period: |
2025 - 2032 |
|
Historical Data: |
2018 to 2023 |
Market Size in 2024: |
USD 1.99 Bn. |
|
Forecast Period 2024 - 32CAGR: |
6.04 % |
Market Size in 2032: |
USD 3.19 Bn. |
|
Segments Covered: |
By Test Type |
|
|
|
By Application |
|
||
|
By Region |
|
||
|
Key Market Drivers: |
|
||
|
Key Market Restraints: |
|
||
|
Key Opportunities: |
|
||
|
Companies Covered in the report: |
|
||


