


Global 3D Mapping and 3D Modelling Market Overview
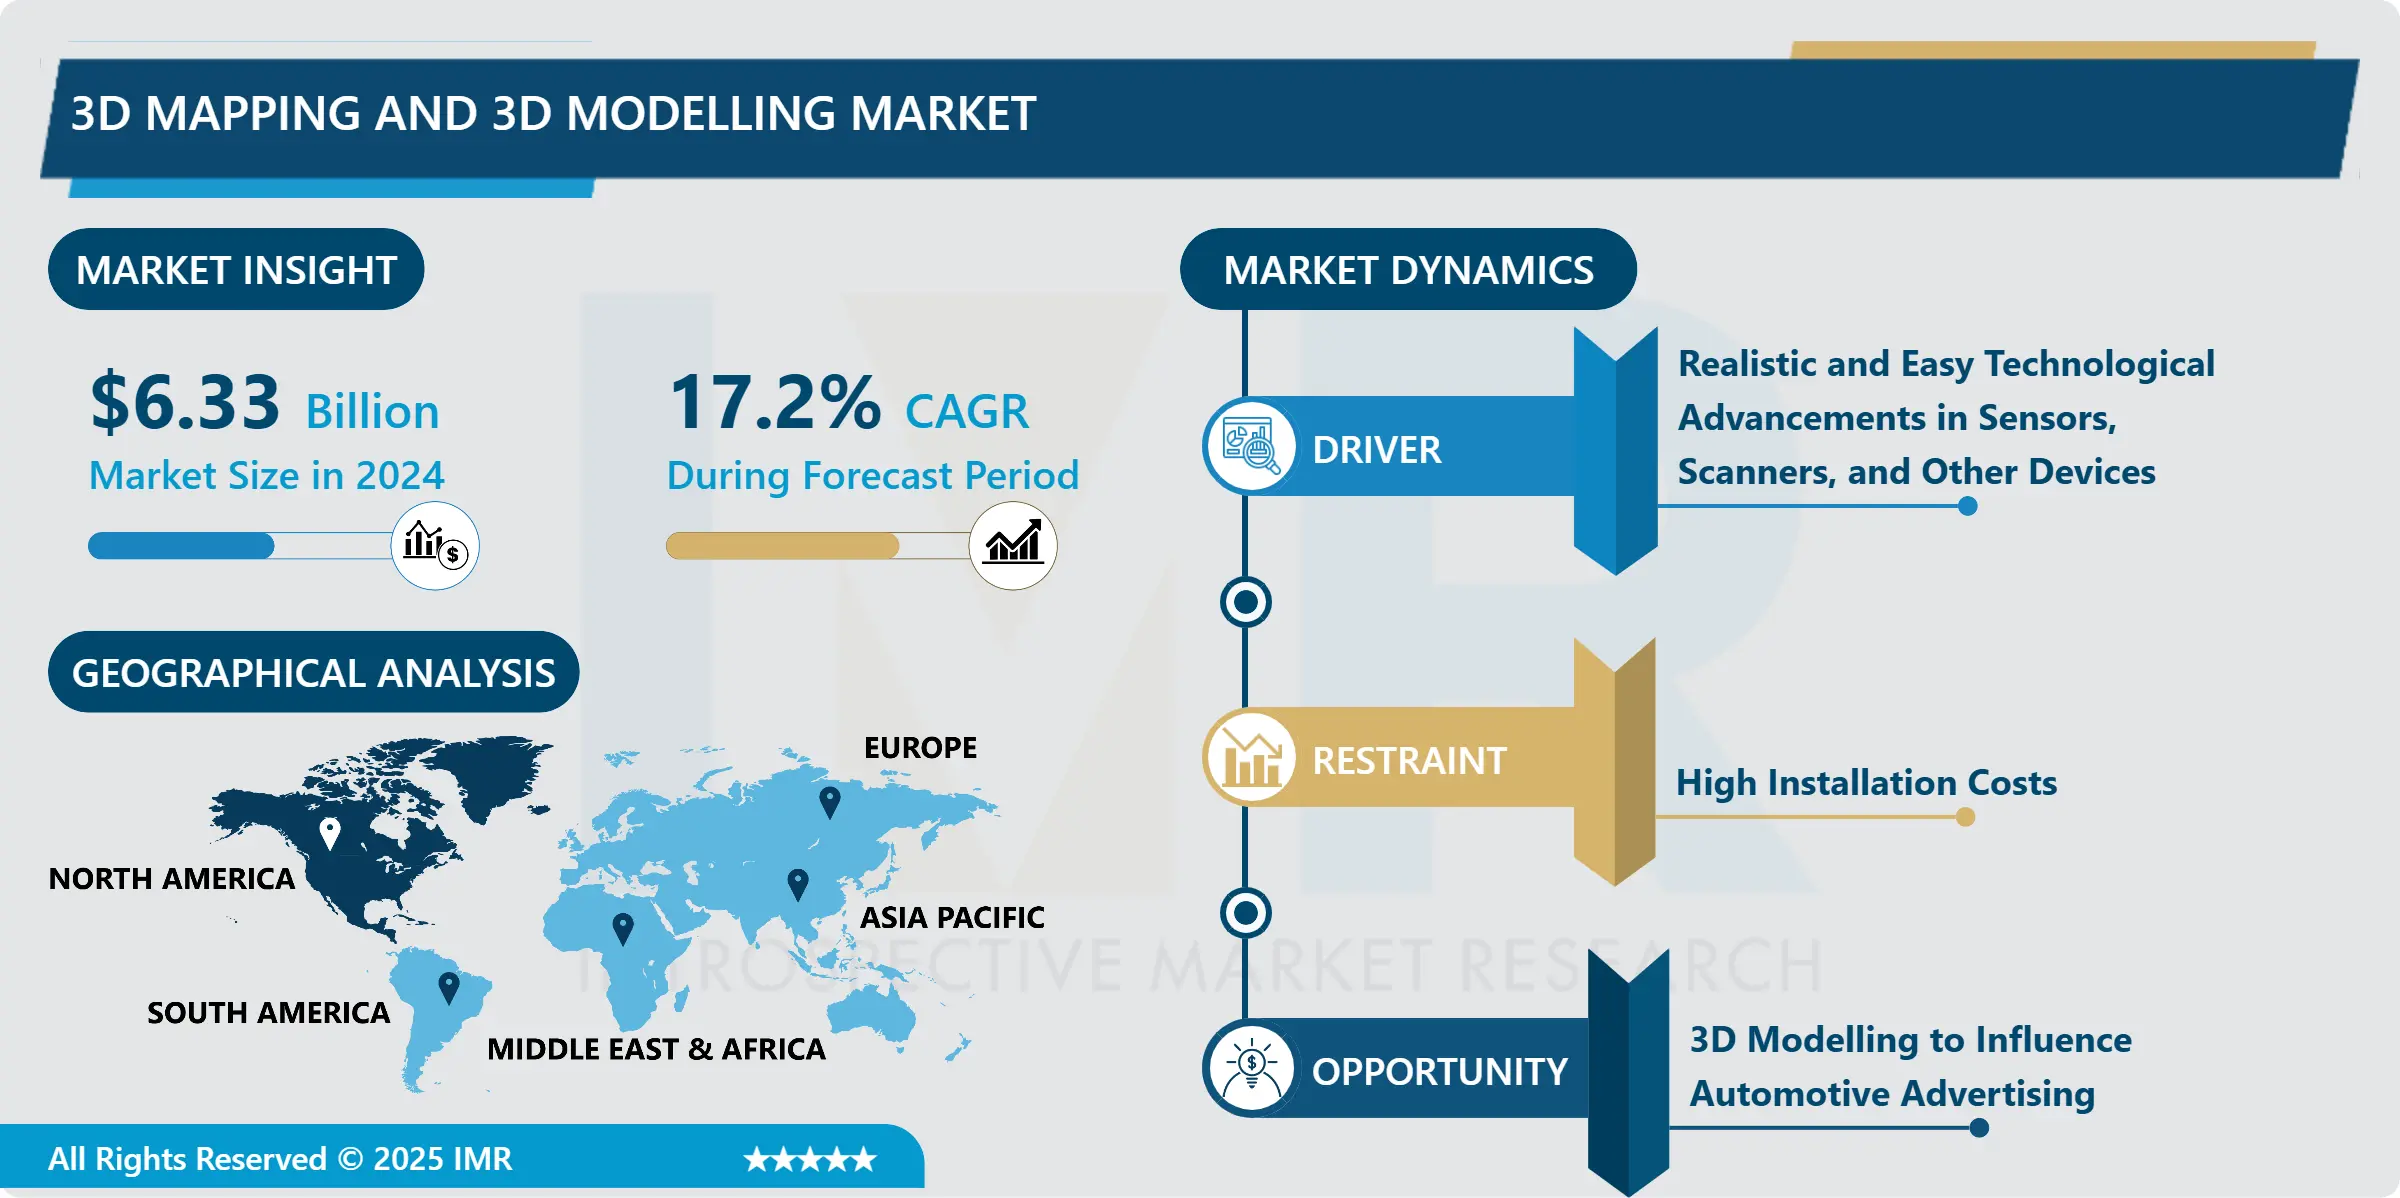
The 3D Mapping and 3D Modelling Market Size Was Valued at USD 6.33 Billion in 2024, and is Projected to Reach USD 22.53 Billion by 2032, Growing at a CAGR of 17.2 % From 2025-2032.
3D mapping and modeling is a technology that allows a viewer to examine a 3D simulation in virtual reality, giving them a realistic experience. It has been widely utilized in the gaming and video entertainment sectors for creating action sequences that allow spectators to feel as if they are in the actual location. Due to an increase in the need for 3D animation in smartphone gaming and other applications, as well as the video entertainment industry's desire to provide a better viewing experience, the market for 3D mapping and 3D modeling has developed significantly in recent years.
3D mapping and 3D modeling are widely utilized in a variety of industries, including automotive, healthcare, building and construction, and defense, to mention a few. AI technology is expected to stimulate the spread of 3D technology due to the efficiency it provides to 3D maps. Technological improvements and the widespread availability of 3D equipment such as sensors, scanners, and other GPS components are estimated to fuel the 3D mapping and 3D modeling market. In addition, 3D geographic data that can be incorporated into existing mobile apps and smartphones is likely to drive the market's growth.

Key Factors and Market Dynamics of 3D Mapping and 3D Modelling market:
Drivers
Realistic and Easy
Users can more realistically display or describe products using 3D modeling. For designers, this 3D modeling technique is simple and easy. Designers can analyze the project from several angles before concluding all of the important aspects. They can also make changes before the prototype is built. Physical models are crucial, but 3D models provide designers with the quickest means to identify project flaws. In addition, 3D modeling allows architects to focus more on the creative process. Architects may save a lot of time and money in the prototype development process, and they can observe how minor design changes will affect the outcome. With modern housing methods, there has been a tremendous demand for customized architecture thus, propelling the growth of the 3D mapping and 3D modeling market during the forecast period.
Technological advancements in sensors, scanners, and other devices
Collection of data and analytics play an important role in 3D mapping and 3D modeling. In the past, due to a lack of proper devices, or systems, it was a difficult task to collect data. The development of 3D content has grown in popularity since the introduction of 3D technology viewing. It has resulted in the invention of several 3D mapping technologies that can map 3D content in the surrounding environment. The technology is making its way into mobile devices including smartphones, tablets, and notebooks. It was possible to model 3D content with the available cloud points using 2D photos, allowing maps to be more realistic and users to have a more accurate view of the objects. 3D scanners, 3D sensors, and other acquisition devices aid in the gathering of 3D data thus, giving a boost to the development of the 3D mapping and 3D modeling market.
Restraints
High installation costs
3D mapping and 3D modeling utilize highly advanced devices for the collection of devices. These high-tech devices such as cameras, sensors, software, and other digital equipment are highly-priced. In addition, to utilize this equipment, the company requires a highly skilled individual thus adding up to the total cost. Along with providing the user with HD quality 3D content, an enhanced customer experience is also essential. To do this, additional costs for obtaining 3D content data from acquisition devices such as scanners and lasers are required thus, hampering the development of the 3D mapping and 3D modeling market during the projected timeframe.
Opportunities
3D Modelling to Influence Automotive Advertising
The automobile industry is a continuously developing industry, with new model launches each year. For instance, if an automobile company plans to release a new car, it can create curiosity in the minds of potential customers by using 3D modeling to build prototypes. The prototype would appear more realistic and provide clients with a better picture of what the car will deliver. Moreover, 3D modeling has advanced to such a great extent that automotive and vehicle design will soon be paperless. Engineers and automobile designers have utilized 3D modeling to produce cars that are more efficient, elegant, and enable low-cost productivity. With the usage of 3D modeling, the product designer or engineer can not only visualize the product but also animate and rigorously test it before it is manufactured as a physical object. Thus, the growing adoption of innovative designing and manufacturing techniques is expected to create a lucrative opportunity for the market players.
Market Segmentation For 3D Mapping And Modelling:
By type, the 3D mapping segment is anticipated to have the highest share of the 3D mapping and 3D modeling market over the forecast period. Projection mapping or video mapping are other terms for 3D mapping. Spatial augmented reality is a term that many people use to describe 3D mapping. 3D mapping helps in profiling objects in three dimensions to map the objects in the real world. The growing popularity of 3D maps as well as the utilization of projection mapping in automotive and real estate has stimulated the development of this segment.
By end-user, the building & construction segment is estimated to lead the development of the 3D mapping and 3D modeling market. Better lead times, costing, stability, and safety are all advantages of 3D modeled construction projects. The technology allows architects and designers to explore and be more creative. Drone technology, in combination with 3D modeling, may also be utilized to constantly monitor ongoing building activities. Furthermore, rather than using traditional physical architectural models, the architectural and construction business employs 3D modeling to demonstrate proposed landscapes and buildings. Furthermore, 3D modeling can be used to create 3D worksites ranging from simple single-story houses to complicated architectural designs thus, strengthening the growth of the segment.
Players Covered in 3D Mapping and 3D Modelling Market are :
-
Autodesk
- Apple Inc
- SAAB
- Intermap Technologies
- Cybercity 3D
- ESRI
- Topcon Corporation
- Trimble
- Airbus Defence and Space
- Foundry
- Pixologic
- NewTek Inc
- Blender Foundation
- 3D-Coat
- MAXON Computer GmbH
- Softree
- Bentley Systems Incorporated and other Active players.
Regional Analysis of 3D Mapping and 3D Modelling market:
The North American region is anticipated to dominate the 3D mapping and 3D modeling market. The growth in this region is attributed to the highly advanced equipment being incorporated into the production and designing of utilities. The manufacturing industry is supported by 3D modeling in a variety of ways, from conceptualization to reverse engineering. 3D modeling is utilized to assist in the prefabrication of parts. It is also being used to improve the design of manufactured goods and to help get products to market quickly. Furthermore, the presence of prominent service providers and the usage of 3D mapping and 3D modeling in the construction industry will bolster the growth of the market in this region.
The European region is anticipated to have the second-highest share of the 3D mapping and 3D modeling market over the forecasted timeframe. Building and construction industry is the most prominent factor stimulating the development of the market. Geolocation and building models of construction sites, buildings, and structures are aided by 3D mapping, allowing architects to design, plan, and manage site logistics. For instance, Zmapping, a London-based firm, develops some of the most extensive and accurate context 3D city models for architects, municipal governments, and master planners. 3D mapping and 3D modeling are also utilized in the automotive industry to design and visualize vehicles even before they are manufactured. The European automotive industry is huge and the adoption of 3D modeling by car manufacturers is expected to support the growth of the market.
The 3D mapping and 3D modeling market in the Asia-Pacific region are anticipated to develop at the highest CAGR due to the rise in the adoption rate. Industries such as healthcare, government, defense, and construction are the major contributors to the growth of the market. In the healthcare sector, the usage of 3D modeling is mostly employed for the development of 3D models of human organs. Some organizations have already built 3D models of human hearts, and many more are scheduled to emerge shortly. To improve surgical success, most human organ transplants will be shaped and printed in 3D thus, supporting the expansion of the 3D mapping and 3D modeling market in this region.
Recent Industry Developments in the 3D Mapping and 3D Modelling market:
-
In October 2023: Bentley Systems and Infotech joined forces to pioneer digital advancements in transportation project delivery. This strategic collaboration aims to revolutionize design-to-construction workflows, elevate data quality, and enhance communication across departments of transportation. By integrating cutting-edge technologies, the initiative seeks to optimize project outcomes and streamline processes within the transportation sector, setting new standards for efficiency and effectiveness.
-
In November 2023 - Cadence and Autodesk Forge Collaborative Alliance to Enhance Smart Product Design. Cadence Allegro X and OrCAD X now seamlessly integrate with Autodesk Fusion, streamlining PCB 3D modeling for design and manufacturing industries. This partnership underscores a trend of strategic alliances driving market expansion and innovation.
|
Global 3D Mapping and 3D Modelling Market |
|||
|
Base Year: |
2024 |
Forecast Period: |
2025-2032 |
|
Historical Data: |
2018 to 2023 |
Market Size in 2024: |
USD 6.33 Bn. |
|
Forecast Period 2025-32 CAGR: |
17.2% |
Market Size in 2032: |
USD 22.53 Bn. |
|
Segments Covered: |
By Type |
|
|
|
By End-User |
|
||
|
By Application |
|
||
|
By Region |
•North America (U.S., Canada, Mexico) •Eastern Europe (Russia, Bulgaria, The Czech Republic, Hungary, Poland, Romania, Rest of Eastern Europe) •Western Europe (Germany, UK, France, The Netherlands, Italy, Spain, Rest of Western Europe) •Asia Pacific (China, India, Japan, South Korea, Malaysia, Thailand, Vietnam, The Philippines, Australia, New Zealand, Rest of APAC) •Middle East & Africa (Türkiye, Bahrain, Kuwait, Saudi Arabia, Qatar, UAE, Israel, South Africa) •South America (Brazil, Argentina, Rest of SA) |
||
|
Key Market Drivers: |
|
||
|
Key Market Restraints: |
|
||
|
Key Opportunities: |
|
||
|
Companies Covered in the report: |
|
||
Chapter 1: Introduction
1.1 Scope and Coverage
Chapter 2:Executive Summary
Chapter 3: Market Landscape
3.1 Market Dynamics
3.1.1 Drivers
3.1.2 Restraints
3.1.3 Opportunities
3.1.4 Challenges
3.2 Market Trend Analysis
3.3 PESTLE Analysis
3.4 Porter's Five Forces Analysis
3.5 Industry Value Chain Analysis
3.6 Ecosystem
3.7 Regulatory Landscape
3.8 Price Trend Analysis
3.9 Patent Analysis
3.10 Technology Evolution
3.11 Investment Pockets
3.12 Import-Export Analysis
Chapter 4: 3D Mapping and 3D Modelling Market by Type (2018-2032)
4.1 3D Mapping and 3D Modelling Market Snapshot and Growth Engine
4.2 Market Overview
4.3 3D Mapping
4.3.1 Introduction and Market Overview
4.3.2 Historic and Forecasted Market Size in Value USD and Volume Units
4.3.3 Key Market Trends, Growth Factors, and Opportunities
4.3.4 Geographic Segmentation Analysis
4.4 3D Modelling
Chapter 5: 3D Mapping and 3D Modelling Market by End-User (2018-2032)
5.1 3D Mapping and 3D Modelling Market Snapshot and Growth Engine
5.2 Market Overview
5.3 Building & Construction
5.3.1 Introduction and Market Overview
5.3.2 Historic and Forecasted Market Size in Value USD and Volume Units
5.3.3 Key Market Trends, Growth Factors, and Opportunities
5.3.4 Geographic Segmentation Analysis
5.4 Healthcare
5.5 Automotive
Chapter 6: 3D Mapping and 3D Modelling Market by Application (2018-2032)
6.1 3D Mapping and 3D Modelling Market Snapshot and Growth Engine
6.2 Market Overview
6.3 Projection-Mapping
6.3.1 Introduction and Market Overview
6.3.2 Historic and Forecasted Market Size in Value USD and Volume Units
6.3.3 Key Market Trends, Growth Factors, and Opportunities
6.3.4 Geographic Segmentation Analysis
6.4 Maps & Navigation
6.5 Texture Mapping
Chapter 7: Company Profiles and Competitive Analysis
7.1 Competitive Landscape
7.1.1 Competitive Benchmarking
7.1.2 3D Mapping and 3D Modelling Market Share by Manufacturer (2024)
7.1.3 Industry BCG Matrix
7.1.4 Heat Map Analysis
7.1.5 Mergers and Acquisitions
7.2 ADOBE INC
7.2.1 Company Overview
7.2.2 Key Executives
7.2.3 Company Snapshot
7.2.4 Role of the Company in the Market
7.2.5 Sustainability and Social Responsibility
7.2.6 Operating Business Segments
7.2.7 Product Portfolio
7.2.8 Business Performance
7.2.9 Key Strategic Moves and Recent Developments
7.2.10 SWOT Analysis
7.3 NVIDIA CORPORATION
7.4 AUTODESK INCPIXAR INCNEWTEK INC
7.5 COREL CORPORATION
7.6 OTHER KEY PLAYERS
7.7
Chapter 8: Global 3D Mapping and 3D Modelling Market By Region
8.1 Overview
8.2. North America 3D Mapping and 3D Modelling Market
8.2.1 Key Market Trends, Growth Factors and Opportunities
8.2.2 Top Key Companies
8.2.3 Historic and Forecasted Market Size by Segments
8.2.4 Historic and Forecasted Market Size by Type
8.2.4.1 3D Mapping
8.2.4.2 3D Modelling
8.2.5 Historic and Forecasted Market Size by End-User
8.2.5.1 Building & Construction
8.2.5.2 Healthcare
8.2.5.3 Automotive
8.2.6 Historic and Forecasted Market Size by Application
8.2.6.1 Projection-Mapping
8.2.6.2 Maps & Navigation
8.2.6.3 Texture Mapping
8.2.7 Historic and Forecast Market Size by Country
8.2.7.1 US
8.2.7.2 Canada
8.2.7.3 Mexico
8.3. Eastern Europe 3D Mapping and 3D Modelling Market
8.3.1 Key Market Trends, Growth Factors and Opportunities
8.3.2 Top Key Companies
8.3.3 Historic and Forecasted Market Size by Segments
8.3.4 Historic and Forecasted Market Size by Type
8.3.4.1 3D Mapping
8.3.4.2 3D Modelling
8.3.5 Historic and Forecasted Market Size by End-User
8.3.5.1 Building & Construction
8.3.5.2 Healthcare
8.3.5.3 Automotive
8.3.6 Historic and Forecasted Market Size by Application
8.3.6.1 Projection-Mapping
8.3.6.2 Maps & Navigation
8.3.6.3 Texture Mapping
8.3.7 Historic and Forecast Market Size by Country
8.3.7.1 Russia
8.3.7.2 Bulgaria
8.3.7.3 The Czech Republic
8.3.7.4 Hungary
8.3.7.5 Poland
8.3.7.6 Romania
8.3.7.7 Rest of Eastern Europe
8.4. Western Europe 3D Mapping and 3D Modelling Market
8.4.1 Key Market Trends, Growth Factors and Opportunities
8.4.2 Top Key Companies
8.4.3 Historic and Forecasted Market Size by Segments
8.4.4 Historic and Forecasted Market Size by Type
8.4.4.1 3D Mapping
8.4.4.2 3D Modelling
8.4.5 Historic and Forecasted Market Size by End-User
8.4.5.1 Building & Construction
8.4.5.2 Healthcare
8.4.5.3 Automotive
8.4.6 Historic and Forecasted Market Size by Application
8.4.6.1 Projection-Mapping
8.4.6.2 Maps & Navigation
8.4.6.3 Texture Mapping
8.4.7 Historic and Forecast Market Size by Country
8.4.7.1 Germany
8.4.7.2 UK
8.4.7.3 France
8.4.7.4 The Netherlands
8.4.7.5 Italy
8.4.7.6 Spain
8.4.7.7 Rest of Western Europe
8.5. Asia Pacific 3D Mapping and 3D Modelling Market
8.5.1 Key Market Trends, Growth Factors and Opportunities
8.5.2 Top Key Companies
8.5.3 Historic and Forecasted Market Size by Segments
8.5.4 Historic and Forecasted Market Size by Type
8.5.4.1 3D Mapping
8.5.4.2 3D Modelling
8.5.5 Historic and Forecasted Market Size by End-User
8.5.5.1 Building & Construction
8.5.5.2 Healthcare
8.5.5.3 Automotive
8.5.6 Historic and Forecasted Market Size by Application
8.5.6.1 Projection-Mapping
8.5.6.2 Maps & Navigation
8.5.6.3 Texture Mapping
8.5.7 Historic and Forecast Market Size by Country
8.5.7.1 China
8.5.7.2 India
8.5.7.3 Japan
8.5.7.4 South Korea
8.5.7.5 Malaysia
8.5.7.6 Thailand
8.5.7.7 Vietnam
8.5.7.8 The Philippines
8.5.7.9 Australia
8.5.7.10 New Zealand
8.5.7.11 Rest of APAC
8.6. Middle East & Africa 3D Mapping and 3D Modelling Market
8.6.1 Key Market Trends, Growth Factors and Opportunities
8.6.2 Top Key Companies
8.6.3 Historic and Forecasted Market Size by Segments
8.6.4 Historic and Forecasted Market Size by Type
8.6.4.1 3D Mapping
8.6.4.2 3D Modelling
8.6.5 Historic and Forecasted Market Size by End-User
8.6.5.1 Building & Construction
8.6.5.2 Healthcare
8.6.5.3 Automotive
8.6.6 Historic and Forecasted Market Size by Application
8.6.6.1 Projection-Mapping
8.6.6.2 Maps & Navigation
8.6.6.3 Texture Mapping
8.6.7 Historic and Forecast Market Size by Country
8.6.7.1 Turkiye
8.6.7.2 Bahrain
8.6.7.3 Kuwait
8.6.7.4 Saudi Arabia
8.6.7.5 Qatar
8.6.7.6 UAE
8.6.7.7 Israel
8.6.7.8 South Africa
8.7. South America 3D Mapping and 3D Modelling Market
8.7.1 Key Market Trends, Growth Factors and Opportunities
8.7.2 Top Key Companies
8.7.3 Historic and Forecasted Market Size by Segments
8.7.4 Historic and Forecasted Market Size by Type
8.7.4.1 3D Mapping
8.7.4.2 3D Modelling
8.7.5 Historic and Forecasted Market Size by End-User
8.7.5.1 Building & Construction
8.7.5.2 Healthcare
8.7.5.3 Automotive
8.7.6 Historic and Forecasted Market Size by Application
8.7.6.1 Projection-Mapping
8.7.6.2 Maps & Navigation
8.7.6.3 Texture Mapping
8.7.7 Historic and Forecast Market Size by Country
8.7.7.1 Brazil
8.7.7.2 Argentina
8.7.7.3 Rest of SA
Chapter 9 Analyst Viewpoint and Conclusion
9.1 Recommendations and Concluding Analysis
9.2 Potential Market Strategies
Chapter 10 Research Methodology
10.1 Research Process
10.2 Primary Research
10.3 Secondary Research
|
Global 3D Mapping and 3D Modelling Market |
|||
|
Base Year: |
2024 |
Forecast Period: |
2025-2032 |
|
Historical Data: |
2018 to 2023 |
Market Size in 2024: |
USD 6.33 Bn. |
|
Forecast Period 2025-32 CAGR: |
17.2% |
Market Size in 2032: |
USD 22.53 Bn. |
|
Segments Covered: |
By Type |
|
|
|
By End-User |
|
||
|
By Application |
|
||
|
By Region |
•North America (U.S., Canada, Mexico) •Eastern Europe (Russia, Bulgaria, The Czech Republic, Hungary, Poland, Romania, Rest of Eastern Europe) •Western Europe (Germany, UK, France, The Netherlands, Italy, Spain, Rest of Western Europe) •Asia Pacific (China, India, Japan, South Korea, Malaysia, Thailand, Vietnam, The Philippines, Australia, New Zealand, Rest of APAC) •Middle East & Africa (Türkiye, Bahrain, Kuwait, Saudi Arabia, Qatar, UAE, Israel, South Africa) •South America (Brazil, Argentina, Rest of SA) |
||
|
Key Market Drivers: |
|
||
|
Key Market Restraints: |
|
||
|
Key Opportunities: |
|
||
|
Companies Covered in the report: |
|
||


