


Voice Cloning Market Synopsis
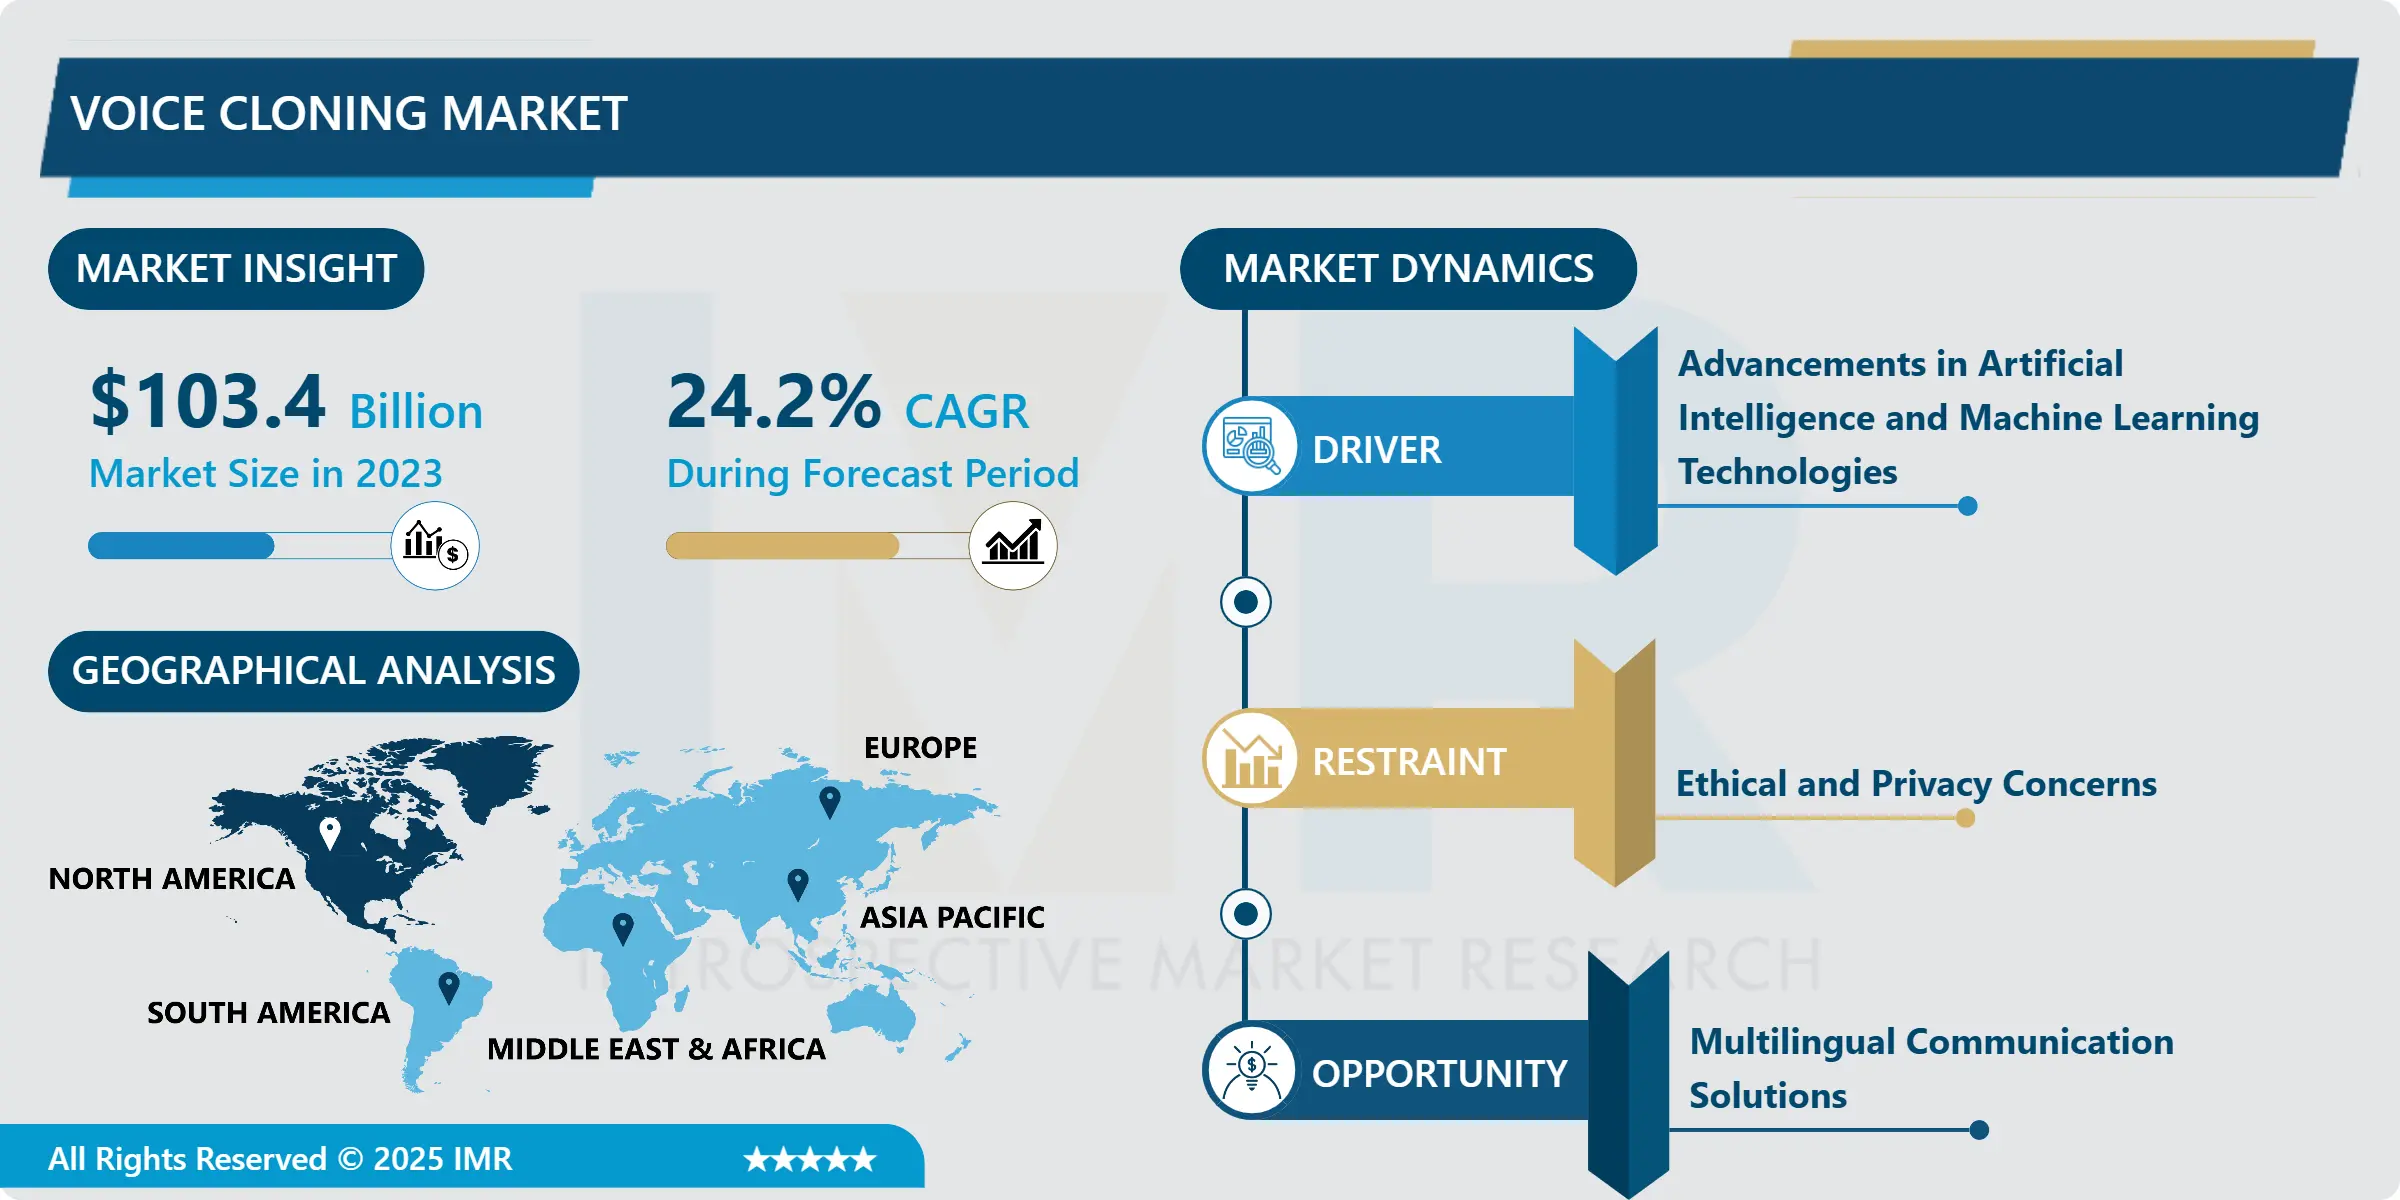
Voice Cloning Market Size Was Valued at USD 103.4 Billion in 2023, and is Projected to Reach USD 727.14 Billion by 2032, Growing at a CAGR of 24.2% From 2024-2032.
Deepfake technology refers to the creation of realistic media content that involves the use of artificial intelligence and machine learning tools, where voice cloning is concerned. These algorithms process the recordings or transcripts of a person’s voice, and are capable of synthesizing speech that is indistinguishable from the original speaker in terms of speaking style, prosody, and even voice identity. There are many uses for voice cloning including helping people who have speech impediments to creating robotic helpers and even modifying the sound of someone’s voice for a movie or advertisement. But it has also given rise to some disturbing ethical issues related to the violation of privacy and the unauthorized use of someone’s voice for commercial benefit.
The voice cloning industry experienced a boom in recent years due to the continuous development of AI and NLP technologies. Soundboard is a type of voice cloning that is referred to as speech synthesis or text-to-speech synthesis in some circles.
This technology is used in the following entertainment, customer service, virtual assistants – and speech impaired applications and devices. The businesses which provide the voice cloning services rely on deep learning technologies to mimic a person’s voice, from the tone, accent, and even inflection of emotion.
The advancement of technology has resulted in an ever-increasing desire for more personal and natural conversations and interactions from the user’s perspective, which in turn continues to fuel the need for better voice cloning solutions for businesses.
The advancement of smart devices and platform supporting voice-enabled interfaces also drives the growth of the voice cloning market due to consumers’ demand for an organic interaction with their digital assistants and other devices. Nevertheless, there is still a serious problem of the use of voice2text technologies for unlawful purposes, including criminal activities, for which it is necessary to take serious security measures and shape legal frameworks.

Voice Cloning Market Trend Analysis
Advancements in Neural Network Architectures
- The innovations in the neural network architecture have transformed the voice cloning sector into what is perhaps the most realistic and accurate synthetic voice design market available today. Methods like deep learning specifically through networks like WaveNet and Tacotron have gone a long way in mimicking human speech characteristics and inflections.
- This has led to the creating of voice cloning systems in which one can simply record their voice and it produces a very natural sounding synthesized voice that even mimics the emotional intonations of the original voice.
- Furthermore, the development of transfer learning and generative adversarial networks (GANs) has continued to facilitate the advancement of voice cloning by promoting effective training on smaller datasets and enhancing the quality of synthesized voices Stemmed out of various industries such as entertainment, customer services, and physical and mental disabilities where human-like personal interactions are becoming highly regarded and sought after.
- As the development of neural network structures continues and receives increased attention in scientific and technical circles, the voice cloning market is bound to expand significantly in the next few years and even decades with the help of groundbreaking innovations.
Multilingual Communication Solutions
- The Multilingual Communication Solutions Voice Cloning Market is an expanding industry due to the increasing need for individuals to communicate with a unique voice in multi-lingual societies. Synthetic speech technology helps in impersonating real human voices and dialects used for fluent interaction in different languages. This market expansion is driven by various sectors which include customer services, entertainment, education and translation services which are all critical to the success of a business entity and therefore require effective communication.
- The growing trends in AI and ML technologies are improving the efficiency and quality of voice cloning systems and this influences the market progress. Accordingly, in light of voice cloning’s growing global and cultural significance to business, there is likely to remain a high and ongoing demand for multilingual voice cloning solutions, furthering innovation and cooperation within the industry.
- Developing countries in the Multilingual Communication Solutions Voice Cloning Market is not only expanding but also transitioning from one point to another in how to relate with different people in the market. This is not just a technology for duplicating voices; it is for creating the inclusiveness that is required to bridge language isolations on the global level. Marketers are increasingly using voice cloning to target specific audiences and address various linguistic and cultural needs in specific territories to achieve better customer experiences.
- The future of voice cloning as a standalone service looks limited as the technology is increasingly getting merged with other advanced tools, including NLP and speech recognition, to enhance the functionality of diverse products – from virtual assistants to language learning systems. Additionally, as voice cloning technology continues to gain popularity and be introduced to a wider market, more individual companies, including small businesses, and independent developers are entering the market, intensifying the competition and contributing to further development.
Voice Cloning Market Segment Analysis:
Voice Cloning Market is Segmented based on Solutions, Application and End Users.
By Solution , Service segment is expected to dominate the market during the forecast period
- The Voice Cloning Market is booming as a result of AI and NLP technologies. More and more options that are created with focus on voice cloning in mind could be found for more industries and usages. These solutions have the power to generate extremely life-like synthetic voices, to fuel 1-to-1 customer dialogues, frictionless avatars & virtual assistants, and new forms of content. These are mostly deep learning-based solutions that can replicate the human interpretation of speech and deliver accurate human-like responses, transforming how businesses communicate with their customers or clients.
- This democratization of voice cloning technology is making it a source of inspiration and inspiration for individuals and businesses as a whole to pursue new avenues in both communication and entertainment. The industry outlook for the Voice Cloning Market is excellent due to the growing desire for increased realism and personalization of voices, with promising conditions for the development of the sphere in the near future and for most providers of voice clones in various sectors.
- With applications ranging from customer service and virtual assistants to entertainment and accessibility, the voice cloning market is witnessing extensive use in several domains like gaming and education. For example, in the entertainment sector, voice cloning can be used to develop hyper-realistic digital voices and enhance interactive and immersive media content. Game developers are integrating this technology to increase the interaction opportunities for players by providing them with contextualized communication and interactive storytelling. In education: use of voice cloning for the creation of interactive content materials and language learning tools where the student could record his or her speech, which would be cloned and compared to the appropriate original.
- The voice cloning is found to be one of the most crucial applications in services to disabled or people with speech disability so that their synthesized speech is highly acceptable and almost similar to their own speech. Given the inherent nature of this technology and its ability to become more accurate with consistent improvement, voice cloning solutions are expected to revolutionize human-computer interaction and the corresponding expressions and communications in different domains.
By Application , Chatbots & Assistants segment held the largest share in 2023
- The Voice Cloning Market is currently growing in the context of diverse applications that range from chatbots and assistants to accessibility tools, gaming, and developing interactive learning environments. When it comes to chatbots and assistants, voice cloning turns out to be essential for adding a more personalized and human touch to such interactions and, in turn, further improving the experience of end users. Edge computing tools utilize voice cloning technology to enhance the lives of disabled people by offering them synthesized voices that have a natural and human-like tone. In digital gaming, voice cloning helps to foster overall engagement and immerse end-users into their gaming worlds by providing realistic and distinctive dialogue from characters in the story.
- The platforms for interacting learning use voice cloning to develop content that can engage learners in the learning process effectively and personalize the process according to preferences. Such advances in these applications are likely to maintain the momentum of growth in the Voice Cloning Market in the foreseeable future as the synthetic voices gain momentum in various sectors with the desire for increasing naturalness and lifelike quality of such voices.
Voice Cloning Market Regional Insights:
North America is Expected to Dominate the Market Over the Forecast period
- The voice cloning market in North America is expected to continue to have a significant market share during the forecast period. This dominance can be attributed to several factors such as the technological development in the region, large scale investments in research and development as well as the major market players.
- New applications of voice cloning technology in the North American market along with its growing use in entertainment, Healthcare, and Banking sectors continue to enhance the overall market share of the region.
- The established and supportive regulatory structure for new technological development in the region helps the voice cloning market to grow. With the advent of such a technology, which reshapes our view of traditional audio-visual interaction, North America will undoubtedly remain the main trendsetter in the overall market growth and promising developments in the use of voice cloning in the future.
Active Key Players in the Commercial Electric Vehicle market
- Google (US)
- Microsoft (US)
- IBM (US)
- AWS (US)
- AT&T (US)
- Baidu (China)
- Nuance Communications (US)
- iSpeech (US)
- NeoSpeech (US)
- CereProc (Scotland)
- Cepstral (US)
- Lyrebird (Canada)
- Kata.ai (Indonesia)
- alt Inc. (Japan)
- Aristech GmbH (Germany)
- Acapela Group (Belgium)
- VocaliD (US)
- Voicery (US)
- Voctro Labs (Spain)
- exClone (US)
- CandyVoice (France)
- LumenVox (US)
- rSpeak (Netherlands)
- Smartbox Assistive Technology (UK)
- VivoText (Israel)
- Other Key Players
Key Industry Developments in the Voice Cloning Market
- October 2022: To deliver real-time play-by-play, pre-game, in-game, and post-game updates, Stats Perform, the sports tech leader in data and AI, and Veritone, Inc., creator of the hyper-expansive enterprise AI platform aiWARE, have announced a new strategic alliance. The collaboration will combine Stats Perform's dependable Opta sports data with Veritone's award-winning synthetic speech AI technology to provide localized AI voice capabilities to content producers, media outlets, brand agencies, teams, leagues, and betting platforms around the world.
Global Voice Cloning Market Scope:
|
Global Voice Cloning Market |
|||
|
Base Year: |
2023 |
Forecast Period: |
2024-2032 |
|
Historical Data: |
2017 to 2023 |
Market Size in 2023: |
USD 103.4 Bn. |
|
Forecast Period 2024-32 CAGR: |
24.2 % |
Market Size in 2032: |
USD 727.14 Bn. |
|
Segments Covered: |
By Solutions |
|
|
|
By Application |
|
||
|
By End Users |
|
||
|
By Region |
|
||
|
Key Market Drivers: |
|
||
|
Key Market Restraints: |
|
||
|
Key Opportunities: |
|
||
|
Companies Covered in the report: |
|
||
Chapter 1: Introduction
1.1 Scope and Coverage
Chapter 2:Executive Summary
Chapter 3: Market Landscape
3.1 Market Dynamics
3.1.1 Drivers
3.1.2 Restraints
3.1.3 Opportunities
3.1.4 Challenges
3.2 Market Trend Analysis
3.3 PESTLE Analysis
3.4 Porter's Five Forces Analysis
3.5 Industry Value Chain Analysis
3.6 Ecosystem
3.7 Regulatory Landscape
3.8 Price Trend Analysis
3.9 Patent Analysis
3.10 Technology Evolution
3.11 Investment Pockets
3.12 Import-Export Analysis
Chapter 4: Voice Cloning Market by Solutions (2018-2032)
4.1 Voice Cloning Market Snapshot and Growth Engine
4.2 Market Overview
4.3 Solutions
4.3.1 Introduction and Market Overview
4.3.2 Historic and Forecasted Market Size in Value USD and Volume Units
4.3.3 Key Market Trends, Growth Factors, and Opportunities
4.3.4 Geographic Segmentation Analysis
4.4 Services
Chapter 5: Voice Cloning Market by Application (2018-2032)
5.1 Voice Cloning Market Snapshot and Growth Engine
5.2 Market Overview
5.3 Chatbots & Assistants
5.3.1 Introduction and Market Overview
5.3.2 Historic and Forecasted Market Size in Value USD and Volume Units
5.3.3 Key Market Trends, Growth Factors, and Opportunities
5.3.4 Geographic Segmentation Analysis
5.4 Accessibility
5.5 Digital Game
5.6 Interactive learning
Chapter 6: Voice Cloning Market by End Users (2018-2032)
6.1 Voice Cloning Market Snapshot and Growth Engine
6.2 Market Overview
6.3 IT & Telecom
6.3.1 Introduction and Market Overview
6.3.2 Historic and Forecasted Market Size in Value USD and Volume Units
6.3.3 Key Market Trends, Growth Factors, and Opportunities
6.3.4 Geographic Segmentation Analysis
6.4 BFSI
6.5 Educational Institutions
6.6 Healthcare
6.7 Travel & Tourism
6.8 Others
Chapter 7: Company Profiles and Competitive Analysis
7.1 Competitive Landscape
7.1.1 Competitive Benchmarking
7.1.2 Voice Cloning Market Share by Manufacturer (2024)
7.1.3 Industry BCG Matrix
7.1.4 Heat Map Analysis
7.1.5 Mergers and Acquisitions
7.2 SEALED AIR (US)
7.2.1 Company Overview
7.2.2 Key Executives
7.2.3 Company Snapshot
7.2.4 Role of the Company in the Market
7.2.5 Sustainability and Social Responsibility
7.2.6 Operating Business Segments
7.2.7 Product Portfolio
7.2.8 Business Performance
7.2.9 Key Strategic Moves and Recent Developments
7.2.10 SWOT Analysis
7.3 COVERIS (UK)
7.4 AMCOR LIMITED (AUSTRALIA)
7.5 MONDI PLC (UK)
7.6 ULTRAPERF TECHNOLOGIES (US)
7.7 KM PACKAGING SERVICES LTD (UK)
7.8 AMERPLAST (FINLAND)
7.9 UFLEX LTD (INDIA)
7.10 AND OTHER KEY PLAYERS
Chapter 8: Global Voice Cloning Market By Region
8.1 Overview
8.2. North America Voice Cloning Market
8.2.1 Key Market Trends, Growth Factors and Opportunities
8.2.2 Top Key Companies
8.2.3 Historic and Forecasted Market Size by Segments
8.2.4 Historic and Forecasted Market Size by Solutions
8.2.4.1 Solutions
8.2.4.2 Services
8.2.5 Historic and Forecasted Market Size by Application
8.2.5.1 Chatbots & Assistants
8.2.5.2 Accessibility
8.2.5.3 Digital Game
8.2.5.4 Interactive learning
8.2.6 Historic and Forecasted Market Size by End Users
8.2.6.1 IT & Telecom
8.2.6.2 BFSI
8.2.6.3 Educational Institutions
8.2.6.4 Healthcare
8.2.6.5 Travel & Tourism
8.2.6.6 Others
8.2.7 Historic and Forecast Market Size by Country
8.2.7.1 US
8.2.7.2 Canada
8.2.7.3 Mexico
8.3. Eastern Europe Voice Cloning Market
8.3.1 Key Market Trends, Growth Factors and Opportunities
8.3.2 Top Key Companies
8.3.3 Historic and Forecasted Market Size by Segments
8.3.4 Historic and Forecasted Market Size by Solutions
8.3.4.1 Solutions
8.3.4.2 Services
8.3.5 Historic and Forecasted Market Size by Application
8.3.5.1 Chatbots & Assistants
8.3.5.2 Accessibility
8.3.5.3 Digital Game
8.3.5.4 Interactive learning
8.3.6 Historic and Forecasted Market Size by End Users
8.3.6.1 IT & Telecom
8.3.6.2 BFSI
8.3.6.3 Educational Institutions
8.3.6.4 Healthcare
8.3.6.5 Travel & Tourism
8.3.6.6 Others
8.3.7 Historic and Forecast Market Size by Country
8.3.7.1 Russia
8.3.7.2 Bulgaria
8.3.7.3 The Czech Republic
8.3.7.4 Hungary
8.3.7.5 Poland
8.3.7.6 Romania
8.3.7.7 Rest of Eastern Europe
8.4. Western Europe Voice Cloning Market
8.4.1 Key Market Trends, Growth Factors and Opportunities
8.4.2 Top Key Companies
8.4.3 Historic and Forecasted Market Size by Segments
8.4.4 Historic and Forecasted Market Size by Solutions
8.4.4.1 Solutions
8.4.4.2 Services
8.4.5 Historic and Forecasted Market Size by Application
8.4.5.1 Chatbots & Assistants
8.4.5.2 Accessibility
8.4.5.3 Digital Game
8.4.5.4 Interactive learning
8.4.6 Historic and Forecasted Market Size by End Users
8.4.6.1 IT & Telecom
8.4.6.2 BFSI
8.4.6.3 Educational Institutions
8.4.6.4 Healthcare
8.4.6.5 Travel & Tourism
8.4.6.6 Others
8.4.7 Historic and Forecast Market Size by Country
8.4.7.1 Germany
8.4.7.2 UK
8.4.7.3 France
8.4.7.4 The Netherlands
8.4.7.5 Italy
8.4.7.6 Spain
8.4.7.7 Rest of Western Europe
8.5. Asia Pacific Voice Cloning Market
8.5.1 Key Market Trends, Growth Factors and Opportunities
8.5.2 Top Key Companies
8.5.3 Historic and Forecasted Market Size by Segments
8.5.4 Historic and Forecasted Market Size by Solutions
8.5.4.1 Solutions
8.5.4.2 Services
8.5.5 Historic and Forecasted Market Size by Application
8.5.5.1 Chatbots & Assistants
8.5.5.2 Accessibility
8.5.5.3 Digital Game
8.5.5.4 Interactive learning
8.5.6 Historic and Forecasted Market Size by End Users
8.5.6.1 IT & Telecom
8.5.6.2 BFSI
8.5.6.3 Educational Institutions
8.5.6.4 Healthcare
8.5.6.5 Travel & Tourism
8.5.6.6 Others
8.5.7 Historic and Forecast Market Size by Country
8.5.7.1 China
8.5.7.2 India
8.5.7.3 Japan
8.5.7.4 South Korea
8.5.7.5 Malaysia
8.5.7.6 Thailand
8.5.7.7 Vietnam
8.5.7.8 The Philippines
8.5.7.9 Australia
8.5.7.10 New Zealand
8.5.7.11 Rest of APAC
8.6. Middle East & Africa Voice Cloning Market
8.6.1 Key Market Trends, Growth Factors and Opportunities
8.6.2 Top Key Companies
8.6.3 Historic and Forecasted Market Size by Segments
8.6.4 Historic and Forecasted Market Size by Solutions
8.6.4.1 Solutions
8.6.4.2 Services
8.6.5 Historic and Forecasted Market Size by Application
8.6.5.1 Chatbots & Assistants
8.6.5.2 Accessibility
8.6.5.3 Digital Game
8.6.5.4 Interactive learning
8.6.6 Historic and Forecasted Market Size by End Users
8.6.6.1 IT & Telecom
8.6.6.2 BFSI
8.6.6.3 Educational Institutions
8.6.6.4 Healthcare
8.6.6.5 Travel & Tourism
8.6.6.6 Others
8.6.7 Historic and Forecast Market Size by Country
8.6.7.1 Turkiye
8.6.7.2 Bahrain
8.6.7.3 Kuwait
8.6.7.4 Saudi Arabia
8.6.7.5 Qatar
8.6.7.6 UAE
8.6.7.7 Israel
8.6.7.8 South Africa
8.7. South America Voice Cloning Market
8.7.1 Key Market Trends, Growth Factors and Opportunities
8.7.2 Top Key Companies
8.7.3 Historic and Forecasted Market Size by Segments
8.7.4 Historic and Forecasted Market Size by Solutions
8.7.4.1 Solutions
8.7.4.2 Services
8.7.5 Historic and Forecasted Market Size by Application
8.7.5.1 Chatbots & Assistants
8.7.5.2 Accessibility
8.7.5.3 Digital Game
8.7.5.4 Interactive learning
8.7.6 Historic and Forecasted Market Size by End Users
8.7.6.1 IT & Telecom
8.7.6.2 BFSI
8.7.6.3 Educational Institutions
8.7.6.4 Healthcare
8.7.6.5 Travel & Tourism
8.7.6.6 Others
8.7.7 Historic and Forecast Market Size by Country
8.7.7.1 Brazil
8.7.7.2 Argentina
8.7.7.3 Rest of SA
Chapter 9 Analyst Viewpoint and Conclusion
9.1 Recommendations and Concluding Analysis
9.2 Potential Market Strategies
Chapter 10 Research Methodology
10.1 Research Process
10.2 Primary Research
10.3 Secondary Research
Global Voice Cloning Market Scope:
|
Global Voice Cloning Market |
|||
|
Base Year: |
2023 |
Forecast Period: |
2024-2032 |
|
Historical Data: |
2017 to 2023 |
Market Size in 2023: |
USD 103.4 Bn. |
|
Forecast Period 2024-32 CAGR: |
24.2 % |
Market Size in 2032: |
USD 727.14 Bn. |
|
Segments Covered: |
By Solutions |
|
|
|
By Application |
|
||
|
By End Users |
|
||
|
By Region |
|
||
|
Key Market Drivers: |
|
||
|
Key Market Restraints: |
|
||
|
Key Opportunities: |
|
||
|
Companies Covered in the report: |
|
||


