


Video On Demand Market Synopsis
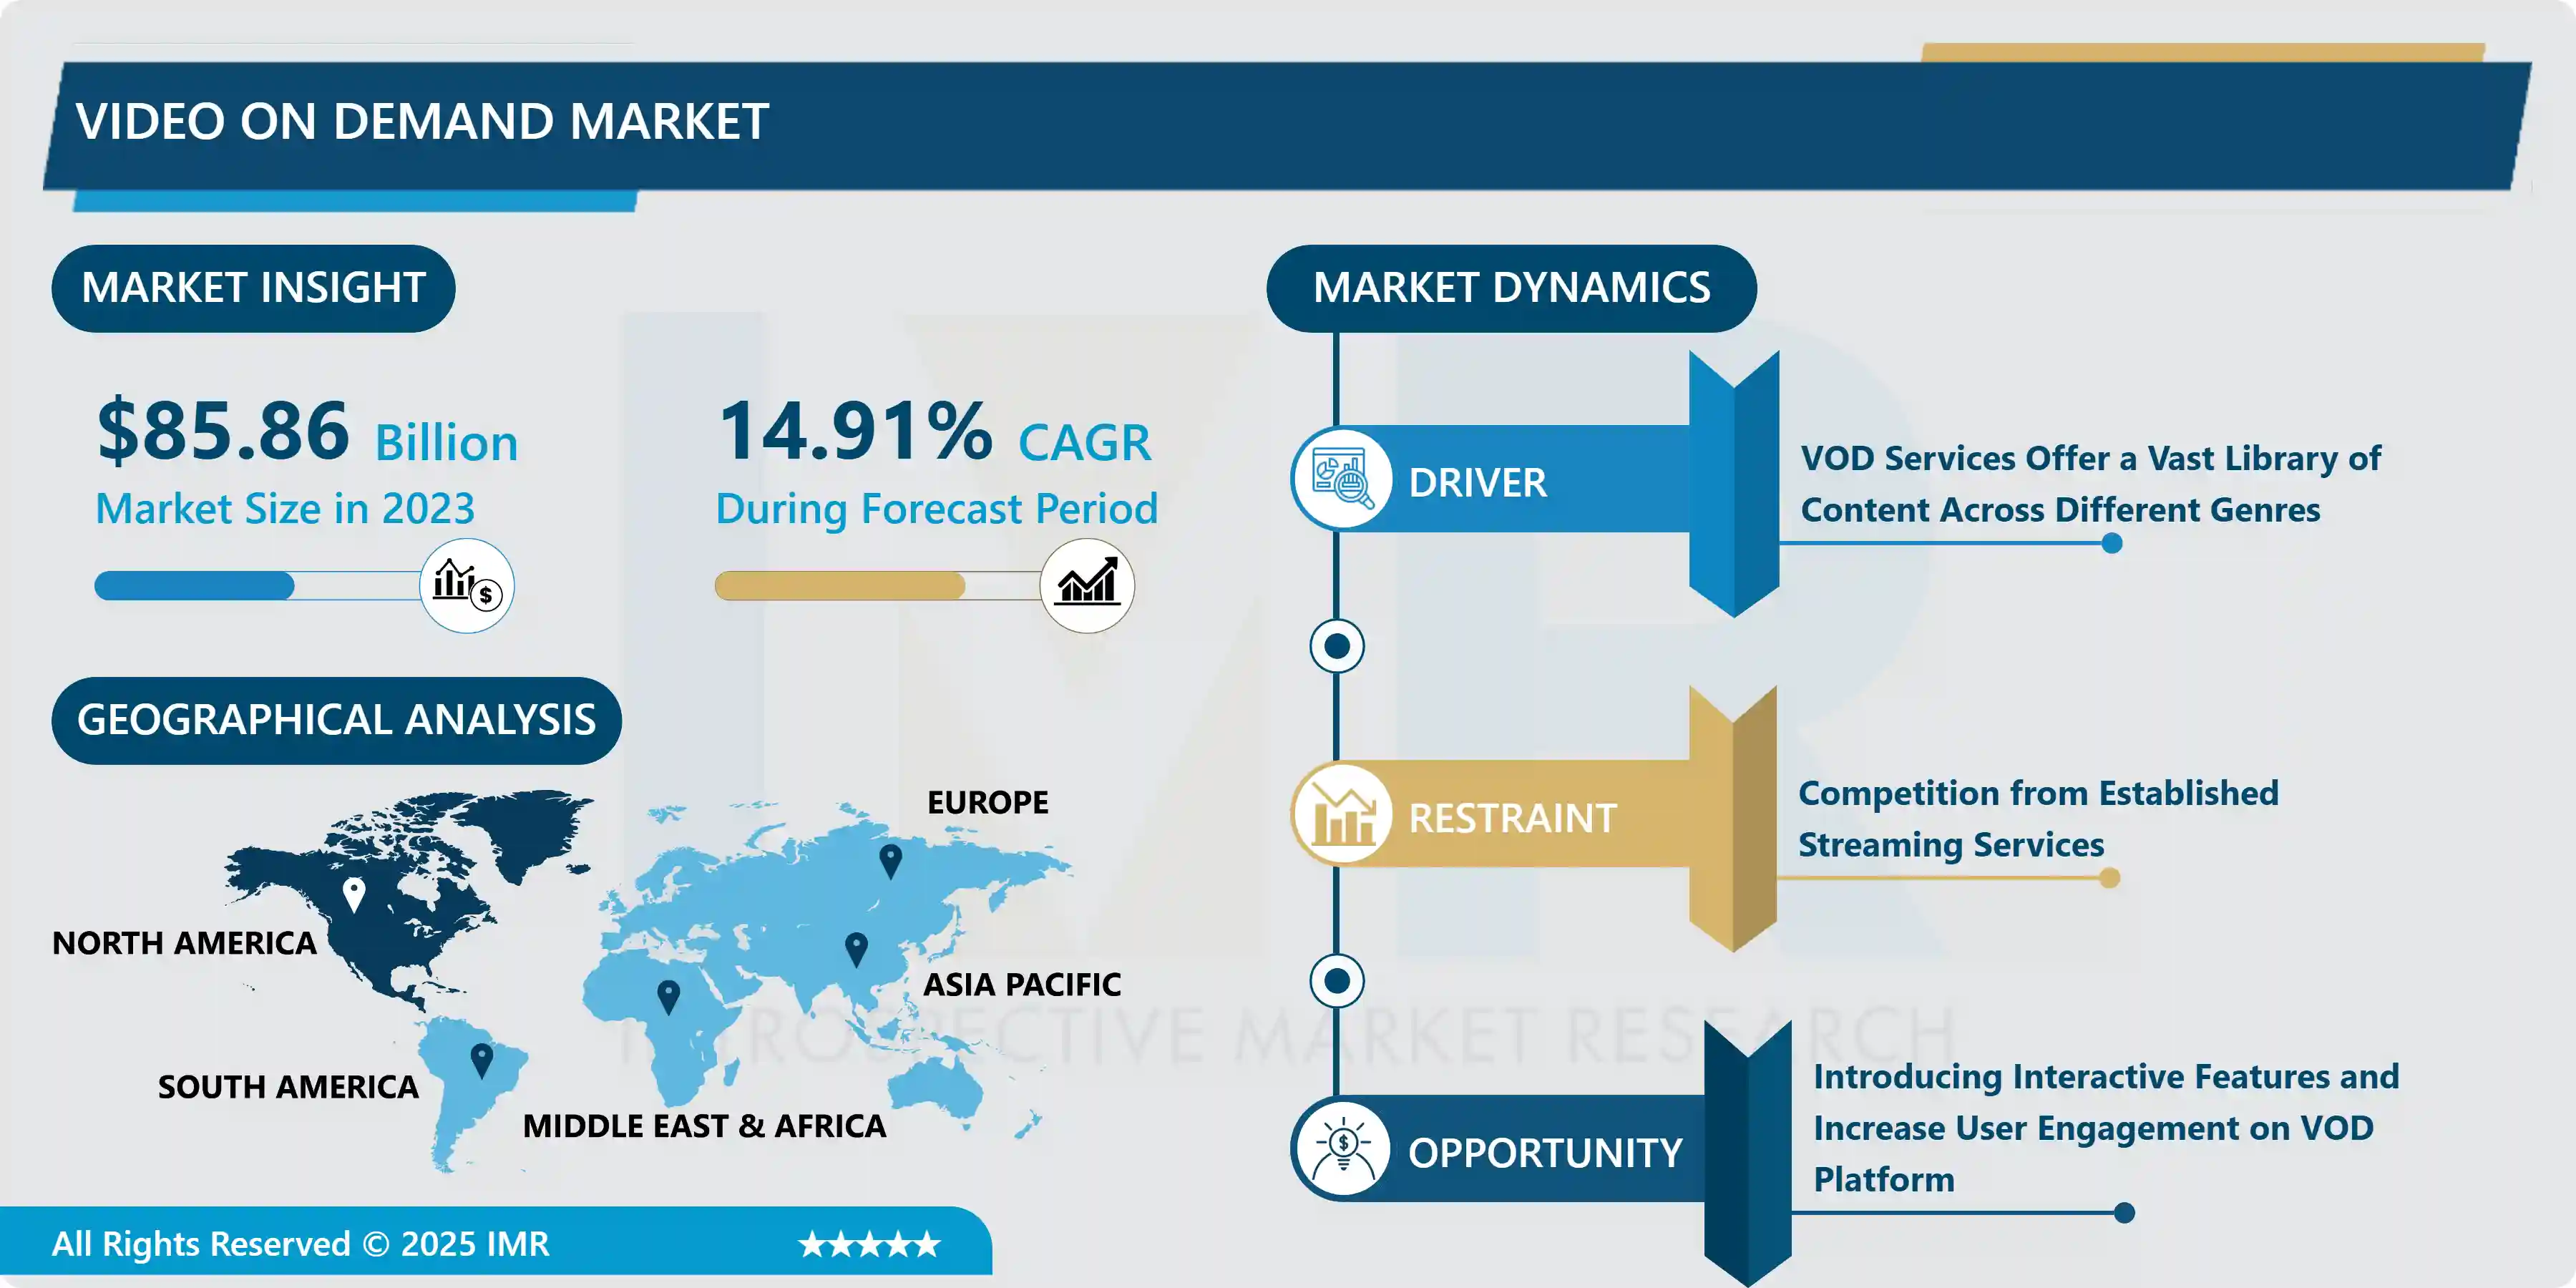
Video On Demand Market Size Was Valued at USD 85.86 Billion in 2023, and is Projected to Reach USD 299.92 Billion by 2032, Growing at a CAGR of 14.91% From 2024-2032.
The Video On Demand (VOD) market refers to the distribution of video content over the internet, allowing users to access and watch videos whenever they choose, rather than following a traditional broadcasting schedule. This market has experienced significant growth due to the proliferation of high-speed internet and the popularity of streaming platforms like Netflix, Amazon Prime Video, Hulu, and Disney+. It offers a wide range of content, including movies, TV shows, documentaries, and original programming, catering to diverse audience preferences.
Video on demand (VOD) is a technology that enables users to access and watch video content anytime they choose, without being limited by traditional broadcasting schedules. Common applications include streaming services like Netflix, Amazon Prime Video, Hulu, and Disney+, which offer a vast library of movies, TV shows, documentaries, and original content for a subscription fee. Catch-up TV services allow viewers to watch missed episodes of their favorite TV shows at their convenience. Transactional VOD (TVOD) services, also known as pay-per-view or rental services, allow users to rent or purchase individual titles for a one-time fee.
VOD is increasingly used to distribute live events, such as concerts, sports games, and conferences, and to provide on-demand access to instructional videos, lectures, and training materials. VOD platforms are also used for corporate training, personal videos, and advertising, with AVOD services like YouTube and Hulu offering free content in exchange for watching ads. VOD (Video On Demand) is a popular streaming service that offers a wide range of content at the user's convenience. It caters to diverse preferences and interests, offering a vast library of content across various genres, languages, and formats. VOD services often use algorithms to recommend content based on users' viewing history, preferences, and behavior.
These platforms are cost-effective, offering subscription-based models or pay-per-view options, allowing users to access content at a fraction of the cost of traditional cable or satellite TV subscriptions. Accessibility is also a key advantage, with internet-connected devices allowing users to stream videos from virtually anywhere. VOD platforms offer ad-free experiences, allowing uninterrupted viewing. They also have a global reach, allowing content creators and distributors to reach broader audiences. However, VOD platforms invest heavily in producing original content, distinguishing them from traditional media outlets.

Video On Demand Market Trend Analysis
VOD Services Offer a Vast Library of Content Across Different Genres
- VOD services offer a wide range of content across various genres, catering to a diverse audience. This allows consumers to select content that aligns with their interests, tastes, and mood, enhancing their viewing experience. Personalization features, such as recommended content based on viewing history and preferences, further enhance consumer satisfaction. In a competitive market, offering a vast library of content can serve as a key differentiator for VOD services.
- VOD services have the potential to reach a global audience by curating a diverse library that appeals to viewers across different demographics, cultures, and regions. This diversity also enables VOD services to cater to niche audiences and underserved demographics, fostering inclusivity and expanding their subscriber base.
- A vast content library creates multiple avenues for monetization beyond subscription fees, such as advertising, pay-per-view rentals, digital purchases, merchandise sales, and licensing deals. The availability of a broad range of content enhances the potential for cross-promotion and upselling, encouraging consumers to explore additional offerings within the platform.
- Content acquisition and licensing require strategic partnerships and negotiations with content owners, studios, distributors, and production companies. Continuous evaluation of consumer preferences and market trends helps VOD providers make informed decisions about content acquisition and library expansion. Exclusive content deals and partnerships with studios, networks, and independent creators can further bolster a service's library, making it more attractive to consumers.
Restraint
Competition from Established Streaming Services
- The Video On Demand (VOD) market faces significant competition from established streaming services like Netflix, Amazon Prime Video, Hulu, and Disney+. These companies have strong brand recognition, extensive content libraries, vast financial resources, and sophisticated technology infrastructure, which makes it difficult for new or smaller platforms to compete.
- The brand recognition, extensive content libraries, substantial financial resources, large subscriber bases, and sophisticated technological infrastructure also pose challenges for new entrants. Brand recognition is crucial for new entrants to attract attention and gain traction in the market.
- Content libraries offer a wide range of content, making it difficult for new entrants to acquire compelling content. Financial resources also play a significant role in the market, allowing for significant investment in content production, marketing, and technological innovations.
Opportunity
Introducing Interactive Features and Increase User Engagement on VOD Platform
- Interactive features on video-on-demand (VOD) platforms can enhance user experience by allowing active participation and engagement with content. These features can increase user engagement, leading to longer viewing sessions, higher retention rates, and potential revenue opportunities through advertising, subscriptions, or pay-per-view models.
- They also provide valuable data insights into viewer preferences, behaviour, and engagement patterns, enabling personalization of recommendations and content offerings. Interactive features also open up new monetization opportunities, such as interactive ads and premium subscription packages. Introducing interactive features can help VOD platforms differentiate themselves from competitors and attract new users, positioning them as market leaders.
- Strategies for implementing interactive features include conducting market research, collaborating with content creators, investing in technology, launching marketing campaigns, and optimizing features based on user feedback and engagement metrics.
Challenge
Illegally Streamed or Downloaded Content can Undermine Revenue Streams
- Illegal content access can lead to lost revenue for video-on-demand (VOD) providers, content creators, and distributors. Subscription-based platforms often face challenges when users can easily find the same content for free through illegal channels, impacting their revenue stream.
- The devaluation of content can also occur, as consumers may become accustomed to free access, making them less willing to pay for legitimate access in the future. Intellectual property concerns arise as unauthorized distribution of copyrighted material undermines content creators' ability to profit from their work.
- Furthermore, illegally streamed or downloaded content often lacks the quality control and security measures implemented by legitimate VOD platforms, exposing users to malware, viruses, or other cybersecurity threats. Therefore, it is crucial for VOD platforms to implement robust quality control measures to protect their content.
Video On Demand Market Segment Analysis:
Video On Demand Market Segmented on the basis of component, subscription models, Content type, and device.
By Subscription Models, Subscription-based segment is expected to dominate the market during the forecast period
- Subscription-based models provide users with unlimited access to a vast library of content for a fixed monthly or annual fee, offering convenience and cost-effectiveness compared to pay-per-view or rental options. These models offer a diverse selection of movies, TV series, documentaries, and original programming across different genres and languages, attracting a broad audience and encouraging long-term subscription commitments.
- Subscription-based also offer an ad-free viewing experience, allowing users to cancel or modify their subscriptions at any time without long-term commitments. Many subscription-based VOD platforms differentiate themselves by offering exclusive content not available on other platforms or traditional television networks.
- These platforms also leverage advanced algorithms and user data to personalize recommendations based on individual viewing habits and preferences, enhancing user engagement and satisfaction, leading to higher retention rates.
By Content Type, TV Entertainment segment held the largest share in 2023
- TV entertainment content, including shows, series, and documentaries, is a popular form of entertainment worldwide due to its diverse genres, formats, and styles. VOD platforms offer a wide range of content, including exclusive rights to popular shows and series, which differentiate them from competitors.
- The global appeal of TV entertainment content allows VOD platforms to reach audiences worldwide, expanding their market reach and revenue potential. Advertising revenue is also generated through subscription-based models and ad-supported streaming services.
- VOD platforms form strategic partnerships with content creators, production studios, and television networks to secure licensing agreements for TV entertainment content, ensuring a steady supply of high-quality programming for subscribers. The rise of binge-watching culture, fueled by on-demand streaming services, has further boosted the popularity of TV content on VOD platforms.
Video On Demand Market Regional Insights:
North America is Expected to Dominate the Market Over the Forecast period
- North America, particularly the US and Canada, is a highly connected and tech-savvy population, making it an attractive market for video-on-demand (VOD) services. With high internet penetration rates, access to high-speed internet is essential for streaming video content, and the availability of reliable infrastructure facilitates the growth of VOD services.
- The entertainment industry, particularly Hollywood, is known for producing high-quality content, attracting viewers both domestically and internationally. North America has been at the forefront of the shift towards digital streaming services, with companies like Netflix, Hulu, and Amazon Prime Video originating in the region.
- The region's diverse consumer preferences, strong economic conditions, and innovative technology ecosystem contribute to its appeal to a broad audience. With a vast library of content, VOD platforms cater to a diverse audience and offer convenience and flexibility over traditional subscriptions.
Video On Demand Market Top Key Players:
- Netflix (US)
- Amazon Prime Video (US)
- Disney+ (US)
- ViacomCBS (US)
- Roku (US)
- Sony Crackle (US)
- Vudu (US)
- Tubi (US)
- Peacock (US)
- Hulu (US)
- Apple TV+ (US)
- HBO Max (US)
- YouTube Premium (US)
- Crave (Canada)
- BBC iPlayer (UK)
- Sky Go (UK)
- NOW TV (UK)
- Mubi (UK)
- DAZN (UK)
- Tencent Video (China)
- Rakuten TV (Japan), and other major players
Key Industry Developments in the Video On Demand Market:
- In October 2023, YouTube announced the launch of artificial intelligence (AI) powered advertising products designed to help brands connect with relevant audiences and optimize campaign performance on the platform.
- In June 2024, Amazon acquired key assets of Indian video streaming service MX Player from the local media powerhouse Times Internet. The deal, finalized on Wednesday evening, saw Amazon taking steps to bolster its presence and brand recognition in smaller cities and towns within the crucial overseas market. According to a source familiar with the matter who spoke to TechCrunch, the acquisition valued MX Player at less than $100 million, considerably lower than its previous $500 million valuation during its last capital raise. The source requested anonymity as the companies had yet to publicly confirm the deal.
|
Global Video On Demand Market |
|||
|
Base Year: |
2023 |
Forecast Period: |
2024-2032 |
|
Historical Data: |
2017 to 2023 |
Market Size in 2023: |
85.86 Bn. |
|
Forecast Period 2024-32 CAGR: |
14.91% |
Market Size in 2032: |
299.92 Bn. |
|
Segments Covered: |
By Component |
|
|
|
By Subscription Models |
|
||
|
By Content Type |
|
||
|
By Device |
|
||
|
By Region |
|
||
|
Key Market Drivers: |
|
||
|
Key Market Restraints: |
|
||
|
Key Opportunities: |
|
||
|
Companies Covered in the report: |
|
||
Chapter 1: Introduction
1.1 Scope and Coverage
Chapter 2:Executive Summary
Chapter 3: Market Landscape
3.1 Market Dynamics
3.1.1 Drivers
3.1.2 Restraints
3.1.3 Opportunities
3.1.4 Challenges
3.2 Market Trend Analysis
3.3 PESTLE Analysis
3.4 Porter's Five Forces Analysis
3.5 Industry Value Chain Analysis
3.6 Ecosystem
3.7 Regulatory Landscape
3.8 Price Trend Analysis
3.9 Patent Analysis
3.10 Technology Evolution
3.11 Investment Pockets
3.12 Import-Export Analysis
Chapter 4: Video on Demand Market by Component (2018-2032)
4.1 Video on Demand Market Snapshot and Growth Engine
4.2 Market Overview
4.3 Service
4.3.1 Introduction and Market Overview
4.3.2 Historic and Forecasted Market Size in Value USD and Volume Units
4.3.3 Key Market Trends, Growth Factors, and Opportunities
4.3.4 Geographic Segmentation Analysis
4.4 Solution
Chapter 5: Video on Demand Market by Subscription Models (2018-2032)
5.1 Video on Demand Market Snapshot and Growth Engine
5.2 Market Overview
5.3 Subscription-based
5.3.1 Introduction and Market Overview
5.3.2 Historic and Forecasted Market Size in Value USD and Volume Units
5.3.3 Key Market Trends, Growth Factors, and Opportunities
5.3.4 Geographic Segmentation Analysis
5.4 Advertising-based
5.5 Transaction-based
Chapter 6: Video on Demand Market by Content Type (2018-2032)
6.1 Video on Demand Market Snapshot and Growth Engine
6.2 Market Overview
6.3 Sports
6.3.1 Introduction and Market Overview
6.3.2 Historic and Forecasted Market Size in Value USD and Volume Units
6.3.3 Key Market Trends, Growth Factors, and Opportunities
6.3.4 Geographic Segmentation Analysis
6.4 Music
6.5 TV Entertainment
6.6 Kids
6.7 Movies
Chapter 7: Video on Demand Market by Device (2018-2032)
7.1 Video on Demand Market Snapshot and Growth Engine
7.2 Market Overview
7.3 Smartphone & Tablets
7.3.1 Introduction and Market Overview
7.3.2 Historic and Forecasted Market Size in Value USD and Volume Units
7.3.3 Key Market Trends, Growth Factors, and Opportunities
7.3.4 Geographic Segmentation Analysis
7.4 TV & Streaming Devices
7.5 Gaming Consoles
Chapter 8: Company Profiles and Competitive Analysis
8.1 Competitive Landscape
8.1.1 Competitive Benchmarking
8.1.2 Video on Demand Market Share by Manufacturer (2024)
8.1.3 Industry BCG Matrix
8.1.4 Heat Map Analysis
8.1.5 Mergers and Acquisitions
8.2 REGAL REXNORD CORPORATION (U.S.)
8.2.1 Company Overview
8.2.2 Key Executives
8.2.3 Company Snapshot
8.2.4 Role of the Company in the Market
8.2.5 Sustainability and Social Responsibility
8.2.6 Operating Business Segments
8.2.7 Product Portfolio
8.2.8 Business Performance
8.2.9 Key Strategic Moves and Recent Developments
8.2.10 SWOT Analysis
8.3 ROCKWELL AUTOMATION INC. (U.S.)
8.4 DELLNER BUBENZER (U.S.)
8.5 PARKER HANNIFIN CORP (U.S.)
8.6 MOOG INC. (U.S.)
8.7 KTR SYSTEMS GMBH (GERMANY)
8.8 SCHAEFFLER AG (GERMANY)
8.9 ROMHELD GMBH (GERMANY)
8.10 SIBRE (GERMANY)
8.11 SCHNEIDER ELECTRIC SE (FRANCE)
8.12 DANFOSS (DENMARK)
8.13 EATON CORPORATION PLC (IRELAND)
8.14 WARTSILA CORPORATION (FINLAND)
8.15 SULZER LTD (SWITZERLAND)
8.16 TREBU TECHNOLOGY (NETHERLANDS)
8.17 TOSHIBA CORPORATION (JAPAN)
8.18 MITSUBISHI ELECTRIC CORPORATION (JAPAN)
8.19 FUJI ELECTRIC FA COMPONENTS & SYSTEMS COLTD (JAPAN)
8.20 NIDEC CORPORATION (JAPAN)
8.21 HITACHI LTD. (JAPAN)
8.22 KSB LIMITED (INDIA)
8.23
Chapter 9: Global Video on Demand Market By Region
9.1 Overview
9.2. North America Video on Demand Market
9.2.1 Key Market Trends, Growth Factors and Opportunities
9.2.2 Top Key Companies
9.2.3 Historic and Forecasted Market Size by Segments
9.2.4 Historic and Forecasted Market Size by Component
9.2.4.1 Service
9.2.4.2 Solution
9.2.5 Historic and Forecasted Market Size by Subscription Models
9.2.5.1 Subscription-based
9.2.5.2 Advertising-based
9.2.5.3 Transaction-based
9.2.6 Historic and Forecasted Market Size by Content Type
9.2.6.1 Sports
9.2.6.2 Music
9.2.6.3 TV Entertainment
9.2.6.4 Kids
9.2.6.5 Movies
9.2.7 Historic and Forecasted Market Size by Device
9.2.7.1 Smartphone & Tablets
9.2.7.2 TV & Streaming Devices
9.2.7.3 Gaming Consoles
9.2.8 Historic and Forecast Market Size by Country
9.2.8.1 US
9.2.8.2 Canada
9.2.8.3 Mexico
9.3. Eastern Europe Video on Demand Market
9.3.1 Key Market Trends, Growth Factors and Opportunities
9.3.2 Top Key Companies
9.3.3 Historic and Forecasted Market Size by Segments
9.3.4 Historic and Forecasted Market Size by Component
9.3.4.1 Service
9.3.4.2 Solution
9.3.5 Historic and Forecasted Market Size by Subscription Models
9.3.5.1 Subscription-based
9.3.5.2 Advertising-based
9.3.5.3 Transaction-based
9.3.6 Historic and Forecasted Market Size by Content Type
9.3.6.1 Sports
9.3.6.2 Music
9.3.6.3 TV Entertainment
9.3.6.4 Kids
9.3.6.5 Movies
9.3.7 Historic and Forecasted Market Size by Device
9.3.7.1 Smartphone & Tablets
9.3.7.2 TV & Streaming Devices
9.3.7.3 Gaming Consoles
9.3.8 Historic and Forecast Market Size by Country
9.3.8.1 Russia
9.3.8.2 Bulgaria
9.3.8.3 The Czech Republic
9.3.8.4 Hungary
9.3.8.5 Poland
9.3.8.6 Romania
9.3.8.7 Rest of Eastern Europe
9.4. Western Europe Video on Demand Market
9.4.1 Key Market Trends, Growth Factors and Opportunities
9.4.2 Top Key Companies
9.4.3 Historic and Forecasted Market Size by Segments
9.4.4 Historic and Forecasted Market Size by Component
9.4.4.1 Service
9.4.4.2 Solution
9.4.5 Historic and Forecasted Market Size by Subscription Models
9.4.5.1 Subscription-based
9.4.5.2 Advertising-based
9.4.5.3 Transaction-based
9.4.6 Historic and Forecasted Market Size by Content Type
9.4.6.1 Sports
9.4.6.2 Music
9.4.6.3 TV Entertainment
9.4.6.4 Kids
9.4.6.5 Movies
9.4.7 Historic and Forecasted Market Size by Device
9.4.7.1 Smartphone & Tablets
9.4.7.2 TV & Streaming Devices
9.4.7.3 Gaming Consoles
9.4.8 Historic and Forecast Market Size by Country
9.4.8.1 Germany
9.4.8.2 UK
9.4.8.3 France
9.4.8.4 The Netherlands
9.4.8.5 Italy
9.4.8.6 Spain
9.4.8.7 Rest of Western Europe
9.5. Asia Pacific Video on Demand Market
9.5.1 Key Market Trends, Growth Factors and Opportunities
9.5.2 Top Key Companies
9.5.3 Historic and Forecasted Market Size by Segments
9.5.4 Historic and Forecasted Market Size by Component
9.5.4.1 Service
9.5.4.2 Solution
9.5.5 Historic and Forecasted Market Size by Subscription Models
9.5.5.1 Subscription-based
9.5.5.2 Advertising-based
9.5.5.3 Transaction-based
9.5.6 Historic and Forecasted Market Size by Content Type
9.5.6.1 Sports
9.5.6.2 Music
9.5.6.3 TV Entertainment
9.5.6.4 Kids
9.5.6.5 Movies
9.5.7 Historic and Forecasted Market Size by Device
9.5.7.1 Smartphone & Tablets
9.5.7.2 TV & Streaming Devices
9.5.7.3 Gaming Consoles
9.5.8 Historic and Forecast Market Size by Country
9.5.8.1 China
9.5.8.2 India
9.5.8.3 Japan
9.5.8.4 South Korea
9.5.8.5 Malaysia
9.5.8.6 Thailand
9.5.8.7 Vietnam
9.5.8.8 The Philippines
9.5.8.9 Australia
9.5.8.10 New Zealand
9.5.8.11 Rest of APAC
9.6. Middle East & Africa Video on Demand Market
9.6.1 Key Market Trends, Growth Factors and Opportunities
9.6.2 Top Key Companies
9.6.3 Historic and Forecasted Market Size by Segments
9.6.4 Historic and Forecasted Market Size by Component
9.6.4.1 Service
9.6.4.2 Solution
9.6.5 Historic and Forecasted Market Size by Subscription Models
9.6.5.1 Subscription-based
9.6.5.2 Advertising-based
9.6.5.3 Transaction-based
9.6.6 Historic and Forecasted Market Size by Content Type
9.6.6.1 Sports
9.6.6.2 Music
9.6.6.3 TV Entertainment
9.6.6.4 Kids
9.6.6.5 Movies
9.6.7 Historic and Forecasted Market Size by Device
9.6.7.1 Smartphone & Tablets
9.6.7.2 TV & Streaming Devices
9.6.7.3 Gaming Consoles
9.6.8 Historic and Forecast Market Size by Country
9.6.8.1 Turkiye
9.6.8.2 Bahrain
9.6.8.3 Kuwait
9.6.8.4 Saudi Arabia
9.6.8.5 Qatar
9.6.8.6 UAE
9.6.8.7 Israel
9.6.8.8 South Africa
9.7. South America Video on Demand Market
9.7.1 Key Market Trends, Growth Factors and Opportunities
9.7.2 Top Key Companies
9.7.3 Historic and Forecasted Market Size by Segments
9.7.4 Historic and Forecasted Market Size by Component
9.7.4.1 Service
9.7.4.2 Solution
9.7.5 Historic and Forecasted Market Size by Subscription Models
9.7.5.1 Subscription-based
9.7.5.2 Advertising-based
9.7.5.3 Transaction-based
9.7.6 Historic and Forecasted Market Size by Content Type
9.7.6.1 Sports
9.7.6.2 Music
9.7.6.3 TV Entertainment
9.7.6.4 Kids
9.7.6.5 Movies
9.7.7 Historic and Forecasted Market Size by Device
9.7.7.1 Smartphone & Tablets
9.7.7.2 TV & Streaming Devices
9.7.7.3 Gaming Consoles
9.7.8 Historic and Forecast Market Size by Country
9.7.8.1 Brazil
9.7.8.2 Argentina
9.7.8.3 Rest of SA
Chapter 10 Analyst Viewpoint and Conclusion
10.1 Recommendations and Concluding Analysis
10.2 Potential Market Strategies
Chapter 11 Research Methodology
11.1 Research Process
11.2 Primary Research
11.3 Secondary Research
|
Global Video On Demand Market |
|||
|
Base Year: |
2023 |
Forecast Period: |
2024-2032 |
|
Historical Data: |
2017 to 2023 |
Market Size in 2023: |
85.86 Bn. |
|
Forecast Period 2024-32 CAGR: |
14.91% |
Market Size in 2032: |
299.92 Bn. |
|
Segments Covered: |
By Component |
|
|
|
By Subscription Models |
|
||
|
By Content Type |
|
||
|
By Device |
|
||
|
By Region |
|
||
|
Key Market Drivers: |
|
||
|
Key Market Restraints: |
|
||
|
Key Opportunities: |
|
||
|
Companies Covered in the report: |
|
||


