


Thermal Imaging Systems Market Synopsis
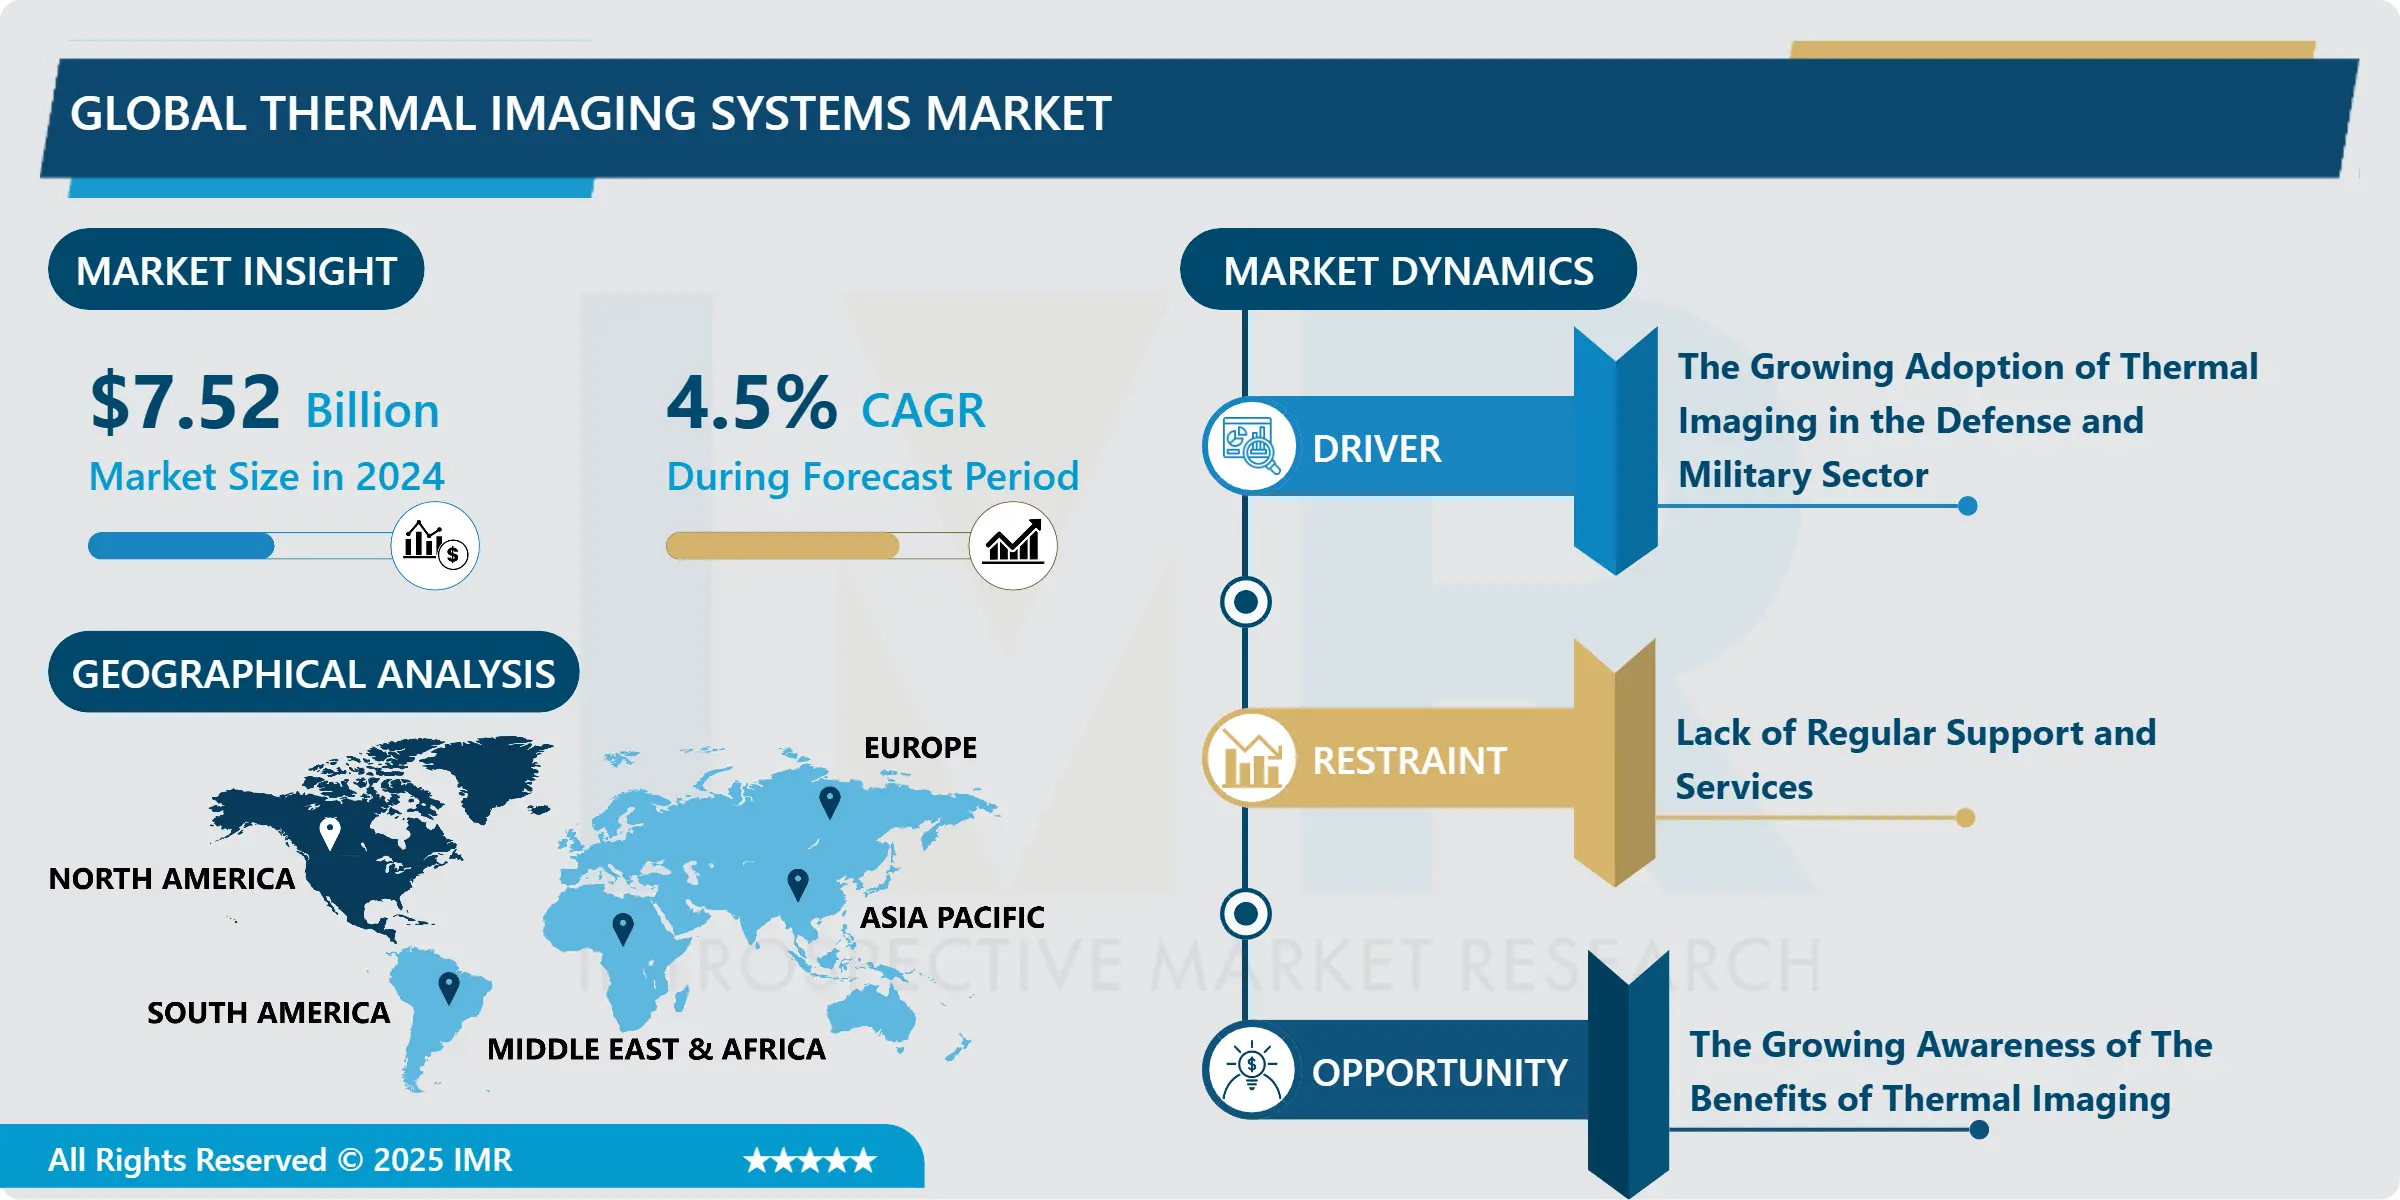
Global Thermal Imaging Systems Market Size Was Valued at USD 7.52 Billion in 2024, and is Projected to Reach USD 10.69 Billion by 2032, Growing at a CAGR of 4.5% From 2025-2032
Thermal imaging systems utilize specialized sensors to detect and capture infrared radiation emitted by objects, generating images reflecting temperature variations. These systems convert thermal energy into visible images, facilitating the identification of heat signatures across various fields including surveillance, medical diagnostics, and industrial inspections. Thermal imaging systems are widely utilized across various sectors due to their versatility and efficacy. In surveillance, these systems improve visibility in low-light conditions and detect intruders or potential threats based on body heat signatures. In medical diagnostics, thermal imaging aids in identifying abnormalities in blood flow, inflammation, or other physiological conditions, facilitating early disease detection and monitoring. Additionally, in industrial inspections, thermal imaging helps detect equipment malfunctions, identify overheating components, and optimize energy efficiency by pinpointing areas of heat loss in buildings or machinery.
They provide non-contact and non-invasive temperature measurements, making them suitable for sensitive environments or with delicate subjects, such as in medical applications. Moreover, thermal imaging offers real-time data visualization, enabling immediate analysis and decision-making in scenarios ranging from firefighting operations to building inspections. Furthermore, these systems operate effectively in challenging conditions like smoke, fog, or darkness, enhancing their utility in critical situations. With industries emphasizing efficiency, safety, and automation, the demand for thermal imaging systems is projected to increase significantly. Advances in sensor technology, image processing algorithms, and integration capabilities will expand the application areas of thermal imaging. Continued developments will lead to more compact, affordable, and user-friendly systems, driving adoption across various industries and sectors.

Thermal Imaging Systems Market Trend Analysis:
The Growing Adoption of Thermal Imaging in the Defense and Military Sector
- The rise in thermal imaging technology adoption within the defense and military sectors significantly propels the expansion of the thermal imaging systems market. Military operations heavily depend on thermal imaging for reconnaissance, surveillance, and target acquisition, granting critical visibility advantages in diverse operational settings, including low-light conditions and harsh weather. Thermal imaging empowers military personnel to detect and recognize potential threats more efficiently, thereby enhancing situational awareness and mission effectiveness.
- Furthermore, advancements in thermal imaging technology have spurred the creation of lightweight and portable systems, seamlessly integrated into military gear such as drones, helmets, and weapon sights. These compact thermal imaging solutions offer increased mobility and adaptability, providing soldiers with enhanced capabilities for navigation, target acquisition, and battlefield awareness. The ongoing investment by the military in modernizing equipment and bolstering soldier capabilities continues to fuel the demand for thermal imaging systems in defense applications.
- Moreover, escalating global security challenges, encompassing terrorism, border tensions, and asymmetric warfare, further drive the widespread adoption of thermal imaging technology by defense and military entities worldwide. Governments prioritize enhancing defense capabilities and upgrading armed forces, fostering a steady increase in demand for thermal imaging systems. This emphasizes the pivotal role played by the defense and military sectors in driving growth and fostering innovation within the thermal imaging systems market.
The Growing Awareness of The Benefits of Thermal Imaging
- The rising recognition of thermal imaging's benefits offers a significant growth opportunity for the market of thermal imaging systems. With industries in various sectors gaining awareness of the advantages provided by thermal imaging technology, there's a growing inclination towards integrating these systems into their operations. Thermal imaging offers valuable insights into temperature variations, enabling improved safety, efficiency, and cost-effectiveness across a spectrum of applications, from building inspections to electrical maintenance.
- Furthermore, advancements in thermal imaging technology have enhanced accessibility and user-friendliness, further driving adoption. Businesses are realizing the potential for enhanced performance and productivity through the deployment of thermal imaging solutions, leading to an increased demand for tailored applications that meet specific industry requirements. For instance, in the automotive sector, thermal imaging aids in the early detection of faults in engines and exhaust systems, facilitating proactive maintenance and minimizing downtime.
- Moreover, the emergence of new markets and the expansion of existing ones contribute to the growing opportunities for thermal imaging systems. Industries such as healthcare, agriculture, and environmental monitoring are increasingly turning to thermal imaging for disease detection, crop management, and ecological research. This growing awareness and utilization of thermal imaging underscore its versatility and potential across various sectors, driving market expansion and fostering ongoing innovation in thermal imaging systems.
Thermal Imaging Systems Market Segment Analysis:
Thermal Imaging Systems Market Segmented on the basis of Product Type, Technology, and Application
By Technology, Microbolometers segment is expected to dominate the market during the forecast period
- The Microbolometers segment is expected to lead the growth of the Thermal Imaging Systems Market. These sensors, renowned for their sensitivity to infrared radiation, play a crucial role in capturing thermal images with precision and accuracy. As industries in sectors like defense, automotive, and aerospace increasingly depend on thermal imaging for diverse applications, the demand for microbolometers is set to rise sharply. Their capability to detect temperature variances and convert them into digital images renders them indispensable in surveillance, medical diagnostics, and industrial inspections.
- Moreover, advancements in technology have resulted in the creation of more efficient and economical microbolometers, further driving their dominance in the market. With ongoing improvements in resolution, sensitivity, and integration capabilities, microbolometers offer superior performance compared to alternative sensor technologies. Consequently, they are preferred by manufacturers and end-users alike, stimulating the expansion of the Thermal Imaging Systems Market and cementing the microbolometers segment's role as a principal growth catalyst.
By Application, Defense & Military segment held the largest share in 2024
- The dominant force behind the growth of the Thermal Imaging Systems Market is the Defense & Military segment. This sector, known for its stringent demands for advanced surveillance and target acquisition capabilities, has generated substantial demand for thermal imaging technology. With an increasing focus on modernizing military equipment and improving situational awareness, defense and military organizations worldwide have made significant investments in thermal imaging systems for reconnaissance, surveillance, and threat detection purposes.
- Moreover, the incorporation of thermal imaging technology into military platforms such as drones, aircraft, and soldier systems has further driven market expansion. These systems offer defense personnel enhanced visibility and operational efficiency in various challenging environments, including low-light conditions and adverse weather. The dominance of the Defense & Military segment in the Thermal Imaging Systems Market highlights the crucial role played by thermal imaging technology in strengthening national security and defense capabilities globally, leading to continuous innovation and advancements in the field.
Thermal Imaging Systems Market Regional Insights:
North America Expected to Dominate the Market Over the Forecast period
- North America is positioned to lead the Thermal Imaging Systems market's expansion. With a strong presence of major market players, innovators in technology, and a substantial defense budget, the region demonstrates a keen interest in adopting advanced thermal imaging solutions. Furthermore, the rising deployment of thermal imaging systems across sectors like defense, aerospace, automotive, and industrial applications fuels market growth in North America.
- Moreover, the region benefits from extensive research and development endeavors and government initiatives aimed at bolstering national security and public safety. These efforts contribute to the widespread adoption of thermal imaging technology in North America. Additionally, stringent regulations concerning safety and security standards drive demand for thermal imaging systems across various applications, further reinforcing North America's prominence as the primary region for Thermal Imaging Systems market growth.
Thermal Imaging Systems Market Top Key Players:
- Flir Systems Inc. (U.S.)
- Fluke Corporation (U.S.)
- Leonardo DRS (U.S.)
- Testo Inc. (U.S.)
- United Technologies (U.S.)
- Teledyne FLIR LLC (U.S.)
- L3Harris Technologies, Inc (U.S.)
- Seek Thermal Inc. (U.S.)
- Trijicon Inc. (U.S.)
- Raytheon Co. (U.S.)
- Bullard GmbH (Germany)
- Xenics (Belgium)
- Axis Communications AB (Sweden)
- BAE Systems plc (UK)
- Thermoteknix Systems (UK)
- HT Italia S.r.l. (Italy)
- Leonardo (Italy)
- Dali Technology Co., Ltd. (China)
- Zhejiang Dali Technology Co., Ltd. (China)
- Opgal Optronic Industries Ltd (Israel)
- Other Active Players
Key Industry Developments in the Thermal Imaging Systems Market:
- In January 2025, Himax Technologies, Inc. (Nasdaq: HIMX), a global leader in fabless display driver ICs and semiconductors, and Calumino Pty. Ltd., a pioneer in intelligent thermal imaging solutions, announced their strategic partnership. The collaboration resulted in the launch of an innovative CMOS imager-based optical thermal sensor. This groundbreaking technology offers superior sensitivity, AI-powered capabilities, enhanced privacy protection, and cost-effective pricing, setting a new standard in AI-driven thermal sensing and imaging for diverse industry applications.
- In December 2024, Teledyne FLIR OEM, a division of Teledyne Technologies Incorporated (NYSE: TDY), in partnership with VSI Labs, announced the results of tests conducted under the upcoming Federal Motor Vehicle Safety Standard (FMVSS) No. 127 pedestrian automatic emergency braking (PAEB) scenarios. The research vehicle equipped with Teledyne FLIR OEM’s latest AEB thermal camera passed all tests, while three new 2024 vehicles failed at least two nighttime test scenarios. The thermal-based system demonstrated superior pedestrian detection, independent of headlight performance.
|
Global Thermal Imaging Systems Market |
|||
|
Base Year: |
2024 |
Forecast Period: |
2025-2032 |
|
Historical Data: |
2018 to 2023 |
Market Size in 2024: |
USD 7.52 Bn. |
|
Forecast Period 2023-30 CAGR: |
4.5% |
Market Size in 2032: |
USD 10.69 Bn. |
|
Segments Covered: |
By Product Type |
|
|
|
By Technology |
|
||
|
By Application |
|
||
|
By Region |
|
||
|
Key Market Drivers: |
|
||
|
Key Market Restraints: |
|
||
|
Key Opportunities: |
|
||
|
Companies Covered in the report: |
|
||
Chapter 1: Introduction
1.1 Scope and Coverage
Chapter 2:Executive Summary
Chapter 3: Market Landscape
3.1 Market Dynamics
3.1.1 Drivers
3.1.2 Restraints
3.1.3 Opportunities
3.1.4 Challenges
3.2 Market Trend Analysis
3.3 PESTLE Analysis
3.4 Porter's Five Forces Analysis
3.5 Industry Value Chain Analysis
3.6 Ecosystem
3.7 Regulatory Landscape
3.8 Price Trend Analysis
3.9 Patent Analysis
3.10 Technology Evolution
3.11 Investment Pockets
3.12 Import-Export Analysis
Chapter 4: Thermal Imaging Systems Market by Product Type (2018-2032)
4.1 Thermal Imaging Systems Market Snapshot and Growth Engine
4.2 Market Overview
4.3 Cameras
4.3.1 Introduction and Market Overview
4.3.2 Historic and Forecasted Market Size in Value USD and Volume Units
4.3.3 Key Market Trends, Growth Factors, and Opportunities
4.3.4 Geographic Segmentation Analysis
4.4 Scopes
4.5 Modules
Chapter 5: Thermal Imaging Systems Market by Technology (2018-2032)
5.1 Thermal Imaging Systems Market Snapshot and Growth Engine
5.2 Market Overview
5.3 Microbolometers
5.3.1 Introduction and Market Overview
5.3.2 Historic and Forecasted Market Size in Value USD and Volume Units
5.3.3 Key Market Trends, Growth Factors, and Opportunities
5.3.4 Geographic Segmentation Analysis
5.4 Quantum Well-Infrared Photodetectors (QWIPs)
5.5 Uncooled
Chapter 6: Thermal Imaging Systems Market by Application (2018-2032)
6.1 Thermal Imaging Systems Market Snapshot and Growth Engine
6.2 Market Overview
6.3 Security & Surveillance
6.3.1 Introduction and Market Overview
6.3.2 Historic and Forecasted Market Size in Value USD and Volume Units
6.3.3 Key Market Trends, Growth Factors, and Opportunities
6.3.4 Geographic Segmentation Analysis
6.4 Defense & Military
6.5 Industrial
6.6 Medical
6.7 Scientific Research
Chapter 7: Company Profiles and Competitive Analysis
7.1 Competitive Landscape
7.1.1 Competitive Benchmarking
7.1.2 Thermal Imaging Systems Market Share by Manufacturer (2024)
7.1.3 Industry BCG Matrix
7.1.4 Heat Map Analysis
7.1.5 Mergers and Acquisitions
7.2 OPTIMO (U.S.)
7.2.1 Company Overview
7.2.2 Key Executives
7.2.3 Company Snapshot
7.2.4 Role of the Company in the Market
7.2.5 Sustainability and Social Responsibility
7.2.6 Operating Business Segments
7.2.7 Product Portfolio
7.2.8 Business Performance
7.2.9 Key Strategic Moves and Recent Developments
7.2.10 SWOT Analysis
7.3 AEROCHEF (U.S.)
7.4 CATERTRAX (U.S.)
7.5 PEACHWORKS (U.S.)
7.6 SQUARE (U.S.)
7.7 EZCATER (U.S.)
7.8 GRUBHUB FOR RESTAURANTS (U.S.)
7.9 CHOWNOW (U.S.)
7.10 OPENTABLE (U.S.)
7.11 THE CBORD GROUP (U.S.)
7.12 HUNGERRUSH (U.S.)
7.13 AGILYSYS NV LLC. (CANADA)
7.14 PXIER (CANADA)
7.15 MONKEYMEDIA SOFTWARE (CANADA)
7.16 EVENT TEMPLE (CANADA)
7.17 DELIVEROO (UK)
7.18 CATERFOX (AUSTRALIA)
7.19 MOBI2GO (NEW ZEALAND)
7.20 GOFRUGAL TECHNOLOGIES (INDIA)
7.21 KOTT SOFTWARE (INDIA)
7.22
Chapter 8: Global Thermal Imaging Systems Market By Region
8.1 Overview
8.2. North America Thermal Imaging Systems Market
8.2.1 Key Market Trends, Growth Factors and Opportunities
8.2.2 Top Key Companies
8.2.3 Historic and Forecasted Market Size by Segments
8.2.4 Historic and Forecasted Market Size by Product Type
8.2.4.1 Cameras
8.2.4.2 Scopes
8.2.4.3 Modules
8.2.5 Historic and Forecasted Market Size by Technology
8.2.5.1 Microbolometers
8.2.5.2 Quantum Well-Infrared Photodetectors (QWIPs)
8.2.5.3 Uncooled
8.2.6 Historic and Forecasted Market Size by Application
8.2.6.1 Security & Surveillance
8.2.6.2 Defense & Military
8.2.6.3 Industrial
8.2.6.4 Medical
8.2.6.5 Scientific Research
8.2.7 Historic and Forecast Market Size by Country
8.2.7.1 US
8.2.7.2 Canada
8.2.7.3 Mexico
8.3. Eastern Europe Thermal Imaging Systems Market
8.3.1 Key Market Trends, Growth Factors and Opportunities
8.3.2 Top Key Companies
8.3.3 Historic and Forecasted Market Size by Segments
8.3.4 Historic and Forecasted Market Size by Product Type
8.3.4.1 Cameras
8.3.4.2 Scopes
8.3.4.3 Modules
8.3.5 Historic and Forecasted Market Size by Technology
8.3.5.1 Microbolometers
8.3.5.2 Quantum Well-Infrared Photodetectors (QWIPs)
8.3.5.3 Uncooled
8.3.6 Historic and Forecasted Market Size by Application
8.3.6.1 Security & Surveillance
8.3.6.2 Defense & Military
8.3.6.3 Industrial
8.3.6.4 Medical
8.3.6.5 Scientific Research
8.3.7 Historic and Forecast Market Size by Country
8.3.7.1 Russia
8.3.7.2 Bulgaria
8.3.7.3 The Czech Republic
8.3.7.4 Hungary
8.3.7.5 Poland
8.3.7.6 Romania
8.3.7.7 Rest of Eastern Europe
8.4. Western Europe Thermal Imaging Systems Market
8.4.1 Key Market Trends, Growth Factors and Opportunities
8.4.2 Top Key Companies
8.4.3 Historic and Forecasted Market Size by Segments
8.4.4 Historic and Forecasted Market Size by Product Type
8.4.4.1 Cameras
8.4.4.2 Scopes
8.4.4.3 Modules
8.4.5 Historic and Forecasted Market Size by Technology
8.4.5.1 Microbolometers
8.4.5.2 Quantum Well-Infrared Photodetectors (QWIPs)
8.4.5.3 Uncooled
8.4.6 Historic and Forecasted Market Size by Application
8.4.6.1 Security & Surveillance
8.4.6.2 Defense & Military
8.4.6.3 Industrial
8.4.6.4 Medical
8.4.6.5 Scientific Research
8.4.7 Historic and Forecast Market Size by Country
8.4.7.1 Germany
8.4.7.2 UK
8.4.7.3 France
8.4.7.4 The Netherlands
8.4.7.5 Italy
8.4.7.6 Spain
8.4.7.7 Rest of Western Europe
8.5. Asia Pacific Thermal Imaging Systems Market
8.5.1 Key Market Trends, Growth Factors and Opportunities
8.5.2 Top Key Companies
8.5.3 Historic and Forecasted Market Size by Segments
8.5.4 Historic and Forecasted Market Size by Product Type
8.5.4.1 Cameras
8.5.4.2 Scopes
8.5.4.3 Modules
8.5.5 Historic and Forecasted Market Size by Technology
8.5.5.1 Microbolometers
8.5.5.2 Quantum Well-Infrared Photodetectors (QWIPs)
8.5.5.3 Uncooled
8.5.6 Historic and Forecasted Market Size by Application
8.5.6.1 Security & Surveillance
8.5.6.2 Defense & Military
8.5.6.3 Industrial
8.5.6.4 Medical
8.5.6.5 Scientific Research
8.5.7 Historic and Forecast Market Size by Country
8.5.7.1 China
8.5.7.2 India
8.5.7.3 Japan
8.5.7.4 South Korea
8.5.7.5 Malaysia
8.5.7.6 Thailand
8.5.7.7 Vietnam
8.5.7.8 The Philippines
8.5.7.9 Australia
8.5.7.10 New Zealand
8.5.7.11 Rest of APAC
8.6. Middle East & Africa Thermal Imaging Systems Market
8.6.1 Key Market Trends, Growth Factors and Opportunities
8.6.2 Top Key Companies
8.6.3 Historic and Forecasted Market Size by Segments
8.6.4 Historic and Forecasted Market Size by Product Type
8.6.4.1 Cameras
8.6.4.2 Scopes
8.6.4.3 Modules
8.6.5 Historic and Forecasted Market Size by Technology
8.6.5.1 Microbolometers
8.6.5.2 Quantum Well-Infrared Photodetectors (QWIPs)
8.6.5.3 Uncooled
8.6.6 Historic and Forecasted Market Size by Application
8.6.6.1 Security & Surveillance
8.6.6.2 Defense & Military
8.6.6.3 Industrial
8.6.6.4 Medical
8.6.6.5 Scientific Research
8.6.7 Historic and Forecast Market Size by Country
8.6.7.1 Turkiye
8.6.7.2 Bahrain
8.6.7.3 Kuwait
8.6.7.4 Saudi Arabia
8.6.7.5 Qatar
8.6.7.6 UAE
8.6.7.7 Israel
8.6.7.8 South Africa
8.7. South America Thermal Imaging Systems Market
8.7.1 Key Market Trends, Growth Factors and Opportunities
8.7.2 Top Key Companies
8.7.3 Historic and Forecasted Market Size by Segments
8.7.4 Historic and Forecasted Market Size by Product Type
8.7.4.1 Cameras
8.7.4.2 Scopes
8.7.4.3 Modules
8.7.5 Historic and Forecasted Market Size by Technology
8.7.5.1 Microbolometers
8.7.5.2 Quantum Well-Infrared Photodetectors (QWIPs)
8.7.5.3 Uncooled
8.7.6 Historic and Forecasted Market Size by Application
8.7.6.1 Security & Surveillance
8.7.6.2 Defense & Military
8.7.6.3 Industrial
8.7.6.4 Medical
8.7.6.5 Scientific Research
8.7.7 Historic and Forecast Market Size by Country
8.7.7.1 Brazil
8.7.7.2 Argentina
8.7.7.3 Rest of SA
Chapter 9 Analyst Viewpoint and Conclusion
9.1 Recommendations and Concluding Analysis
9.2 Potential Market Strategies
Chapter 10 Research Methodology
10.1 Research Process
10.2 Primary Research
10.3 Secondary Research
|
Global Thermal Imaging Systems Market |
|||
|
Base Year: |
2024 |
Forecast Period: |
2025-2032 |
|
Historical Data: |
2018 to 2023 |
Market Size in 2024: |
USD 7.52 Bn. |
|
Forecast Period 2023-30 CAGR: |
4.5% |
Market Size in 2032: |
USD 10.69 Bn. |
|
Segments Covered: |
By Product Type |
|
|
|
By Technology |
|
||
|
By Application |
|
||
|
By Region |
|
||
|
Key Market Drivers: |
|
||
|
Key Market Restraints: |
|
||
|
Key Opportunities: |
|
||
|
Companies Covered in the report: |
|
||


