


Global Surface Inspection Market Overview
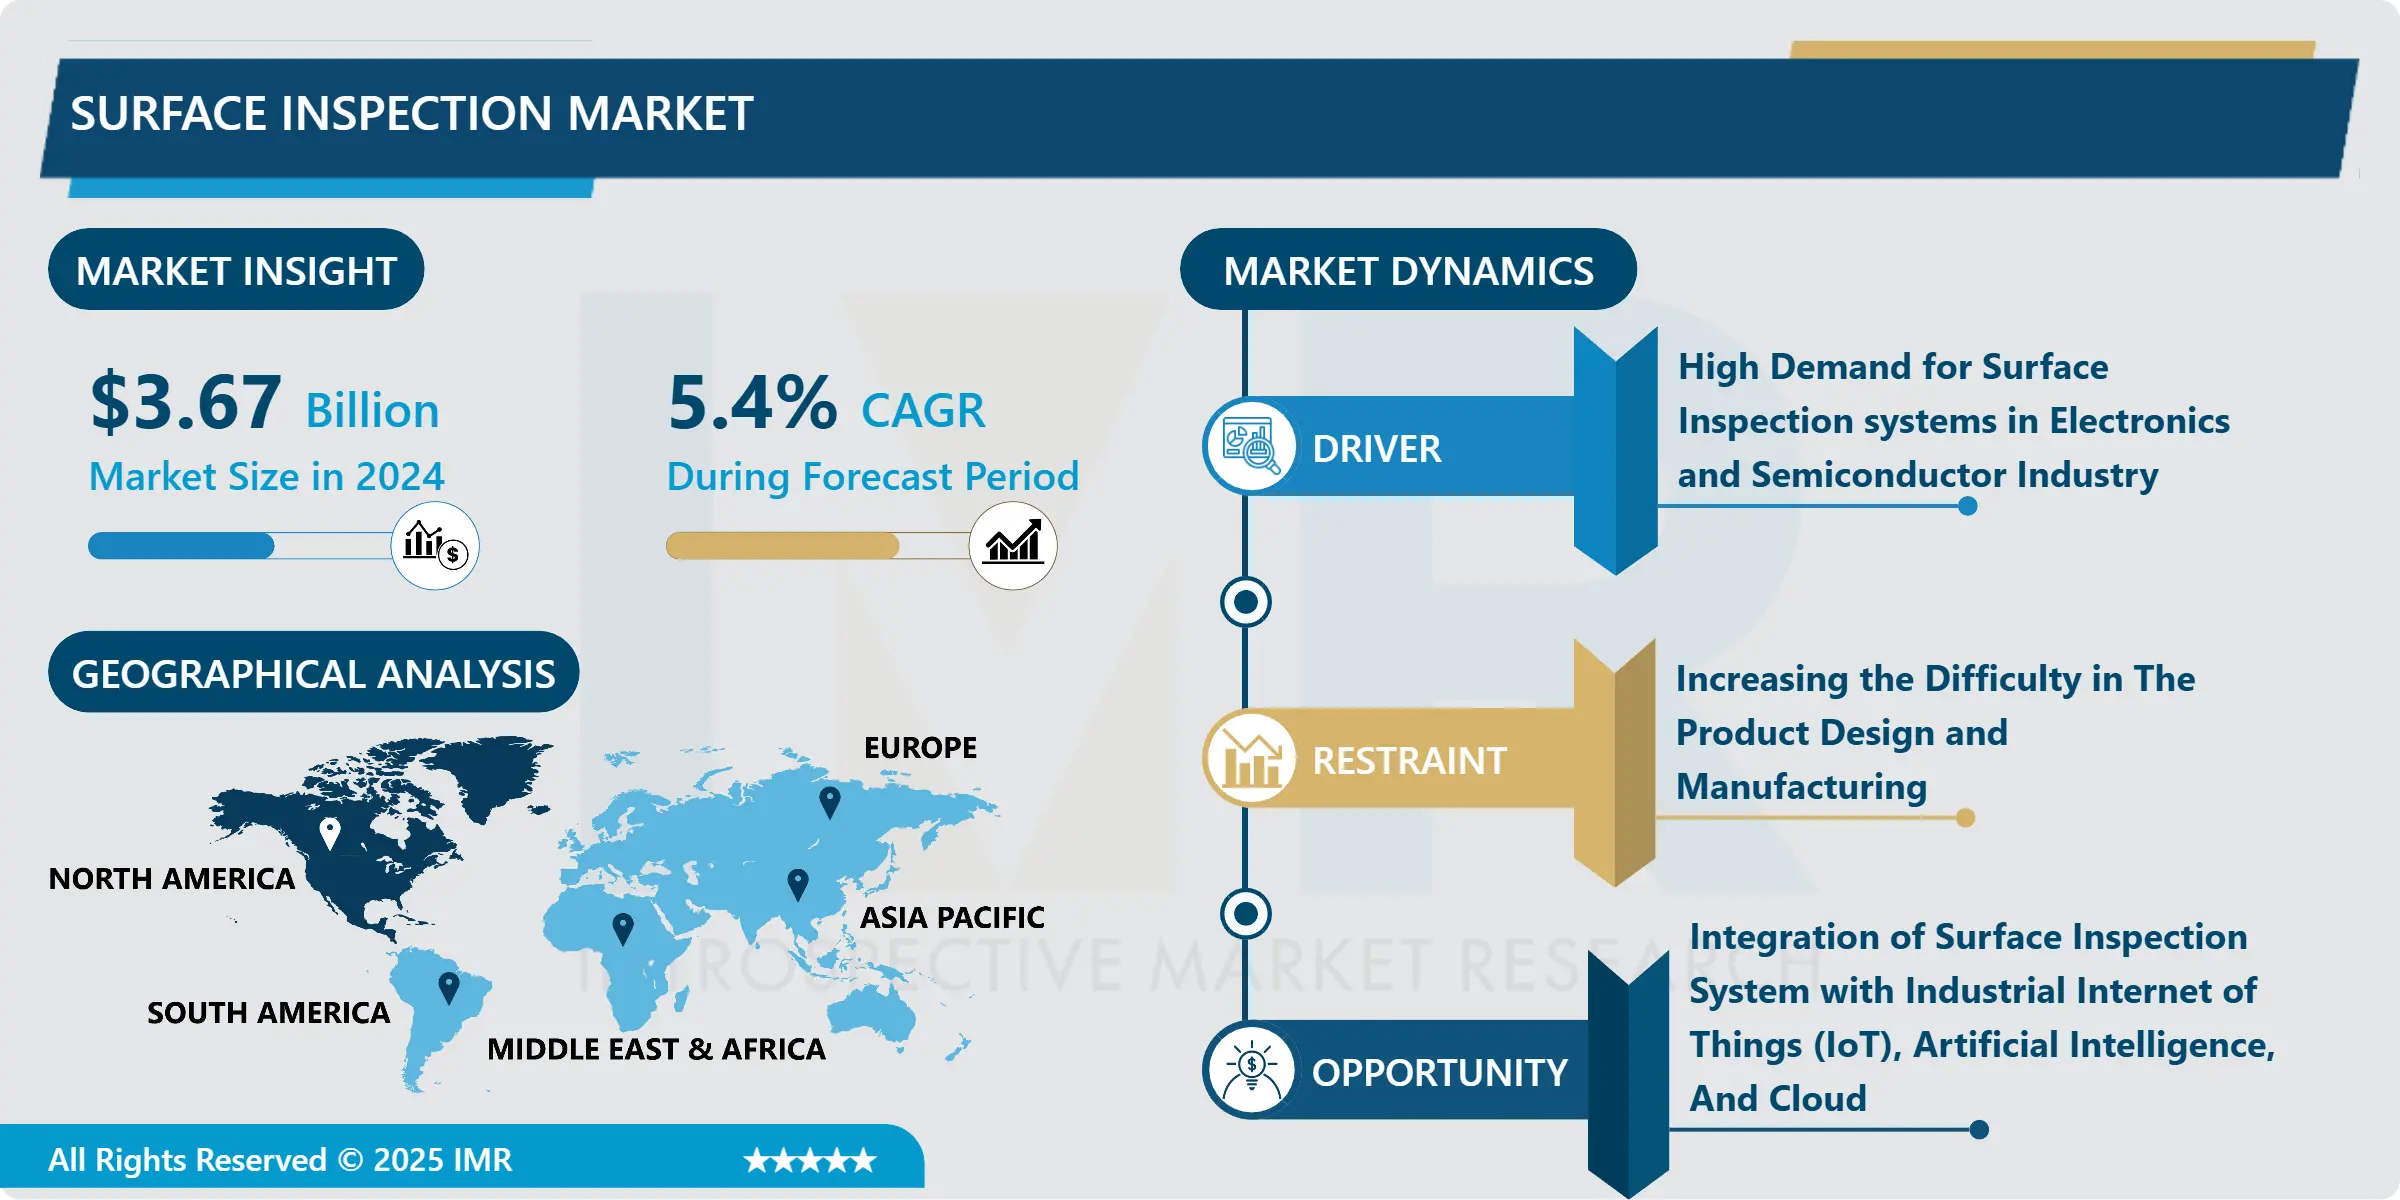
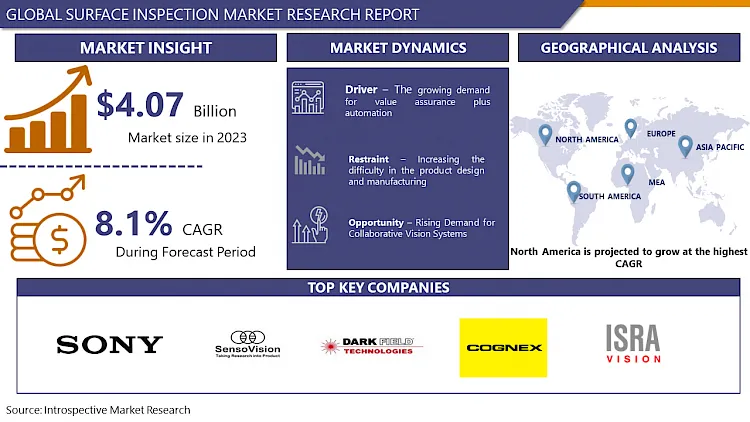
The Global Surface Inspection market was valued at USD 3.67 billion in 2024 and is expected to reach USD 5.59 billion by 2032, at a CAGR of 8.1% from 2025-2032.
The Surface Inspection Market encompasses systems and solutions designed for quality assurance in manufacturing by detecting defects on surfaces. Employing advanced imaging technologies like machine vision and AI, it ensures the integrity of surfaces in industries spanning automotive, electronics, pharmaceuticals, and more. Components such as cameras, optics, lighting, and software enable precise defect identification on both 2D and 3D surfaces. Deployment options range from traditional standalone systems to robotic cells, offering increased automation and efficiency. Key verticals like automotive, chemical, and packaging rely on surface inspection for maintaining product quality and meeting regulatory standards, driving market growth and innovation.
The surface inspection involves the application of angled lighting and smart cameras to accurately detect surface flaws or features, in real-time, on objects as they are manufactured. Machine vision surface inspection can be a challenge owing to the nature and variety of the product or object. Surface inspection systems are utilized for the consistent inspection and monitoring of surface, and surveillance utilizations. Surface inspection searches for cracks, holes, joints, dents, textures, and scratches that arise during the process of production and cross-border transportation. Automated vision inspection systems are developed to serve an extensive range of components and can be utilized for packaging, machine builders, pharmaceuticals, medical devices, automotive, sorting manufacturing, and other automation and robotic applications. Surface vision and inspection systems help producing companies rises process accuracy, productivity, and save cost. Hardware and software utilized in these systems process, analyze, and measure various characteristics in greater detail and derive significant evaluations. This inspection process is a majorly authentic electronic replacement for manual inspection processes.
Market Dynamics For The Surface Inspection Market
Drivers:
The major driver for the Surface Inspection Market is the growing demand for value assurance plus automation. This is the reason that labor pays are rising and firms are falling the cost by automation. The human fault is decreased through automation and speediness. Innovative solutions, for instance, machine vision (MV) supports inspecting the product mechanically, which increases the efficiency of the production technique. The manufacturers prefer MV for the photographic inspections that want replicability of dimensions, elevated magnification, and utmost speed. This technology is generally utilized in the semiconductor industry for manufacturing purposes. Furthermore, 3D image is getting extensive among several industries, for instance, locomotive, solar cells, semiconductors, and printing.
Moreover, growth in the appropriation of smart cameras, enhanced software, and powerful image processors due to their significance and features. Features and technologies of components such as the image sensors, processors, camera, illumination equipment, optics, and software determine the performance of a surface inspection system. The capabilities of smart cameras have been extended owing to developments in embedded processors, enabling them to accomplish inspection activities autonomously. In April 2020, Cognex (US) launched In-Sight D900, the world's first industrial smart camera powered by deep learning. Optical character recognition (OCR), assembly verification, and defect detection are a few of the complex in-line inspection utilizations that these self-contained systems can handle. Declined manufacturing errors, consistent maintenance of product quality, and decreased production wastage are some of the advantages of surface vision & inspection equipment. As per the Monetary Watch, the Changing Precision Technology Company, a production factory in Dongguan, China, saw an accurate drop of 80% in defects, 250% rise in productivity while making certain better quality at the same time, with the implementation of inspection systems and industrial robots.
Restraints:
Increasing the difficulty in the product design and manufacturing might restraint the growth of the surface inspection market over the forecast period. Furthermore, compatibility is a critical function in any factory or production facility. A modular framework must exist for both hardware and software to connect and coordinate various surface inspection systems. The emphasis is not only on the software side, which is utilized for programming, diagnosing, and monitoring but also on the hardware substitutability between surface inspections (vision system) and robot arms. In the manufacturing and processing sectors, there have been cases where a client purchased a robot arm and a surface inspection separately that were not fully consistent with each other, and the setup was a massive challenge from the start.
Opportunities:
Collaborative robots are becoming more popular owing to them enabling humans and robots to work effectively together in open or unchained environments. They are extensively accepted not only in small and medium-sized businesses but also large-scale, traditional industries including automotive. The demand for collaborative vision systems is rising owing to the fast-changing nature of industries. This situation is witnessed in the consumer goods industry, especially packaging, where the surface, shape, size, or weight of the packaging is continuously changing. Furthermore, surface inspection systems are being consolidated with robots, which enhance process speed, declines costs, and overcome human errors. These systems are also known as VGR systems, are used in the food processing industries, automotive, and electronics. With the rising demand and requirement for robots, so will the demand for surface inspection systems. Different major key players such as VITRONIC (Germany), Kitov (Israel), Cognex (US), ISRA VISION (Germany), and moving into robot-based surface inspection systems.
Market Segmentation
Segmentation Analysis of Surface Inspection Market
Based on Type, the 3D type segment is expected to record the maximum surface inspection market share during the forecast period. Growing demand for product quality and the complexity of surfaces, 3D surface inspection techniques are replacing 2D surface inspection techniques in production and quality control. Owing to the 3D techniques overcome the challenges of 2D techniques and enable producers to inspect beyond the two planes of a product; they also offer data on the height of the product, thereby adding data points to make more authentic conclusions. Due to the developments in accuracy and speed in both 3D scanners and point cloud data processing, 3D scanning has become a growingly effective and popular method of capturing surface geometry.
Based on the Component, cameras segment type is expected to dominate the surface inspection market throughout the forecast period. Continuous developments in microchips and LEDs used in cameras are facilitating the production of reliable, smaller, and economical products. Producers apply smart and digital cameras as they produce more efficient results than analog cameras. The demand for standalone processors is anticipated to be overcome due to the accessibility of camera-based systems equipped with onboard processors. With the emergence of high-resolution cameras, frame grabbers are not required for low-end applications. Key players are manufacturing cameras, which can be utilized for both 2D and 3D applications. For example, KEYENCE (Japan) manufactures the XR series, which can be used to acquire both 3D and 2D images. Different companies are also manufacturing smart cameras with more than 5 MP image sensors depending upon the nature of the utilization.
Based on Industry Vertical, the automotive industry is expected to register the maximum surface inspection market share over the forecast period. The automotive industry needs inspection of various large objects such as door panels by multiple cameras. The automotive sector increasingly depends on highly effective surface inspection systems to defense against defects at various stages of production. Surface inspection systems record various material and production-induced defects. Surface inspection is utilized for inspecting defects in complex parts such as cylinder bores, and cylinder heads, on flat components such as crankcases, cylinder head gaskets, and also on printed electronics. Multiple camera solutions are more economical with computer-based systems.
Regional Analysis of Surface Inspection Market:
North America dominates the surface inspection industry, with a substantial market share of around 38%. The strength of this stronghold is due to various factors, one of which is the region's strong manufacturing sector in fields like automotive, aerospace, and electronics, driving the need for advanced inspection solutions. In addition, North America's strong technological innovation in automation and artificial intelligence contributes to ongoing developments in surface inspection technologies. With well-developed infrastructure promoting easy technology integration, the area is home to top companies such as Cognex, Keyence, and GE Automation & Controls, which drive the advancement and implementation of cutting-edge inspection systems. Recent advancements in the industry, like a collaboration between a US car maker and Cognex to use AI-driven vision technology for automated body inspection, highlight North America's dedication to advancing surface inspection standards.
Players Covered in Surface Inspection market are :
- Sony (Japan)
- SensoVision Systems (India)
- Dark Field Technologies (US)
- Cognex (US)
- ISRA VISION (Germany)
- OMRON (Japan)
- Teledyne Technologies (US)
- KEYENCE (Japan)
- In-Core Systèmes (France)
- Matrox Electronic Systems (Canada)
- Basler (Germany)
- VITRONIC (Germany)
- Teledyne FLIR (US)
- Kitov (Isarel)
- Baumer (Switzerland)
- IMS Messsysteme (Germany)
- Panasonic (Japan)
- AMETEK (US)
- INB Vision (Germany)
- Radiant Vision Systems (US)
- Sick (Germany)
- MORITEX (Japan)
- Kevision Systems (India)
- Allied Vision Technologies (Germany)
- Industrial Vision Systems (UK)
- Intego (Germany)
- PIXARGUS (Germany)
- Sipotek (China)
- National Instruments (US)
- ADLINK (Taiwan)
- Perceptron (US)
- STEMMER IMAGING (Germany)
- Alpha Techsys (India)
- Flyability (Switzerland)
- 4D Technology (US)
- Bluewrist (Canada)
- Datalogic (Italy)
- elunic (Germany)
- Integro Technologies (US)
- Nanonets (US) and other active Players.
Key Industry Developments In Surface Inspection Market
- In November 2020, Teledyne Technologies launched the Genie Nano-CXP 67M and 37M cameras, which are based on Teledyne e2v Emerald color and monochrome sensors. The cameras are developed for high-speed data transfer in industrial imaging applications, such as industrial automation, packaging inspection, semiconductor inspection, electronics manufacturing, PCB-AOI (Automated Optical Inspection), and general machine vision.
-
In 2023, advancements in technology led to significant development in the field of surface inspection. Significantly, automation and artificial intelligence were crucial in improving the efficiency and accuracy of inspection procedures. At the same time, advancements in sensor technologies increased the range of detectable flaws, with non-destructive testing methods such as eddy current and ultrasonic testing becoming more widely used in various sectors. The Surface Inspection Summit (SIS) Europe 2023 was a vital platform for stakeholders to discuss the most recent advancements and research in the field. Technology will continue to evolve in the future, focusing on remote monitoring and adapting inspection solutions to suit various industry requirements.
|
Global Surface Inspection Market |
|||
|
Base Year: |
2024 |
Forecast Period: |
2025-2032 |
|
Historical Data: |
2018 to 2023 |
Market Size in 2024: |
USD 3.67 Bn. |
|
Forecast Period 2022-28 CAGR: |
5.4% |
Market Size in 2032: |
USD 5.59 Bn. |
|
Segments Covered: |
By Surface Type |
|
|
|
By Component |
|
||
|
By Deployment Type |
|
||
|
By Industry Vertical |
|
||
|
By Region |
|
||
|
Key Market Drivers: |
|
||
|
Key Market Restraints: |
|
||
|
Key Opportunities: |
|
||
|
Companies Covered in the report: |
|
||
Chapter 1: Introduction
1.1 Scope and Coverage
Chapter 2:Executive Summary
Chapter 3: Market Landscape
3.1 Market Dynamics
3.1.1 Drivers
3.1.2 Restraints
3.1.3 Opportunities
3.1.4 Challenges
3.2 Market Trend Analysis
3.3 PESTLE Analysis
3.4 Porter's Five Forces Analysis
3.5 Industry Value Chain Analysis
3.6 Ecosystem
3.7 Regulatory Landscape
3.8 Price Trend Analysis
3.9 Patent Analysis
3.10 Technology Evolution
3.11 Investment Pockets
3.12 Import-Export Analysis
Chapter 4: Surface Inspection Market by Surface Type (2018-2032)
4.1 Surface Inspection Market Snapshot and Growth Engine
4.2 Market Overview
4.3 2D
4.3.1 Introduction and Market Overview
4.3.2 Historic and Forecasted Market Size in Value USD and Volume Units
4.3.3 Key Market Trends, Growth Factors, and Opportunities
4.3.4 Geographic Segmentation Analysis
4.4 3D
Chapter 5: Surface Inspection Market by Component (2018-2032)
5.1 Surface Inspection Market Snapshot and Growth Engine
5.2 Market Overview
5.3 Cameras
5.3.1 Introduction and Market Overview
5.3.2 Historic and Forecasted Market Size in Value USD and Volume Units
5.3.3 Key Market Trends, Growth Factors, and Opportunities
5.3.4 Geographic Segmentation Analysis
5.4 Frame Grabbers
5.5 Optics
5.6 Lighting Equipment
5.7 Software
5.8 Others
Chapter 6: Surface Inspection Market by Deployment Type (2018-2032)
6.1 Surface Inspection Market Snapshot and Growth Engine
6.2 Market Overview
6.3 Traditional System
6.3.1 Introduction and Market Overview
6.3.2 Historic and Forecasted Market Size in Value USD and Volume Units
6.3.3 Key Market Trends, Growth Factors, and Opportunities
6.3.4 Geographic Segmentation Analysis
6.4 Robotic Cells
Chapter 7: Surface Inspection Market by Industry Vertical (2018-2032)
7.1 Surface Inspection Market Snapshot and Growth Engine
7.2 Market Overview
7.3 Chemical & Petrochemical
7.3.1 Introduction and Market Overview
7.3.2 Historic and Forecasted Market Size in Value USD and Volume Units
7.3.3 Key Market Trends, Growth Factors, and Opportunities
7.3.4 Geographic Segmentation Analysis
7.4 Oil & Gas
7.5 Energy & Power
7.6 Automotive
7.7 Others
Chapter 8: Company Profiles and Competitive Analysis
8.1 Competitive Landscape
8.1.1 Competitive Benchmarking
8.1.2 Surface Inspection Market Share by Manufacturer (2024)
8.1.3 Industry BCG Matrix
8.1.4 Heat Map Analysis
8.1.5 Mergers and Acquisitions
8.2 HUAFON GROUP
8.2.1 Company Overview
8.2.2 Key Executives
8.2.3 Company Snapshot
8.2.4 Role of the Company in the Market
8.2.5 Sustainability and Social Responsibility
8.2.6 Operating Business Segments
8.2.7 Product Portfolio
8.2.8 Business Performance
8.2.9 Key Strategic Moves and Recent Developments
8.2.10 SWOT Analysis
8.3 KURARAY
8.4 TORAY
8.5 WENZHOU IMITATION LEATHER
8.6 ALFATEX
8.7 ZHEJIANG HEXIN INDUSTRY GROUP CO. LTDANHUI ANLI MATERIAL TECHNOLOGY CO.LTDKUNSHAN XIEFU ARTIFICIAL LEATHER CO. LTDSHANDONG TONGDA TEXTILE MACHINERY (GROUP) CO.LTDTONGDA ISLAND
8.8 DOUBLE ELEPHANT
8.9 TOPSUN MICRO FIBER
8.10 YANTAI WANHUA SYNTHETIC LEATHER GROUP CO. LTDTEIJIN CORDLEY
8.11 ASAHI KASEI MAYUR UNIQUOTERS LIMITED
8.12 XIANGYU XINGHONG
8.13 CLARINO
8.14 KOLON INDUSTRIES
8.15 SAN FANG CHEMICAL INDUSTRY CO. LTDWANHUA MICRO FIBER
8.16 JEONGSAN INTERNATIONAL
8.17 MEISHENG GROUP
8.18 FILWEL
8.19 HUAFENG GROUP
8.20 FUJIAN TIANSHOU
8.21 ECSAINE
8.22 SANLING MICRO FIBER
8.23 SISA
8.24 NPC
8.25 ECOLORICA
8.26 H.R.POLYCOATS PVT. LTD.
Chapter 9: Global Surface Inspection Market By Region
9.1 Overview
9.2. North America Surface Inspection Market
9.2.1 Key Market Trends, Growth Factors and Opportunities
9.2.2 Top Key Companies
9.2.3 Historic and Forecasted Market Size by Segments
9.2.4 Historic and Forecasted Market Size by Surface Type
9.2.4.1 2D
9.2.4.2 3D
9.2.5 Historic and Forecasted Market Size by Component
9.2.5.1 Cameras
9.2.5.2 Frame Grabbers
9.2.5.3 Optics
9.2.5.4 Lighting Equipment
9.2.5.5 Software
9.2.5.6 Others
9.2.6 Historic and Forecasted Market Size by Deployment Type
9.2.6.1 Traditional System
9.2.6.2 Robotic Cells
9.2.7 Historic and Forecasted Market Size by Industry Vertical
9.2.7.1 Chemical & Petrochemical
9.2.7.2 Oil & Gas
9.2.7.3 Energy & Power
9.2.7.4 Automotive
9.2.7.5 Others
9.2.8 Historic and Forecast Market Size by Country
9.2.8.1 US
9.2.8.2 Canada
9.2.8.3 Mexico
9.3. Eastern Europe Surface Inspection Market
9.3.1 Key Market Trends, Growth Factors and Opportunities
9.3.2 Top Key Companies
9.3.3 Historic and Forecasted Market Size by Segments
9.3.4 Historic and Forecasted Market Size by Surface Type
9.3.4.1 2D
9.3.4.2 3D
9.3.5 Historic and Forecasted Market Size by Component
9.3.5.1 Cameras
9.3.5.2 Frame Grabbers
9.3.5.3 Optics
9.3.5.4 Lighting Equipment
9.3.5.5 Software
9.3.5.6 Others
9.3.6 Historic and Forecasted Market Size by Deployment Type
9.3.6.1 Traditional System
9.3.6.2 Robotic Cells
9.3.7 Historic and Forecasted Market Size by Industry Vertical
9.3.7.1 Chemical & Petrochemical
9.3.7.2 Oil & Gas
9.3.7.3 Energy & Power
9.3.7.4 Automotive
9.3.7.5 Others
9.3.8 Historic and Forecast Market Size by Country
9.3.8.1 Russia
9.3.8.2 Bulgaria
9.3.8.3 The Czech Republic
9.3.8.4 Hungary
9.3.8.5 Poland
9.3.8.6 Romania
9.3.8.7 Rest of Eastern Europe
9.4. Western Europe Surface Inspection Market
9.4.1 Key Market Trends, Growth Factors and Opportunities
9.4.2 Top Key Companies
9.4.3 Historic and Forecasted Market Size by Segments
9.4.4 Historic and Forecasted Market Size by Surface Type
9.4.4.1 2D
9.4.4.2 3D
9.4.5 Historic and Forecasted Market Size by Component
9.4.5.1 Cameras
9.4.5.2 Frame Grabbers
9.4.5.3 Optics
9.4.5.4 Lighting Equipment
9.4.5.5 Software
9.4.5.6 Others
9.4.6 Historic and Forecasted Market Size by Deployment Type
9.4.6.1 Traditional System
9.4.6.2 Robotic Cells
9.4.7 Historic and Forecasted Market Size by Industry Vertical
9.4.7.1 Chemical & Petrochemical
9.4.7.2 Oil & Gas
9.4.7.3 Energy & Power
9.4.7.4 Automotive
9.4.7.5 Others
9.4.8 Historic and Forecast Market Size by Country
9.4.8.1 Germany
9.4.8.2 UK
9.4.8.3 France
9.4.8.4 The Netherlands
9.4.8.5 Italy
9.4.8.6 Spain
9.4.8.7 Rest of Western Europe
9.5. Asia Pacific Surface Inspection Market
9.5.1 Key Market Trends, Growth Factors and Opportunities
9.5.2 Top Key Companies
9.5.3 Historic and Forecasted Market Size by Segments
9.5.4 Historic and Forecasted Market Size by Surface Type
9.5.4.1 2D
9.5.4.2 3D
9.5.5 Historic and Forecasted Market Size by Component
9.5.5.1 Cameras
9.5.5.2 Frame Grabbers
9.5.5.3 Optics
9.5.5.4 Lighting Equipment
9.5.5.5 Software
9.5.5.6 Others
9.5.6 Historic and Forecasted Market Size by Deployment Type
9.5.6.1 Traditional System
9.5.6.2 Robotic Cells
9.5.7 Historic and Forecasted Market Size by Industry Vertical
9.5.7.1 Chemical & Petrochemical
9.5.7.2 Oil & Gas
9.5.7.3 Energy & Power
9.5.7.4 Automotive
9.5.7.5 Others
9.5.8 Historic and Forecast Market Size by Country
9.5.8.1 China
9.5.8.2 India
9.5.8.3 Japan
9.5.8.4 South Korea
9.5.8.5 Malaysia
9.5.8.6 Thailand
9.5.8.7 Vietnam
9.5.8.8 The Philippines
9.5.8.9 Australia
9.5.8.10 New Zealand
9.5.8.11 Rest of APAC
9.6. Middle East & Africa Surface Inspection Market
9.6.1 Key Market Trends, Growth Factors and Opportunities
9.6.2 Top Key Companies
9.6.3 Historic and Forecasted Market Size by Segments
9.6.4 Historic and Forecasted Market Size by Surface Type
9.6.4.1 2D
9.6.4.2 3D
9.6.5 Historic and Forecasted Market Size by Component
9.6.5.1 Cameras
9.6.5.2 Frame Grabbers
9.6.5.3 Optics
9.6.5.4 Lighting Equipment
9.6.5.5 Software
9.6.5.6 Others
9.6.6 Historic and Forecasted Market Size by Deployment Type
9.6.6.1 Traditional System
9.6.6.2 Robotic Cells
9.6.7 Historic and Forecasted Market Size by Industry Vertical
9.6.7.1 Chemical & Petrochemical
9.6.7.2 Oil & Gas
9.6.7.3 Energy & Power
9.6.7.4 Automotive
9.6.7.5 Others
9.6.8 Historic and Forecast Market Size by Country
9.6.8.1 Turkiye
9.6.8.2 Bahrain
9.6.8.3 Kuwait
9.6.8.4 Saudi Arabia
9.6.8.5 Qatar
9.6.8.6 UAE
9.6.8.7 Israel
9.6.8.8 South Africa
9.7. South America Surface Inspection Market
9.7.1 Key Market Trends, Growth Factors and Opportunities
9.7.2 Top Key Companies
9.7.3 Historic and Forecasted Market Size by Segments
9.7.4 Historic and Forecasted Market Size by Surface Type
9.7.4.1 2D
9.7.4.2 3D
9.7.5 Historic and Forecasted Market Size by Component
9.7.5.1 Cameras
9.7.5.2 Frame Grabbers
9.7.5.3 Optics
9.7.5.4 Lighting Equipment
9.7.5.5 Software
9.7.5.6 Others
9.7.6 Historic and Forecasted Market Size by Deployment Type
9.7.6.1 Traditional System
9.7.6.2 Robotic Cells
9.7.7 Historic and Forecasted Market Size by Industry Vertical
9.7.7.1 Chemical & Petrochemical
9.7.7.2 Oil & Gas
9.7.7.3 Energy & Power
9.7.7.4 Automotive
9.7.7.5 Others
9.7.8 Historic and Forecast Market Size by Country
9.7.8.1 Brazil
9.7.8.2 Argentina
9.7.8.3 Rest of SA
Chapter 10 Analyst Viewpoint and Conclusion
10.1 Recommendations and Concluding Analysis
10.2 Potential Market Strategies
Chapter 11 Research Methodology
11.1 Research Process
11.2 Primary Research
11.3 Secondary Research
|
Global Surface Inspection Market |
|||
|
Base Year: |
2024 |
Forecast Period: |
2025-2032 |
|
Historical Data: |
2018 to 2023 |
Market Size in 2024: |
USD 3.67 Bn. |
|
Forecast Period 2022-28 CAGR: |
5.4% |
Market Size in 2032: |
USD 5.59 Bn. |
|
Segments Covered: |
By Surface Type |
|
|
|
By Component |
|
||
|
By Deployment Type |
|
||
|
By Industry Vertical |
|
||
|
By Region |
|
||
|
Key Market Drivers: |
|
||
|
Key Market Restraints: |
|
||
|
Key Opportunities: |
|
||
|
Companies Covered in the report: |
|
||


