


Smart Warehousing Market Synopsis
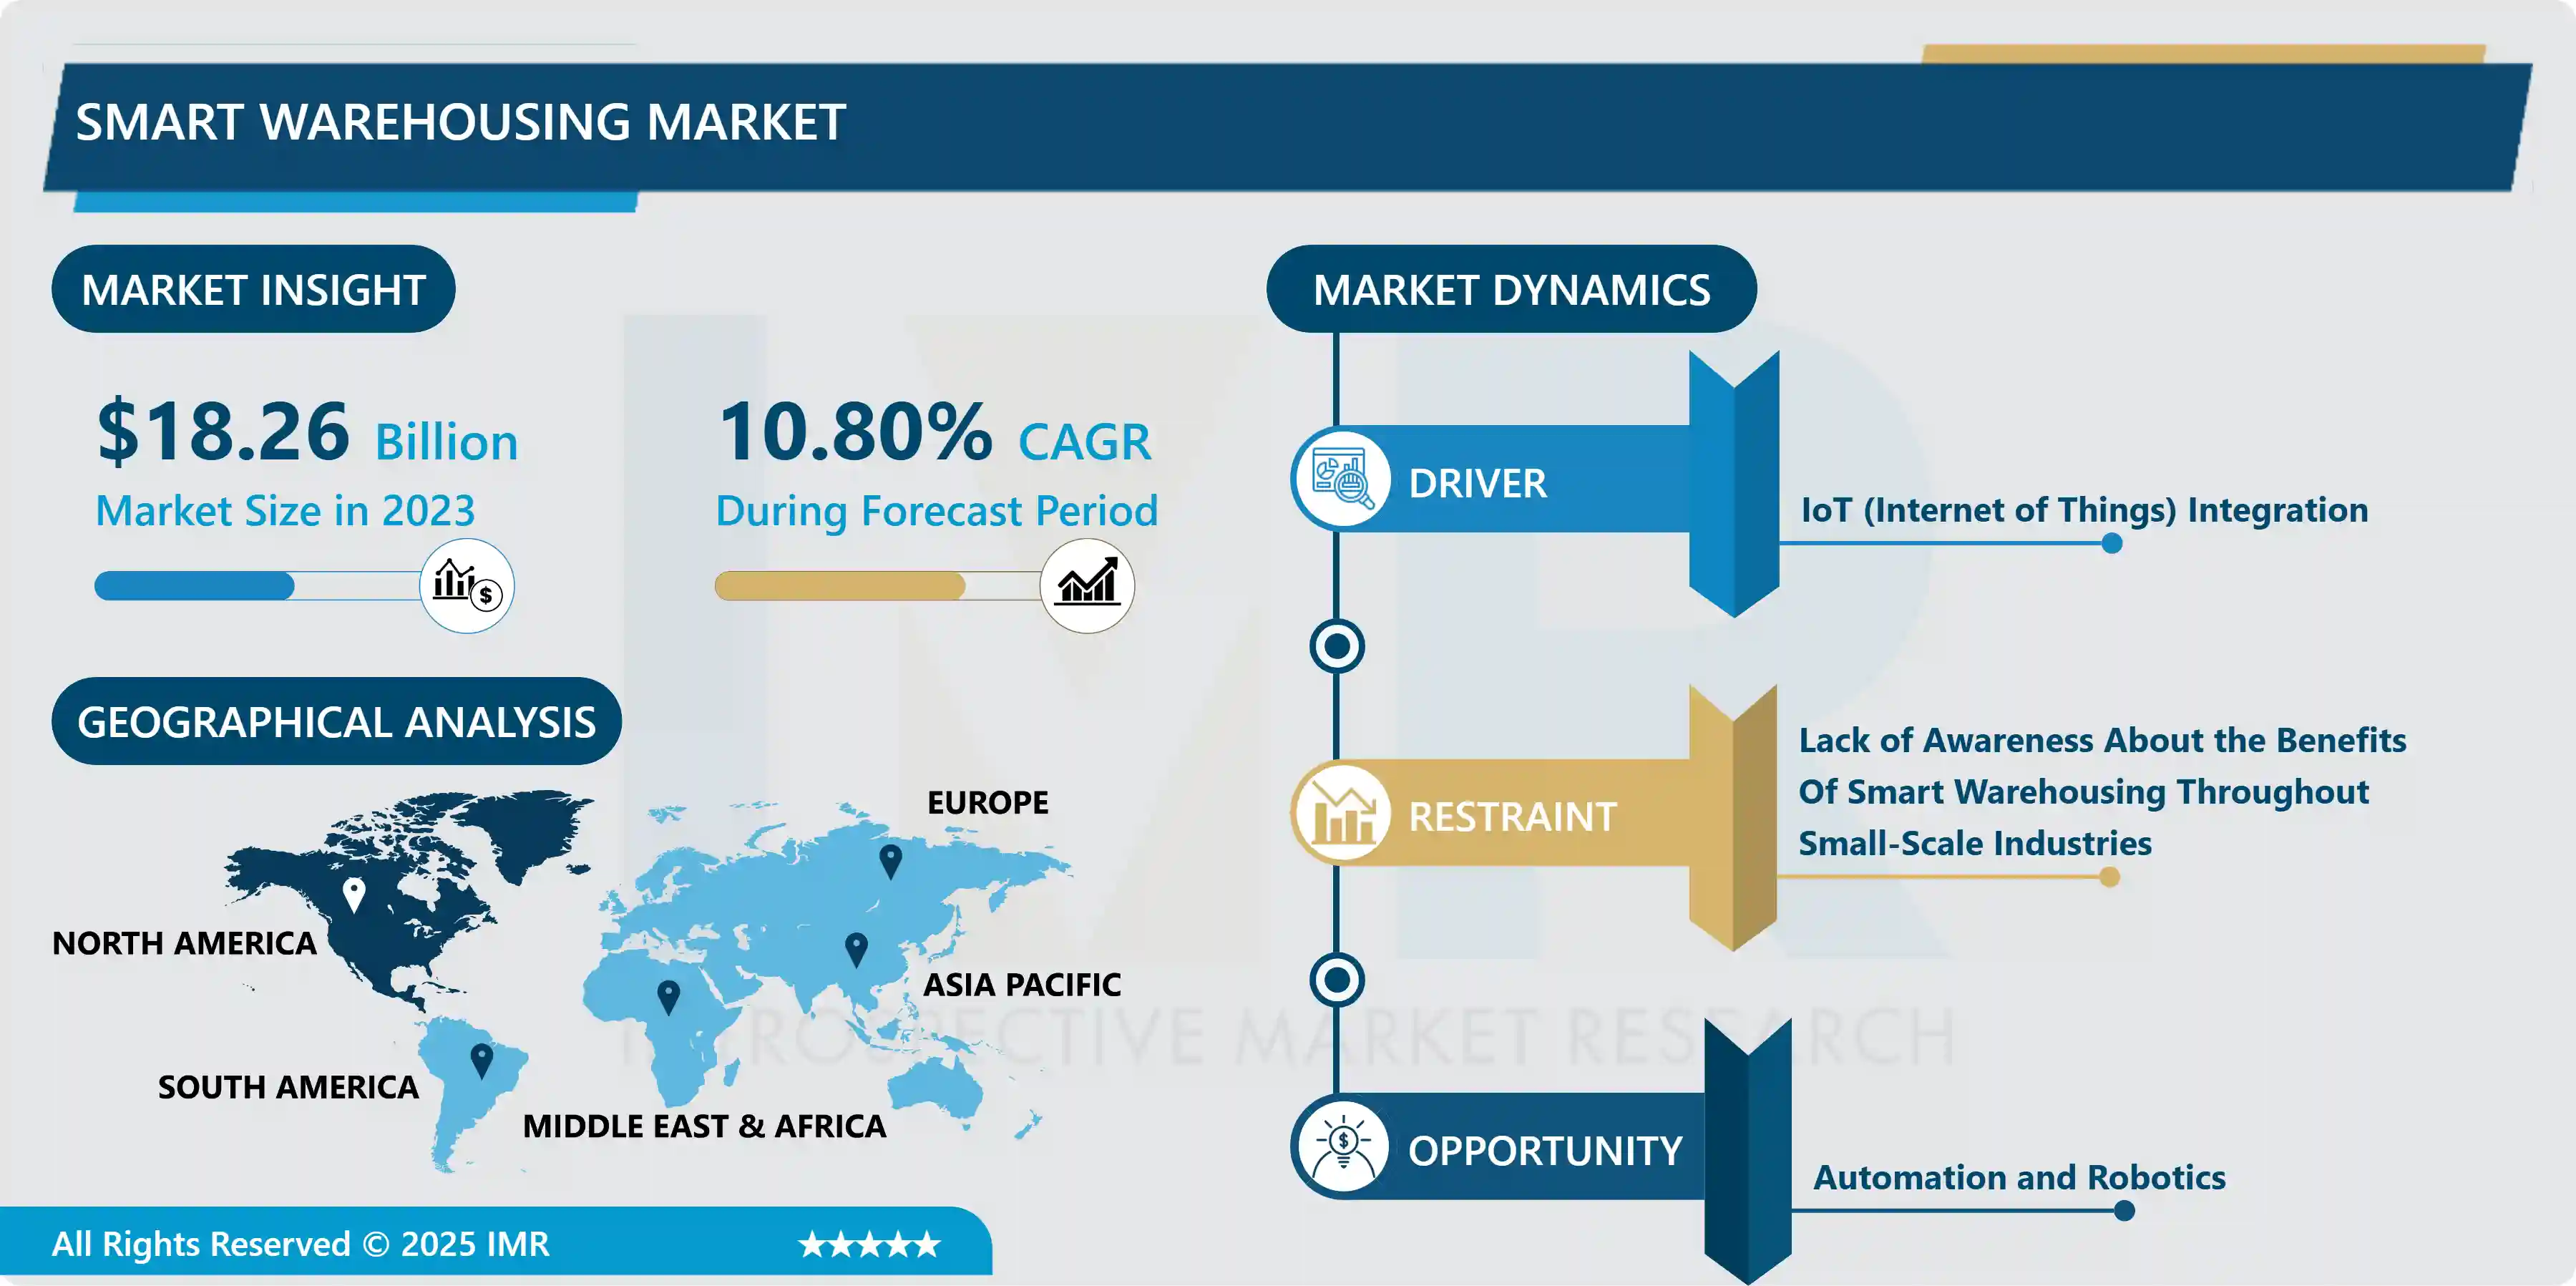
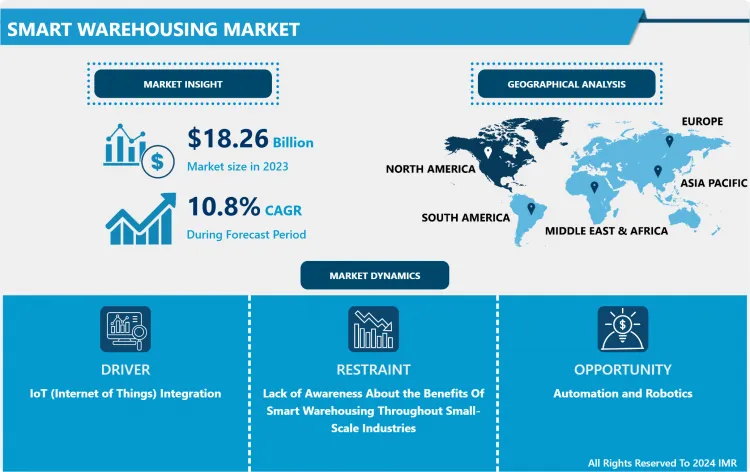
The Smart Warehousing Market was valued at USD 18.26 Billion in 2023 and is projected to reach USD 45.96 Billion by 2032, growing at a CAGR of 10.8% from 2024 to 2032.
The ultimate of warehouse automation is a smart warehouse (in other words, automating various components of warehousing operations). A smart warehouse, like a smart home, is equipped with several automated and networked technology.
These technologies work together to boost warehouse productivity and efficiency while reducing mistakes and reducing the number of human workers. Smart warehouse solutions are designed to give businesses real-time visibility into their operations, allowing them to optimize procedures and make quick adjustments to boost efficiency. Smart warehouses can also eliminate the bulk of human error and improve facility safety and security. Overall, the key advantages of a smart warehouse are its capacity to save time and money, enhance profitability, and improve client and customer happiness.
As the demand for inventory management accuracy develops as a result of the rise in online shopping, smart warehouses have become increasingly vital and useful. Online businesses must give consumers reliable, real-time information regarding product availability. This is made possible by the data visibility provided by smart warehouse systems, which also helps to reduce out-of-stock problems, improve customer service, and increase customer happiness, resulting in increased customer and brand loyalty.
Smart warehousing features like automated picking and mobile sorting solutions allow you to store more items in less space by allowing you to have taller racks and smaller lanes in the warehouse. Ocado, a British online food business, for example, employed warehouse automation and saved a lot of space. Simple bots are used to move and lift goods. They can lift boxes higher than a person can.
The smart warehouse can process over 60,000 orders each week and is open 24 hours a day, seven days a week. According to Knight Frank's 2020 estimate, the United Kingdom alone would need 92 million square feet of warehouse space by 2024. This means that, in the future, it will be critical to make cost-effective use of the currently restricted places. As a result, warehouse automation was born.
Smart Warehousing Market Trend Analysis
IoT (Internet of Things) Integration
- The Smart Warehousing market is experiencing significant growth, primarily propelled by the pervasive integration of IoT (Internet of Things) technologies. IoT integration serves as a crucial driving factor, revolutionizing traditional warehouse management systems. By embedding sensors, actuators, and connected devices throughout the warehouse infrastructure, businesses can achieve real-time visibility and control over their operations.
- IoT facilitates seamless communication between various elements within a warehouse, including inventory, machinery, and personnel. This connectivity enables automated processes, such as inventory tracking, predictive maintenance, and optimized route planning for goods movement. Real-time data generated by IoT devices enhances decision-making, allowing for efficient resource allocation and minimizing operational bottlenecks.
- Furthermore, IoT integration contributes to the creation of smart, adaptive systems that respond dynamically to changing demands. The ability to monitor and analyze data in real time empowers warehouse managers to enhance productivity, reduce costs, and improve overall operational efficiency.
Automation and Robotics creates an Opportunity for Smart Warehousing Market
- Smart Warehousing market, automation and robotics emerge as transformative opportunities, revolutionizing traditional warehouse operations. The integration of advanced technologies not only enhances efficiency but also addresses the evolving demands of modern supply chain management.
- Automation plays a pivotal role in optimizing various warehousing processes, from inventory management to order fulfilment. Automated systems, such as robotic pickers and conveyors, streamline operations, reducing manual errors and accelerating throughput. This not only boosts productivity but also ensures a higher level of accuracy in inventory tracking.
- Robotics further amplifies the potential of smart warehouses by introducing autonomous vehicles, drones, and robotic arms. These technologies enable swift and precise handling of goods, minimizing human intervention in routine and repetitive tasks. Real-time data analytics and connectivity empower these robotic systems to adapt quickly to changing demands, enhancing overall responsiveness and agility within the warehouse environment.
Smart Warehousing Market Segment Analysis:
Smart Warehousing Market Segmented on the basis of Component, Technology, Application and Vertical.
By Component, Hardware segment is expected to dominate the market during the forecast period
- The hardware segment is poised to assert its dominance, fueled by technological advancements and the growing demand for efficient and automated warehouse operations. The hardware component encompasses a range of essential elements such as sensors, RFID systems, barcode scanners, robotics, and automated material handling equipment.
- The surge in e-commerce activities, coupled with the need for streamlined supply chain management, has elevated the significance of hardware solutions in smart warehousing. Automated systems, including robotics and IoT-enabled devices, play a pivotal role in enhancing warehouse productivity and minimizing operational costs. These technologies facilitate real-time tracking, inventory management, and order fulfilment, contributing to the overall efficiency of the supply chain.
- Moreover, the hardware segment is witnessing continuous innovation, with the integration of artificial intelligence (AI) and machine learning (ML) algorithms, further optimizing warehouse processes.
By Technology, IoT & Analytics segment held the largest share of 63% in 2022
- The Smart Warehousing market is poised for substantial growth, with the IoT (Internet of Things) and Analytics segment emerging as a dominant force. This technology-driven sector leverages interconnected devices and advanced data analytics to revolutionize warehouse operations. IoT plays a pivotal role by connecting various elements within the warehouse ecosystem, including sensors, RFID tags, and smart devices, creating a seamless and intelligent network.
- Through real-time monitoring and data collection, IoT enhances inventory management, order fulfilment, and overall operational efficiency. Analytics complements IoT by extracting valuable insights from the vast amount of data generated, enabling informed decision-making and predictive analysis. This synergy significantly reduces operational costs, minimizes errors, and optimizes resource utilization.
Smart Warehousing Market Regional Insights:
North America is Expected to Dominate the Market Over the Forecast period
- North America accounts for the largest revenue share contribution to the global smart warehousing market owing to various factors such as rising adoption of smart warehousing hardware, software, and services, early adoption of new technological advancements, and the presence of key players in this region. Because of the growing demand for automated warehouse cycles for increased productivity, effectiveness, and precision, smart warehousing technologies, solutions, and services are expected to gain traction in this area. Smart warehouse solutions allow for greater adaptability and increase employee capacity. Manhattan Associates, for example, announced the Manhattan Active Warehouse Management agreement in May 2020. Inside distribution management, Manhattan Active WMS clients enjoy a new level of speed, agility, and ease. In addition, the market in North America is driven by the early adoption of modern technologies and the presence of important competitors.
- Due to rapid technological progress and the growing e-commerce sector, Asia Pacific is predicted to have the quickest growth in the worldwide smart warehousing market. Malaysia, for example, would leverage the new Cainiao emphasis to expand as an air freight center, according to news released on November 4th, 2021. It includes a 100,000-square-meter warehouse for freight terminal operations, warehousing, and logistics, as well as a computerized custom clearing technology that reduces clearance time from 24-48 hours to only an hour and a half. The e-commerce business is growing as a result of the increased usage of smartphones, which is driving the smart warehousing market in this area. According to the Indian Brand Equity Foundation (IBEF), smartphone consumers are predicted to reach 476 million by 2022, and e-commerce sales are expected to increase by 1,200 percent by 2026.
Smart Warehousing Market Top Key Players:
- IBM (US)
- Oracle (US)
- Manhattan Associates (US)
- PTC (US)
- Infor (US)
- Softeon (US)
- Blue Yonder (US)
- IAM Robotics (US)
- Epicor (US)
- 3PL Central (US)
- BlueJay Solutions (US)
- Mantis (US)
- Synergy Logistics (US)
- Foysonis (US)
- Locus Robotics (US)
- ShipHero (US)
- Orderhive US)
- Logiwa (US)
- Tecsys (Canada)
- Generic (France)
- PSI Logistics (Germany)
- Korber (Germany)
- SAP (Germany)
- Reply (Italy)
- EasyEcom (India)
- Vinculum (India)
- WareIQ (India)
- Increff (India)
- Unicommerce (India)
- Microlistics (Australia)
Key Industry Developments in the Smart Warehousing Market:
- In August 2023, Infor Announced that Zofri, a major free trade zone in Dubai, will implement Infor WMS to improve customer service within their supply chain. This cloud-based deployment powered by AWS aims for enhanced efficiency and visibility.
- In May 2023, Tecsys Introduced its "warehouse-in-a-warehouse" e-commerce fulfillment solution. This innovative approach allows retailers to seamlessly integrate e-commerce fulfillment within existing wholesale and distribution models, minimizing disruption and maximizing efficiency.
|
Smart Warehousing Market |
|||
|
Base Year: |
2023 |
Forecast Period: |
2024-2032 |
|
Historical Data: |
2017 to 2023 |
Market Size in 2023: |
USD 18.26 Bn. |
|
Forecast Period 2024-32 CAGR: |
10.8% |
Market Size in 2032: |
USD 45.96 Bn. |
|
Segments Covered: |
By Component |
|
|
|
By Technology |
|
||
|
By Application |
|
||
|
By Verticals |
|
||
|
By Region |
|
||
|
Key Market Drivers: |
|
||
|
Key Market Restraints: |
|
||
|
Key Opportunities: |
|
||
|
Companies Covered in the report: |
|
||
Chapter 1: Introduction
1.1 Scope and Coverage
Chapter 2:Executive Summary
Chapter 3: Market Landscape
3.1 Market Dynamics
3.1.1 Drivers
3.1.2 Restraints
3.1.3 Opportunities
3.1.4 Challenges
3.2 Market Trend Analysis
3.3 PESTLE Analysis
3.4 Porter's Five Forces Analysis
3.5 Industry Value Chain Analysis
3.6 Ecosystem
3.7 Regulatory Landscape
3.8 Price Trend Analysis
3.9 Patent Analysis
3.10 Technology Evolution
3.11 Investment Pockets
3.12 Import-Export Analysis
Chapter 4: Smart Warehousing Market by Component (2018-2032)
4.1 Smart Warehousing Market Snapshot and Growth Engine
4.2 Market Overview
4.3 Hardware
4.3.1 Introduction and Market Overview
4.3.2 Historic and Forecasted Market Size in Value USD and Volume Units
4.3.3 Key Market Trends, Growth Factors, and Opportunities
4.3.4 Geographic Segmentation Analysis
4.4 Solutions
4.5 Services
Chapter 5: Smart Warehousing Market by Technology (2018-2032)
5.1 Smart Warehousing Market Snapshot and Growth Engine
5.2 Market Overview
5.3 IoT & Analytics
5.3.1 Introduction and Market Overview
5.3.2 Historic and Forecasted Market Size in Value USD and Volume Units
5.3.3 Key Market Trends, Growth Factors, and Opportunities
5.3.4 Geographic Segmentation Analysis
5.4 RFID
5.5 AI
5.6 AGV
Chapter 6: Smart Warehousing Market by Application (2018-2032)
6.1 Smart Warehousing Market Snapshot and Growth Engine
6.2 Market Overview
6.3 Inventory Management
6.3.1 Introduction and Market Overview
6.3.2 Historic and Forecasted Market Size in Value USD and Volume Units
6.3.3 Key Market Trends, Growth Factors, and Opportunities
6.3.4 Geographic Segmentation Analysis
6.4 Transport Management
6.5 Shipping Management
6.6 Order Management
Chapter 7: Smart Warehousing Market by Verticals (2018-2032)
7.1 Smart Warehousing Market Snapshot and Growth Engine
7.2 Market Overview
7.3 Energy & Utilities
7.3.1 Introduction and Market Overview
7.3.2 Historic and Forecasted Market Size in Value USD and Volume Units
7.3.3 Key Market Trends, Growth Factors, and Opportunities
7.3.4 Geographic Segmentation Analysis
7.4 Transportation & Logistics
7.5 Retail & Ecommerce
7.6 Agriculture
Chapter 8: Company Profiles and Competitive Analysis
8.1 Competitive Landscape
8.1.1 Competitive Benchmarking
8.1.2 Smart Warehousing Market Share by Manufacturer (2024)
8.1.3 Industry BCG Matrix
8.1.4 Heat Map Analysis
8.1.5 Mergers and Acquisitions
8.2 GOLDEN ARTIST COLORS (USA)
8.2.1 Company Overview
8.2.2 Key Executives
8.2.3 Company Snapshot
8.2.4 Role of the Company in the Market
8.2.5 Sustainability and Social Responsibility
8.2.6 Operating Business Segments
8.2.7 Product Portfolio
8.2.8 Business Performance
8.2.9 Key Strategic Moves and Recent Developments
8.2.10 SWOT Analysis
8.3 LIQUITEX(USA)
8.4 WINSOR & NEWTON (USA)
8.5 PRINCETON CATALYST ACRYLICS (USA)
8.6 PRINCETON ARTIST BRUSH CO. (USA)
8.7 BOB ROSS BRAND (USA)
8.8 GOLDEN FLUID ACRYLICS (USA)
8.9 GRUMBACHER (USA)
8.10 BLUE HERON BRUSHES (USA)
8.11 BLICK ART MATERIALS (USA)
8.12 CHEAP JOE'S ART SUPPLIES (USA)
8.13 DICK BLICK (USA)
8.14 JERRY'S ARTARAMA (USA)
8.15 MICHAEL TURNER BRUSHES (UK)
8.16 WINSOR & NEWTON (UK)
8.17 JACKSON'S ART SUPPLIES (UK)
8.18 ROSEMARY & CO. (UK)
8.19 WINTON (UK)
8.20 DALER-ROWNEY (UK)
8.21 RAPHAEL (FRANCE)
8.22 SCHMINCKE (GERMANY)
8.23 DA VINCI (GERMANY)
8.24 MONA LISA ITALY)
8.25 C.D. POZZI (ITALY)
8.26 AMSTERDAM ACRYLICS (NETHERLANDS)
Chapter 9: Global Smart Warehousing Market By Region
9.1 Overview
9.2. North America Smart Warehousing Market
9.2.1 Key Market Trends, Growth Factors and Opportunities
9.2.2 Top Key Companies
9.2.3 Historic and Forecasted Market Size by Segments
9.2.4 Historic and Forecasted Market Size by Component
9.2.4.1 Hardware
9.2.4.2 Solutions
9.2.4.3 Services
9.2.5 Historic and Forecasted Market Size by Technology
9.2.5.1 IoT & Analytics
9.2.5.2 RFID
9.2.5.3 AI
9.2.5.4 AGV
9.2.6 Historic and Forecasted Market Size by Application
9.2.6.1 Inventory Management
9.2.6.2 Transport Management
9.2.6.3 Shipping Management
9.2.6.4 Order Management
9.2.7 Historic and Forecasted Market Size by Verticals
9.2.7.1 Energy & Utilities
9.2.7.2 Transportation & Logistics
9.2.7.3 Retail & Ecommerce
9.2.7.4 Agriculture
9.2.8 Historic and Forecast Market Size by Country
9.2.8.1 US
9.2.8.2 Canada
9.2.8.3 Mexico
9.3. Eastern Europe Smart Warehousing Market
9.3.1 Key Market Trends, Growth Factors and Opportunities
9.3.2 Top Key Companies
9.3.3 Historic and Forecasted Market Size by Segments
9.3.4 Historic and Forecasted Market Size by Component
9.3.4.1 Hardware
9.3.4.2 Solutions
9.3.4.3 Services
9.3.5 Historic and Forecasted Market Size by Technology
9.3.5.1 IoT & Analytics
9.3.5.2 RFID
9.3.5.3 AI
9.3.5.4 AGV
9.3.6 Historic and Forecasted Market Size by Application
9.3.6.1 Inventory Management
9.3.6.2 Transport Management
9.3.6.3 Shipping Management
9.3.6.4 Order Management
9.3.7 Historic and Forecasted Market Size by Verticals
9.3.7.1 Energy & Utilities
9.3.7.2 Transportation & Logistics
9.3.7.3 Retail & Ecommerce
9.3.7.4 Agriculture
9.3.8 Historic and Forecast Market Size by Country
9.3.8.1 Russia
9.3.8.2 Bulgaria
9.3.8.3 The Czech Republic
9.3.8.4 Hungary
9.3.8.5 Poland
9.3.8.6 Romania
9.3.8.7 Rest of Eastern Europe
9.4. Western Europe Smart Warehousing Market
9.4.1 Key Market Trends, Growth Factors and Opportunities
9.4.2 Top Key Companies
9.4.3 Historic and Forecasted Market Size by Segments
9.4.4 Historic and Forecasted Market Size by Component
9.4.4.1 Hardware
9.4.4.2 Solutions
9.4.4.3 Services
9.4.5 Historic and Forecasted Market Size by Technology
9.4.5.1 IoT & Analytics
9.4.5.2 RFID
9.4.5.3 AI
9.4.5.4 AGV
9.4.6 Historic and Forecasted Market Size by Application
9.4.6.1 Inventory Management
9.4.6.2 Transport Management
9.4.6.3 Shipping Management
9.4.6.4 Order Management
9.4.7 Historic and Forecasted Market Size by Verticals
9.4.7.1 Energy & Utilities
9.4.7.2 Transportation & Logistics
9.4.7.3 Retail & Ecommerce
9.4.7.4 Agriculture
9.4.8 Historic and Forecast Market Size by Country
9.4.8.1 Germany
9.4.8.2 UK
9.4.8.3 France
9.4.8.4 The Netherlands
9.4.8.5 Italy
9.4.8.6 Spain
9.4.8.7 Rest of Western Europe
9.5. Asia Pacific Smart Warehousing Market
9.5.1 Key Market Trends, Growth Factors and Opportunities
9.5.2 Top Key Companies
9.5.3 Historic and Forecasted Market Size by Segments
9.5.4 Historic and Forecasted Market Size by Component
9.5.4.1 Hardware
9.5.4.2 Solutions
9.5.4.3 Services
9.5.5 Historic and Forecasted Market Size by Technology
9.5.5.1 IoT & Analytics
9.5.5.2 RFID
9.5.5.3 AI
9.5.5.4 AGV
9.5.6 Historic and Forecasted Market Size by Application
9.5.6.1 Inventory Management
9.5.6.2 Transport Management
9.5.6.3 Shipping Management
9.5.6.4 Order Management
9.5.7 Historic and Forecasted Market Size by Verticals
9.5.7.1 Energy & Utilities
9.5.7.2 Transportation & Logistics
9.5.7.3 Retail & Ecommerce
9.5.7.4 Agriculture
9.5.8 Historic and Forecast Market Size by Country
9.5.8.1 China
9.5.8.2 India
9.5.8.3 Japan
9.5.8.4 South Korea
9.5.8.5 Malaysia
9.5.8.6 Thailand
9.5.8.7 Vietnam
9.5.8.8 The Philippines
9.5.8.9 Australia
9.5.8.10 New Zealand
9.5.8.11 Rest of APAC
9.6. Middle East & Africa Smart Warehousing Market
9.6.1 Key Market Trends, Growth Factors and Opportunities
9.6.2 Top Key Companies
9.6.3 Historic and Forecasted Market Size by Segments
9.6.4 Historic and Forecasted Market Size by Component
9.6.4.1 Hardware
9.6.4.2 Solutions
9.6.4.3 Services
9.6.5 Historic and Forecasted Market Size by Technology
9.6.5.1 IoT & Analytics
9.6.5.2 RFID
9.6.5.3 AI
9.6.5.4 AGV
9.6.6 Historic and Forecasted Market Size by Application
9.6.6.1 Inventory Management
9.6.6.2 Transport Management
9.6.6.3 Shipping Management
9.6.6.4 Order Management
9.6.7 Historic and Forecasted Market Size by Verticals
9.6.7.1 Energy & Utilities
9.6.7.2 Transportation & Logistics
9.6.7.3 Retail & Ecommerce
9.6.7.4 Agriculture
9.6.8 Historic and Forecast Market Size by Country
9.6.8.1 Turkiye
9.6.8.2 Bahrain
9.6.8.3 Kuwait
9.6.8.4 Saudi Arabia
9.6.8.5 Qatar
9.6.8.6 UAE
9.6.8.7 Israel
9.6.8.8 South Africa
9.7. South America Smart Warehousing Market
9.7.1 Key Market Trends, Growth Factors and Opportunities
9.7.2 Top Key Companies
9.7.3 Historic and Forecasted Market Size by Segments
9.7.4 Historic and Forecasted Market Size by Component
9.7.4.1 Hardware
9.7.4.2 Solutions
9.7.4.3 Services
9.7.5 Historic and Forecasted Market Size by Technology
9.7.5.1 IoT & Analytics
9.7.5.2 RFID
9.7.5.3 AI
9.7.5.4 AGV
9.7.6 Historic and Forecasted Market Size by Application
9.7.6.1 Inventory Management
9.7.6.2 Transport Management
9.7.6.3 Shipping Management
9.7.6.4 Order Management
9.7.7 Historic and Forecasted Market Size by Verticals
9.7.7.1 Energy & Utilities
9.7.7.2 Transportation & Logistics
9.7.7.3 Retail & Ecommerce
9.7.7.4 Agriculture
9.7.8 Historic and Forecast Market Size by Country
9.7.8.1 Brazil
9.7.8.2 Argentina
9.7.8.3 Rest of SA
Chapter 10 Analyst Viewpoint and Conclusion
10.1 Recommendations and Concluding Analysis
10.2 Potential Market Strategies
Chapter 11 Research Methodology
11.1 Research Process
11.2 Primary Research
11.3 Secondary Research
|
Smart Warehousing Market |
|||
|
Base Year: |
2023 |
Forecast Period: |
2024-2032 |
|
Historical Data: |
2017 to 2023 |
Market Size in 2023: |
USD 18.26 Bn. |
|
Forecast Period 2024-32 CAGR: |
10.8% |
Market Size in 2032: |
USD 45.96 Bn. |
|
Segments Covered: |
By Component |
|
|
|
By Technology |
|
||
|
By Application |
|
||
|
By Verticals |
|
||
|
By Region |
|
||
|
Key Market Drivers: |
|
||
|
Key Market Restraints: |
|
||
|
Key Opportunities: |
|
||
|
Companies Covered in the report: |
|
||


