


Global Warehouse Robotics Market Overview
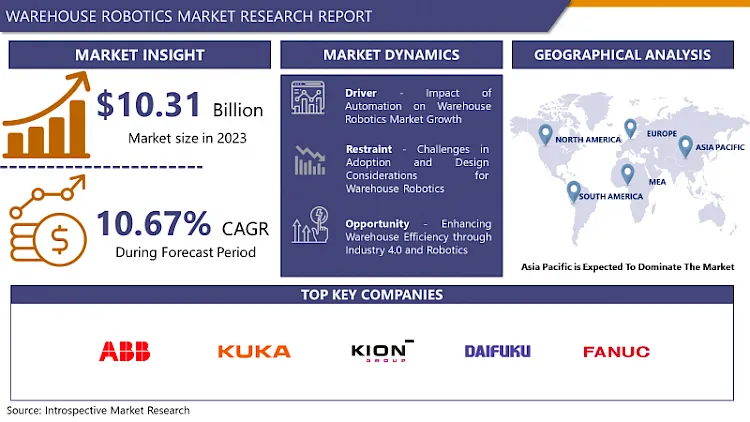
Warehouse Robotics Market size is projected to reach USD 10.31 billion by 2032 from an estimated USD 4.14 billion in 2023, growing at a CAGR of 10.67% globally.
- Warehouse robotics signifies a significant advancement in industrial automation, utilizing cutting-edge computer-based technologies to enhance and improve warehouse activities. These systems are created to efficiently manage a variety of tasks, from retrieving items and packing to transporting materials and palletizing. Sophisticated machinery and software solutions play a key role in their operations, allowing for autonomous decision-making and execution to significantly boost warehouse productivity.
- Various cutting-edge technologies are the foundation of warehouse robotics. Industrial robots, which have robotic arms and grippers, carry out tasks such as selecting and positioning objects with impressive precision. AMRs roam around warehouse floors independently, utilizing built-in sensors and mapping technology to navigate without obstacles and efficiently move merchandise. Automated storage and retrieval systems (AS/RS) make use of vertical storage units and conveyors to quickly retrieve items, decreasing retrieval times and optimizing storage capacity. These technologies function together smoothly, led by computer systems and utilizing magnetic strips and infrared cameras to ensure smooth operation.
- Warehouse robotics have a wide-ranging impact on various industries. In the food and beverage industry, these systems improve inventory control and order processing, guaranteeing that perishable goods are managed accurately and quickly. Robotics in automotive production optimize assembly line processes, enabling efficient just-in-time manufacturing. Pharmaceutical warehouses gain advantages from the careful management of delicate materials, ensuring adherence to strict regulatory criteria. Retail operations experience enhanced inventory precision and quicker order processing to accommodate the requirements of online shopping and multifaceted distribution channels.

Market Dynamics and Forecast for the Warehouse Robotics Market:
Drivers:
The warehouse robotics market is anticipated to be turned by a combined effect of the rising retail and e-commerce industries and energy efficiency-driven technological changes in automation. Major key players are incorporating robotics and automation for the expansion of their warehouses. For example, Amazon, Inc. had over 100,000 robotics systems deployed over about 25 fulfillment centers in the U.S. in 2019. In the next year, the company also deployed 800 Pegasus and Xanthus robotic systems in some implementation centers and developed the robotic drive to about 200,000 robots globally.
The growing number of stock-keeping units is quite common in the warehouse robotics industry, as there is a constant launching of the latest products regularly. The luxury of customization and the rising number of consumer choices by the e-commerce platform has encouraged the demand for an expanded inventory, with a host of options and styles accessible at the disposable of the e-commerce retailers for dispatch on request. As per the Materials Management & Distribution Report, Just-in-time ordering, direct-to-consumer distribution, and switching retailer-wholesaler relationships are declining the number of large-pallet orders received by distributors. In turn, the growth of small, multiple stock-keeping units orders is driving warehouses to automate.
Furthermore, according to the Bank of America, it is expected that by 2025, 45% of all production tasks will be accomplished by robotic technology. With this developing trend, large firms, such as Raymond Limited, which is a major Indian textile company, and Foxconn Technology which is a China-based supplier for large technology manufacturers such as Samsung and others have restored 10,000 and 60,000 employees, respectively, by including automated technology into their production units.
Therefore, these factors have had a direct impact on the growing adoption of warehouse robotics as well. The growing number of warehouses, raising funding in warehouse automation, integrated with the global growth in labor costs and accessibility of scalable technological solutions, have been turning the warehouse robotics market for warehouse robotics over the world. For instance, major logistics brands in the United States, such as XPO Logistics, DHL, and NFI Logistics, are funding in developmental operations, despite the adverse commercial renting climate.
Restraints:
High investment is required to establish and install warehouse robotics. An approximate cost of a mobile robot ranging from USD 25,000 to USD 100,000, whereas the average cost of a fixed robot ranges from USD 40,000 to USD 400,000. The high costs of these robots restrain their adoption, which, as a result, affects the development of the warehouse robotics market during the forecast period. Moreover, the warehouse operators require to alter their warehouse layouts to support the warehouse robotics system to carry out their operations effectively. While designing a new layout, companies require to target major attributes such as the space utilization, safety of workers, and easy availability of items.
Opportunities:
The incorporation of Industry 4.0 with warehouse robotics aims at producing an operational environment in which people and robots can work together. It also enables robots to receive specific instructions and respond to the environment around them. Industry 4.0 allows warehousing facilities to transform to significant changes in their business. Moreover, the incorporation of Industry 4.0 and warehouse robotics systems enables effective communication between warehouse operations. This increased coordination between warehouse systems is supporting warehouse operators to operate time-critical and high-velocity operations at a cheap cost in the highly demanding and continuously developing ecosystem. It is also enabling key players to perform an extensive range of tasks, such as processing customized orders and high-speed delivery of products.
Market Segmentation
Based on the product type, the warehouse robotics market for AMRs is anticipated to dominate and indicate the highest warehouse robotics market share over the forecast period. The rising preference for e-commerce shopping platforms and the increasing requirement for improving the efficiency of warehouses have led companies to target automation of operations. Apart from this rising affordability and return on investment (ROI) are anticipated to turn the growth of the warehouse robotics market. Flexibility and efficiency have become primary differentiators in the e-commerce fulfillment market as retailers and logistic companies are competing to cope up with changing demands, seasonal peaks, and growing delivery expectations. Furthermore, mobile robots form a vital fragment of the global warehousing sectors, as they are used for moving small payloads in the facility, especially in the retail and consumer electronics industry, while offering more flexibility than most of the traditional automation systems. Mobile robotic systems provide high operational flexibility. Additionally, the development in artificial intelligence, deep learning, and robotic mechanics are rising their capabilities.
Based on the function, the picks and place segment recorded for the maximum revenue share of the warehouse robotics market and is anticipated to continue its dominance during the forecast period. The different businesses are installing robotic systems for improving packaging performance by installing sustainable and future-proof solutions. Companies are put back their manual case packing by robotic case packing and using robots at length for loading containers into the Form Fill Seal (FFS) machines. The reason for the development of transportation is owing to development or expansion in mobile robots and rise in utilization in various industries such as food & beverage, pharmaceutical, e-commerce, metal & machinery, and automotive which leads the growth of the warehouse robotics market during the forecast period.
Based on the payload capacity, the below 10 kg payload capacity segment recorded considerable revenue warehouse robotics market share and is expected to affirm its dominance during the forecast period. This is assigned to the fact that the robots with lower payload capacities can carry a majority of the items in a typical facility offering various end-use industries.
Based on the software type, the Warehouse Management System (WMS) software segment is projected to register the maximum warehouse robotics market share and is expected to assert its dominance during the forecast period, due to its ability to manage the overall activity and processes within a facility. These processes incorporate moving the consignment from one place to another within the facility, receiving, cycle counting, order selection, put-away, and shipping. The Warehouse Control System (WCS) and Warehouse Execution System (WES) software segments are expected to witness significant warehouse robotics market growth during the forecast period, as many businesses are investing in these solutions, which supports them in managing consumers as well as the intricacy of the unit.
Based on the application, the e-commerce segment is accelerating the growth of the warehouse robotics market owing to an upsurge in the number of online shopping customers and their rising demands for the speedy delivery of orders in an undamaged and precise form, growing competition in the e-commerce industry. The healthcare segment, on the other hand, is anticipated to witness the fastest warehouse robotics market share during the forecast period, due to the constant improvements in the medicine and pharmaceutical sector. The food and beverage and automotive segments are also expected to observe considerable growth throughout the forecast period owing to growing funding in robotic systems to automate their distribution centers for better productivity and safety.
Players Covered in Warehouse Robotics market are :
- ABB Ltd. (Switzerland)
- KUKA AG (Germany)
- KION GROUP AG (Germany)
- Daifuku (Japan)
- FANUC Corporation (Japan)
- Geekplus Technology (China)
- GreyOrange Pte. Ltd. (US)
- Murata Machinery Ltd. (Japan)
- Omron Corporation (Japan)
- Toyota Industries Corporation (Japan)
- Shopify Inc. (Canada)
- Hikrobot (China)
- IAM Robotics (US)
- inVia Robotics Inc. (US)
- JBT (US)
- Knapp AG (Austria)
- Locus Robotics (US)
- Magazino GmbH (Germany)
- Scallog (France)
- Shanghai Quicktron Intelligent Technology Co. Ltd. (China)
- SSI Schaefer AG (Germany)
- Teradyne Inc. (US)
- Vecna Robotics (US)
- Yaskawa Electric Corporation (Japan)
- and Zebra Technologies Corp. (US)
Regional Analysis for the Warehouse Robotics Market:
The Asia Pacific region is expected to dominate the warehouse robotics market during the forecast period. The growing trend of online retail shopping, the increasing number of start-ups in China that are emerging mobile robots, a high attrition rate of warehouse laborers, and active investment by venture capitalists for the expansion of mobile robots are some of the major factors tuning the growth of the APAC warehouse robotics market. The Growing investments in the deployment of warehouse robotics in various industries are other key factors turning the growth of the market in APAC. Additionally, China remains the maximum industrial robot market with a market share of 36% of total installations. As per the IFR, the operational stock of industrial robots is anticipated to gain 3788 (in thousand units) by 2021 from 2408 (in thousand units) in 2018. For example, Alibaba, the world's largest retailer based out of China, has upgraded to robotic labor in one of its warehouses, which has resulted in drastically declining the labor workforce by 70%, producing an opportunity for a highly skilled workforce.
North America region is expected to register a significant warehouse robotics market share during the forecast period, due to the intensification of the latest technologies at a higher rate coupled with the vital presence of warehouse operatives. Furthermore, the Europe region is expected to be stagnant growth of the warehouse robotics market during the forecast period. This slow growth pace is accredited to the brutal competition, market saturation, and challenging economic situation. Within Europe, Germany is anticipated to observe considerable growth throughout the forecast period.
Key Industry Developments in the Warehouse Robotics Market:
- In July 2023, Maersk, integrator of logistics, announced that it is implementing an AI-enabled robotic solution in one of the warehouses in East Midlands, UK. According to the company, this state-of-the-art Robotic Shuttle Put Wall System by Berkshire Grey, a US-based company, will significantly automate, enhance, and accelerate warehouse operations in the 685,000 sq ft facility.
- In March 2023, LexxPluss, a Japan-based startup that designs and develops autonomous mobile robots for warehouses & logistics sites, announced their plans to enter the US market with a fresh injection of approximately USD 10.7 million in Series A funding. The funding round was led by Drone Fund and SOSV's HAX, Incubate Fund, SBI Investment, and DBJ Capital.
|
Global Warehouse Robotics Market |
|||
|
Base Year: |
2023 |
Forecast Period: |
2024-2032 |
|
Historical Data: |
2017 to 2023 |
Market Size in 2023: |
USD 4.14 Bn. |
|
Forecast Period 2024-32 CAGR: |
10.67 % |
Market Size in 2032: |
USD 10.31 Bn. |
|
Segments Covered: |
By Type |
|
|
|
By Function |
|
||
|
By Payload Capacity |
|
||
|
By Payload Capacity |
|
||
|
By Application |
|
||
|
By Region |
|
||
|
Key Market Drivers: |
|
||
|
Key Market Restraints: |
|
||
|
Key Opportunities: |
|
||
|
Companies Covered in the report: |
|
||
1.1 Scope and Coverage
Chapter 2:Executive Summary
Chapter 3: Market Landscape
3.1 Market Dynamics
3.1.1 Drivers
3.1.2 Restraints
3.1.3 Opportunities
3.1.4 Challenges
3.2 Market Trend Analysis
3.3 PESTLE Analysis
3.4 Porter's Five Forces Analysis
3.5 Industry Value Chain Analysis
3.6 Ecosystem
3.7 Regulatory Landscape
3.8 Price Trend Analysis
3.9 Patent Analysis
3.10 Technology Evolution
3.11 Investment Pockets
3.12 Import-Export Analysis
Chapter 4: Warehouse Robotics Market by Type (2018-2032)
4.1 Warehouse Robotics Market Snapshot and Growth Engine
4.2 Market Overview
4.3 Automatic Storage & Retrieval System {AS/RS}
4.3.1 Introduction and Market Overview
4.3.2 Historic and Forecasted Market Size in Value USD and Volume Units
4.3.3 Key Market Trends, Growth Factors, and Opportunities
4.3.4 Geographic Segmentation Analysis
4.4 Automated Guided Vehicles {AGV}
4.5 Unit Load Transport Autonomous Mobile Robots {AMR}
4.6 Cartesian Robots
4.7 Robotic Arms
4.8 Collaborative Bots {CO-BOTS}
4.9 Mobile Rack Goods-To-Person {GTP} AMR
4.10 Roaming Shuttle AMRS
4.11 Bot Sorter AMRS
4.12 Sortation Systems
4.13 Conveyors
4.14 Palletizers
4.15 And Others
Chapter 5: Warehouse Robotics Market by Function (2018-2032)
5.1 Warehouse Robotics Market Snapshot and Growth Engine
5.2 Market Overview
5.3 Pick & Place
5.3.1 Introduction and Market Overview
5.3.2 Historic and Forecasted Market Size in Value USD and Volume Units
5.3.3 Key Market Trends, Growth Factors, and Opportunities
5.3.4 Geographic Segmentation Analysis
5.4 Palletizing & Depalletizing
5.5 Transportation
5.6 Packaging
Chapter 6: Warehouse Robotics Market by Payload Capacity (2018-2032)
6.1 Warehouse Robotics Market Snapshot and Growth Engine
6.2 Market Overview
6.3 Below 10 Kg
6.3.1 Introduction and Market Overview
6.3.2 Historic and Forecasted Market Size in Value USD and Volume Units
6.3.3 Key Market Trends, Growth Factors, and Opportunities
6.3.4 Geographic Segmentation Analysis
6.4 11 Kg To 80 Kg
6.5 81 Kg To 400 Kg
6.6 401 Kg To 900 Kg
6.7 Above 900 Kg
Chapter 7: Warehouse Robotics Market by Payload Capacity (2018-2032)
7.1 Warehouse Robotics Market Snapshot and Growth Engine
7.2 Market Overview
7.3 Warehouse Management System
7.3.1 Introduction and Market Overview
7.3.2 Historic and Forecasted Market Size in Value USD and Volume Units
7.3.3 Key Market Trends, Growth Factors, and Opportunities
7.3.4 Geographic Segmentation Analysis
7.4 Warehouse Control System
7.5 And Warehouse Execution System
Chapter 8: Warehouse Robotics Market by Application (2018-2032)
8.1 Warehouse Robotics Market Snapshot and Growth Engine
8.2 Market Overview
8.3 E-Commerce
8.3.1 Introduction and Market Overview
8.3.2 Historic and Forecasted Market Size in Value USD and Volume Units
8.3.3 Key Market Trends, Growth Factors, and Opportunities
8.3.4 Geographic Segmentation Analysis
8.4 Automotive
8.5 Electrical & Electronics
8.6 Metal & Machinery
8.7 Chemical
8.8 Rubber And Plastics
8.9 Food & Beverage
8.10 Pharmaceutical
8.11 Other
Chapter 9: Company Profiles and Competitive Analysis
9.1 Competitive Landscape
9.1.1 Competitive Benchmarking
9.1.2 Warehouse Robotics Market Share by Manufacturer (2024)
9.1.3 Industry BCG Matrix
9.1.4 Heat Map Analysis
9.1.5 Mergers and Acquisitions
9.2 SONY (JAPAN)
9.2.1 Company Overview
9.2.2 Key Executives
9.2.3 Company Snapshot
9.2.4 Role of the Company in the Market
9.2.5 Sustainability and Social Responsibility
9.2.6 Operating Business Segments
9.2.7 Product Portfolio
9.2.8 Business Performance
9.2.9 Key Strategic Moves and Recent Developments
9.2.10 SWOT Analysis
9.3 SENSOVISION SYSTEMS (INDIA)
9.4 DARK FIELD TECHNOLOGIES (US)
9.5 COGNEX (US)
9.6 ISRA VISION (GERMANY)
9.7 OMRON (JAPAN)
9.8 TELEDYNE TECHNOLOGIES (US)
9.9 KEYENCE (JAPAN)
9.10 IN-CORE SYSTÈMES (FRANCE)
9.11 MATROX ELECTRONIC SYSTEMS (CANADA)
9.12 BASLER (GERMANY)
9.13 VITRONIC (GERMANY)
9.14 TELEDYNE FLIR (US)
9.15 KITOV (ISAREL)
9.16 BAUMER (SWITZERLAND)
9.17 IMS MESSSYSTEME (GERMANY)
9.18 PANASONIC (JAPAN)
9.19 AMETEK (US)
9.20 INB VISION (GERMANY)
9.21 RADIANT VISION SYSTEMS (US)
9.22 SICK (GERMANY)
9.23 MORITEX (JAPAN)
9.24 KEVISION SYSTEMS (INDIA)
9.25 ALLIED VISION TECHNOLOGIES (GERMANY)
9.26 INDUSTRIAL VISION SYSTEMS (UK)
9.27 INTEGO (GERMANY)
9.28 PIXARGUS (GERMANY)
9.29 SIPOTEK (CHINA)
9.30 NATIONAL INSTRUMENTS (US)
9.31 ADLINK (TAIWAN)
9.32 PERCEPTRON (US)
9.33 STEMMER IMAGING (GERMANY)
9.34 ALPHA TECHSYS (INDIA)
9.35 FLYABILITY (SWITZERLAND)
9.36 4D TECHNOLOGY (US)
9.37 BLUEWRIST (CANADA)
9.38 DATALOGIC (ITALY)
9.39 ELUNIC (GERMANY)
9.40 INTEGRO TECHNOLOGIES (US)
9.41 NANONETS (US)
Chapter 10: Global Warehouse Robotics Market By Region
10.1 Overview
10.2. North America Warehouse Robotics Market
10.2.1 Key Market Trends, Growth Factors and Opportunities
10.2.2 Top Key Companies
10.2.3 Historic and Forecasted Market Size by Segments
10.2.4 Historic and Forecasted Market Size by Type
10.2.4.1 Automatic Storage & Retrieval System {AS/RS}
10.2.4.2 Automated Guided Vehicles {AGV}
10.2.4.3 Unit Load Transport Autonomous Mobile Robots {AMR}
10.2.4.4 Cartesian Robots
10.2.4.5 Robotic Arms
10.2.4.6 Collaborative Bots {CO-BOTS}
10.2.4.7 Mobile Rack Goods-To-Person {GTP} AMR
10.2.4.8 Roaming Shuttle AMRS
10.2.4.9 Bot Sorter AMRS
10.2.4.10 Sortation Systems
10.2.4.11 Conveyors
10.2.4.12 Palletizers
10.2.4.13 And Others
10.2.5 Historic and Forecasted Market Size by Function
10.2.5.1 Pick & Place
10.2.5.2 Palletizing & Depalletizing
10.2.5.3 Transportation
10.2.5.4 Packaging
10.2.6 Historic and Forecasted Market Size by Payload Capacity
10.2.6.1 Below 10 Kg
10.2.6.2 11 Kg To 80 Kg
10.2.6.3 81 Kg To 400 Kg
10.2.6.4 401 Kg To 900 Kg
10.2.6.5 Above 900 Kg
10.2.7 Historic and Forecasted Market Size by Payload Capacity
10.2.7.1 Warehouse Management System
10.2.7.2 Warehouse Control System
10.2.7.3 And Warehouse Execution System
10.2.8 Historic and Forecasted Market Size by Application
10.2.8.1 E-Commerce
10.2.8.2 Automotive
10.2.8.3 Electrical & Electronics
10.2.8.4 Metal & Machinery
10.2.8.5 Chemical
10.2.8.6 Rubber And Plastics
10.2.8.7 Food & Beverage
10.2.8.8 Pharmaceutical
10.2.8.9 Other
10.2.9 Historic and Forecast Market Size by Country
10.2.9.1 US
10.2.9.2 Canada
10.2.9.3 Mexico
10.3. Eastern Europe Warehouse Robotics Market
10.3.1 Key Market Trends, Growth Factors and Opportunities
10.3.2 Top Key Companies
10.3.3 Historic and Forecasted Market Size by Segments
10.3.4 Historic and Forecasted Market Size by Type
10.3.4.1 Automatic Storage & Retrieval System {AS/RS}
10.3.4.2 Automated Guided Vehicles {AGV}
10.3.4.3 Unit Load Transport Autonomous Mobile Robots {AMR}
10.3.4.4 Cartesian Robots
10.3.4.5 Robotic Arms
10.3.4.6 Collaborative Bots {CO-BOTS}
10.3.4.7 Mobile Rack Goods-To-Person {GTP} AMR
10.3.4.8 Roaming Shuttle AMRS
10.3.4.9 Bot Sorter AMRS
10.3.4.10 Sortation Systems
10.3.4.11 Conveyors
10.3.4.12 Palletizers
10.3.4.13 And Others
10.3.5 Historic and Forecasted Market Size by Function
10.3.5.1 Pick & Place
10.3.5.2 Palletizing & Depalletizing
10.3.5.3 Transportation
10.3.5.4 Packaging
10.3.6 Historic and Forecasted Market Size by Payload Capacity
10.3.6.1 Below 10 Kg
10.3.6.2 11 Kg To 80 Kg
10.3.6.3 81 Kg To 400 Kg
10.3.6.4 401 Kg To 900 Kg
10.3.6.5 Above 900 Kg
10.3.7 Historic and Forecasted Market Size by Payload Capacity
10.3.7.1 Warehouse Management System
10.3.7.2 Warehouse Control System
10.3.7.3 And Warehouse Execution System
10.3.8 Historic and Forecasted Market Size by Application
10.3.8.1 E-Commerce
10.3.8.2 Automotive
10.3.8.3 Electrical & Electronics
10.3.8.4 Metal & Machinery
10.3.8.5 Chemical
10.3.8.6 Rubber And Plastics
10.3.8.7 Food & Beverage
10.3.8.8 Pharmaceutical
10.3.8.9 Other
10.3.9 Historic and Forecast Market Size by Country
10.3.9.1 Russia
10.3.9.2 Bulgaria
10.3.9.3 The Czech Republic
10.3.9.4 Hungary
10.3.9.5 Poland
10.3.9.6 Romania
10.3.9.7 Rest of Eastern Europe
10.4. Western Europe Warehouse Robotics Market
10.4.1 Key Market Trends, Growth Factors and Opportunities
10.4.2 Top Key Companies
10.4.3 Historic and Forecasted Market Size by Segments
10.4.4 Historic and Forecasted Market Size by Type
10.4.4.1 Automatic Storage & Retrieval System {AS/RS}
10.4.4.2 Automated Guided Vehicles {AGV}
10.4.4.3 Unit Load Transport Autonomous Mobile Robots {AMR}
10.4.4.4 Cartesian Robots
10.4.4.5 Robotic Arms
10.4.4.6 Collaborative Bots {CO-BOTS}
10.4.4.7 Mobile Rack Goods-To-Person {GTP} AMR
10.4.4.8 Roaming Shuttle AMRS
10.4.4.9 Bot Sorter AMRS
10.4.4.10 Sortation Systems
10.4.4.11 Conveyors
10.4.4.12 Palletizers
10.4.4.13 And Others
10.4.5 Historic and Forecasted Market Size by Function
10.4.5.1 Pick & Place
10.4.5.2 Palletizing & Depalletizing
10.4.5.3 Transportation
10.4.5.4 Packaging
10.4.6 Historic and Forecasted Market Size by Payload Capacity
10.4.6.1 Below 10 Kg
10.4.6.2 11 Kg To 80 Kg
10.4.6.3 81 Kg To 400 Kg
10.4.6.4 401 Kg To 900 Kg
10.4.6.5 Above 900 Kg
10.4.7 Historic and Forecasted Market Size by Payload Capacity
10.4.7.1 Warehouse Management System
10.4.7.2 Warehouse Control System
10.4.7.3 And Warehouse Execution System
10.4.8 Historic and Forecasted Market Size by Application
10.4.8.1 E-Commerce
10.4.8.2 Automotive
10.4.8.3 Electrical & Electronics
10.4.8.4 Metal & Machinery
10.4.8.5 Chemical
10.4.8.6 Rubber And Plastics
10.4.8.7 Food & Beverage
10.4.8.8 Pharmaceutical
10.4.8.9 Other
10.4.9 Historic and Forecast Market Size by Country
10.4.9.1 Germany
10.4.9.2 UK
10.4.9.3 France
10.4.9.4 The Netherlands
10.4.9.5 Italy
10.4.9.6 Spain
10.4.9.7 Rest of Western Europe
10.5. Asia Pacific Warehouse Robotics Market
10.5.1 Key Market Trends, Growth Factors and Opportunities
10.5.2 Top Key Companies
10.5.3 Historic and Forecasted Market Size by Segments
10.5.4 Historic and Forecasted Market Size by Type
10.5.4.1 Automatic Storage & Retrieval System {AS/RS}
10.5.4.2 Automated Guided Vehicles {AGV}
10.5.4.3 Unit Load Transport Autonomous Mobile Robots {AMR}
10.5.4.4 Cartesian Robots
10.5.4.5 Robotic Arms
10.5.4.6 Collaborative Bots {CO-BOTS}
10.5.4.7 Mobile Rack Goods-To-Person {GTP} AMR
10.5.4.8 Roaming Shuttle AMRS
10.5.4.9 Bot Sorter AMRS
10.5.4.10 Sortation Systems
10.5.4.11 Conveyors
10.5.4.12 Palletizers
10.5.4.13 And Others
10.5.5 Historic and Forecasted Market Size by Function
10.5.5.1 Pick & Place
10.5.5.2 Palletizing & Depalletizing
10.5.5.3 Transportation
10.5.5.4 Packaging
10.5.6 Historic and Forecasted Market Size by Payload Capacity
10.5.6.1 Below 10 Kg
10.5.6.2 11 Kg To 80 Kg
10.5.6.3 81 Kg To 400 Kg
10.5.6.4 401 Kg To 900 Kg
10.5.6.5 Above 900 Kg
10.5.7 Historic and Forecasted Market Size by Payload Capacity
10.5.7.1 Warehouse Management System
10.5.7.2 Warehouse Control System
10.5.7.3 And Warehouse Execution System
10.5.8 Historic and Forecasted Market Size by Application
10.5.8.1 E-Commerce
10.5.8.2 Automotive
10.5.8.3 Electrical & Electronics
10.5.8.4 Metal & Machinery
10.5.8.5 Chemical
10.5.8.6 Rubber And Plastics
10.5.8.7 Food & Beverage
10.5.8.8 Pharmaceutical
10.5.8.9 Other
10.5.9 Historic and Forecast Market Size by Country
10.5.9.1 China
10.5.9.2 India
10.5.9.3 Japan
10.5.9.4 South Korea
10.5.9.5 Malaysia
10.5.9.6 Thailand
10.5.9.7 Vietnam
10.5.9.8 The Philippines
10.5.9.9 Australia
10.5.9.10 New Zealand
10.5.9.11 Rest of APAC
10.6. Middle East & Africa Warehouse Robotics Market
10.6.1 Key Market Trends, Growth Factors and Opportunities
10.6.2 Top Key Companies
10.6.3 Historic and Forecasted Market Size by Segments
10.6.4 Historic and Forecasted Market Size by Type
10.6.4.1 Automatic Storage & Retrieval System {AS/RS}
10.6.4.2 Automated Guided Vehicles {AGV}
10.6.4.3 Unit Load Transport Autonomous Mobile Robots {AMR}
10.6.4.4 Cartesian Robots
10.6.4.5 Robotic Arms
10.6.4.6 Collaborative Bots {CO-BOTS}
10.6.4.7 Mobile Rack Goods-To-Person {GTP} AMR
10.6.4.8 Roaming Shuttle AMRS
10.6.4.9 Bot Sorter AMRS
10.6.4.10 Sortation Systems
10.6.4.11 Conveyors
10.6.4.12 Palletizers
10.6.4.13 And Others
10.6.5 Historic and Forecasted Market Size by Function
10.6.5.1 Pick & Place
10.6.5.2 Palletizing & Depalletizing
10.6.5.3 Transportation
10.6.5.4 Packaging
10.6.6 Historic and Forecasted Market Size by Payload Capacity
10.6.6.1 Below 10 Kg
10.6.6.2 11 Kg To 80 Kg
10.6.6.3 81 Kg To 400 Kg
10.6.6.4 401 Kg To 900 Kg
10.6.6.5 Above 900 Kg
10.6.7 Historic and Forecasted Market Size by Payload Capacity
10.6.7.1 Warehouse Management System
10.6.7.2 Warehouse Control System
10.6.7.3 And Warehouse Execution System
10.6.8 Historic and Forecasted Market Size by Application
10.6.8.1 E-Commerce
10.6.8.2 Automotive
10.6.8.3 Electrical & Electronics
10.6.8.4 Metal & Machinery
10.6.8.5 Chemical
10.6.8.6 Rubber And Plastics
10.6.8.7 Food & Beverage
10.6.8.8 Pharmaceutical
10.6.8.9 Other
10.6.9 Historic and Forecast Market Size by Country
10.6.9.1 Turkiye
10.6.9.2 Bahrain
10.6.9.3 Kuwait
10.6.9.4 Saudi Arabia
10.6.9.5 Qatar
10.6.9.6 UAE
10.6.9.7 Israel
10.6.9.8 South Africa
10.7. South America Warehouse Robotics Market
10.7.1 Key Market Trends, Growth Factors and Opportunities
10.7.2 Top Key Companies
10.7.3 Historic and Forecasted Market Size by Segments
10.7.4 Historic and Forecasted Market Size by Type
10.7.4.1 Automatic Storage & Retrieval System {AS/RS}
10.7.4.2 Automated Guided Vehicles {AGV}
10.7.4.3 Unit Load Transport Autonomous Mobile Robots {AMR}
10.7.4.4 Cartesian Robots
10.7.4.5 Robotic Arms
10.7.4.6 Collaborative Bots {CO-BOTS}
10.7.4.7 Mobile Rack Goods-To-Person {GTP} AMR
10.7.4.8 Roaming Shuttle AMRS
10.7.4.9 Bot Sorter AMRS
10.7.4.10 Sortation Systems
10.7.4.11 Conveyors
10.7.4.12 Palletizers
10.7.4.13 And Others
10.7.5 Historic and Forecasted Market Size by Function
10.7.5.1 Pick & Place
10.7.5.2 Palletizing & Depalletizing
10.7.5.3 Transportation
10.7.5.4 Packaging
10.7.6 Historic and Forecasted Market Size by Payload Capacity
10.7.6.1 Below 10 Kg
10.7.6.2 11 Kg To 80 Kg
10.7.6.3 81 Kg To 400 Kg
10.7.6.4 401 Kg To 900 Kg
10.7.6.5 Above 900 Kg
10.7.7 Historic and Forecasted Market Size by Payload Capacity
10.7.7.1 Warehouse Management System
10.7.7.2 Warehouse Control System
10.7.7.3 And Warehouse Execution System
10.7.8 Historic and Forecasted Market Size by Application
10.7.8.1 E-Commerce
10.7.8.2 Automotive
10.7.8.3 Electrical & Electronics
10.7.8.4 Metal & Machinery
10.7.8.5 Chemical
10.7.8.6 Rubber And Plastics
10.7.8.7 Food & Beverage
10.7.8.8 Pharmaceutical
10.7.8.9 Other
10.7.9 Historic and Forecast Market Size by Country
10.7.9.1 Brazil
10.7.9.2 Argentina
10.7.9.3 Rest of SA
Chapter 11 Analyst Viewpoint and Conclusion
11.1 Recommendations and Concluding Analysis
11.2 Potential Market Strategies
Chapter 12 Research Methodology
12.1 Research Process
12.2 Primary Research
12.3 Secondary Research
|
Global Warehouse Robotics Market |
|||
|
Base Year: |
2023 |
Forecast Period: |
2024-2032 |
|
Historical Data: |
2017 to 2023 |
Market Size in 2023: |
USD 4.14 Bn. |
|
Forecast Period 2024-32 CAGR: |
10.67 % |
Market Size in 2032: |
USD 10.31 Bn. |
|
Segments Covered: |
By Type |
|
|
|
By Function |
|
||
|
By Payload Capacity |
|
||
|
By Payload Capacity |
|
||
|
By Application |
|
||
|
By Region |
|
||
|
Key Market Drivers: |
|
||
|
Key Market Restraints: |
|
||
|
Key Opportunities: |
|
||
|
Companies Covered in the report: |
|
||
Frequently Asked Questions :
The forecast period in the Warehouse Robotics Market research report is 2024-2032.
ABB Ltd. (Switzerland), KUKA AG (Germany), KION GROUP AG (Germany), Daifuku (Japan), FANUC Corporation (Japan), Geekplus Technology (China), GreyOrange Pte. Ltd. (US), Murata Machinery Ltd. (Japan), Omron Corporation (Japan), Toyota Industries Corporation (Japan), Shopify, Inc. (Canada), Hikrobot (China), IAM Robotics (US), inVia Robotics, Inc. (US), JBT (US), Knapp AG (Austria), Locus Robotics (US), Magazino GmbH (Germany), Scallog (France), Shanghai Quicktron Intelligent Technology Co. Ltd. (China), SSI Schaefer AG (Germany), Teradyne, Inc. (US), Vecna Robotics (US), Yaskawa Electric Corporation (Japan), and Zebra Technologies Corp. (US), and Other Major Players.
The Warehouse Robotics Market is segmented into Type, Function, Payload Capacity, Application, and region. By Type, the market is categorized into Automatic Storage & Retrieval System {AS/RS}, Automated Guided Vehicles {AGV}, Unit Load Transport Autonomous Mobile Robots {AMR}, Cartesian Robots, Robotic Arms, Collaborative Bots {CO-BOTS}, Mobile Rack Goods-To-Person {GTP} AMR, Roaming Shuttle AMRS, Bot Sorter AMRS, Sortation Systems, Conveyors, Palletizers, And Others. By Function, the market is categorized into Pick & Place, Palletizing & Depalletizing, Transportation, and Packaging. By Payload Capacity, the market is categorized into Below 10 Kg, 11 Kg To 80 Kg, 81 Kg To 400 Kg, 401 Kg To 900 Kg, and Above 900 Kg. By Payload Capacity, the market is categorized into Warehouse Management System, Warehouse Control System, And Warehouse Execution System. By Application, the market is categorized into E-Commerce, Automotive, Electrical & Electronics, Metal & Machinery, Chemical, Rubber and Plastics, Food & Beverage, Pharmaceutical, and Other. By region, it is analyzed across North America (U.S.; Canada; Mexico), Eastern Europe (Bulgaria; The Czech Republic; Hungary; Poland; Romania; Rest of Eastern Europe), Western Europe (Germany; UK; France; Netherlands; Italy; Russia; Spain; Rest of Western Europe), Asia-Pacific (China; India; Japan; Southeast Asia, etc.), South America (Brazil; Argentina, etc.), Middle East & Africa (Saudi Arabia; South Africa, etc.).
Warehouse robotics signifies a significant advancement in industrial automation, utilizing cutting-edge computer-based technologies to enhance and improve warehouse activities. These systems are created to efficiently manage a variety of tasks, from retrieving items and packing to transporting materials and palletizing. Sophisticated machinery and software solutions play a key role in their operations, allowing for autonomous decision-making and execution to significantly boost warehouse productivity.
Warehouse Robotics Market size is projected to reach USD 10.31 billion by 2032 from an estimated USD 4.14 billion in 2023, growing at a CAGR of 10.67% globally.


