


Smart Building Market Synopsis
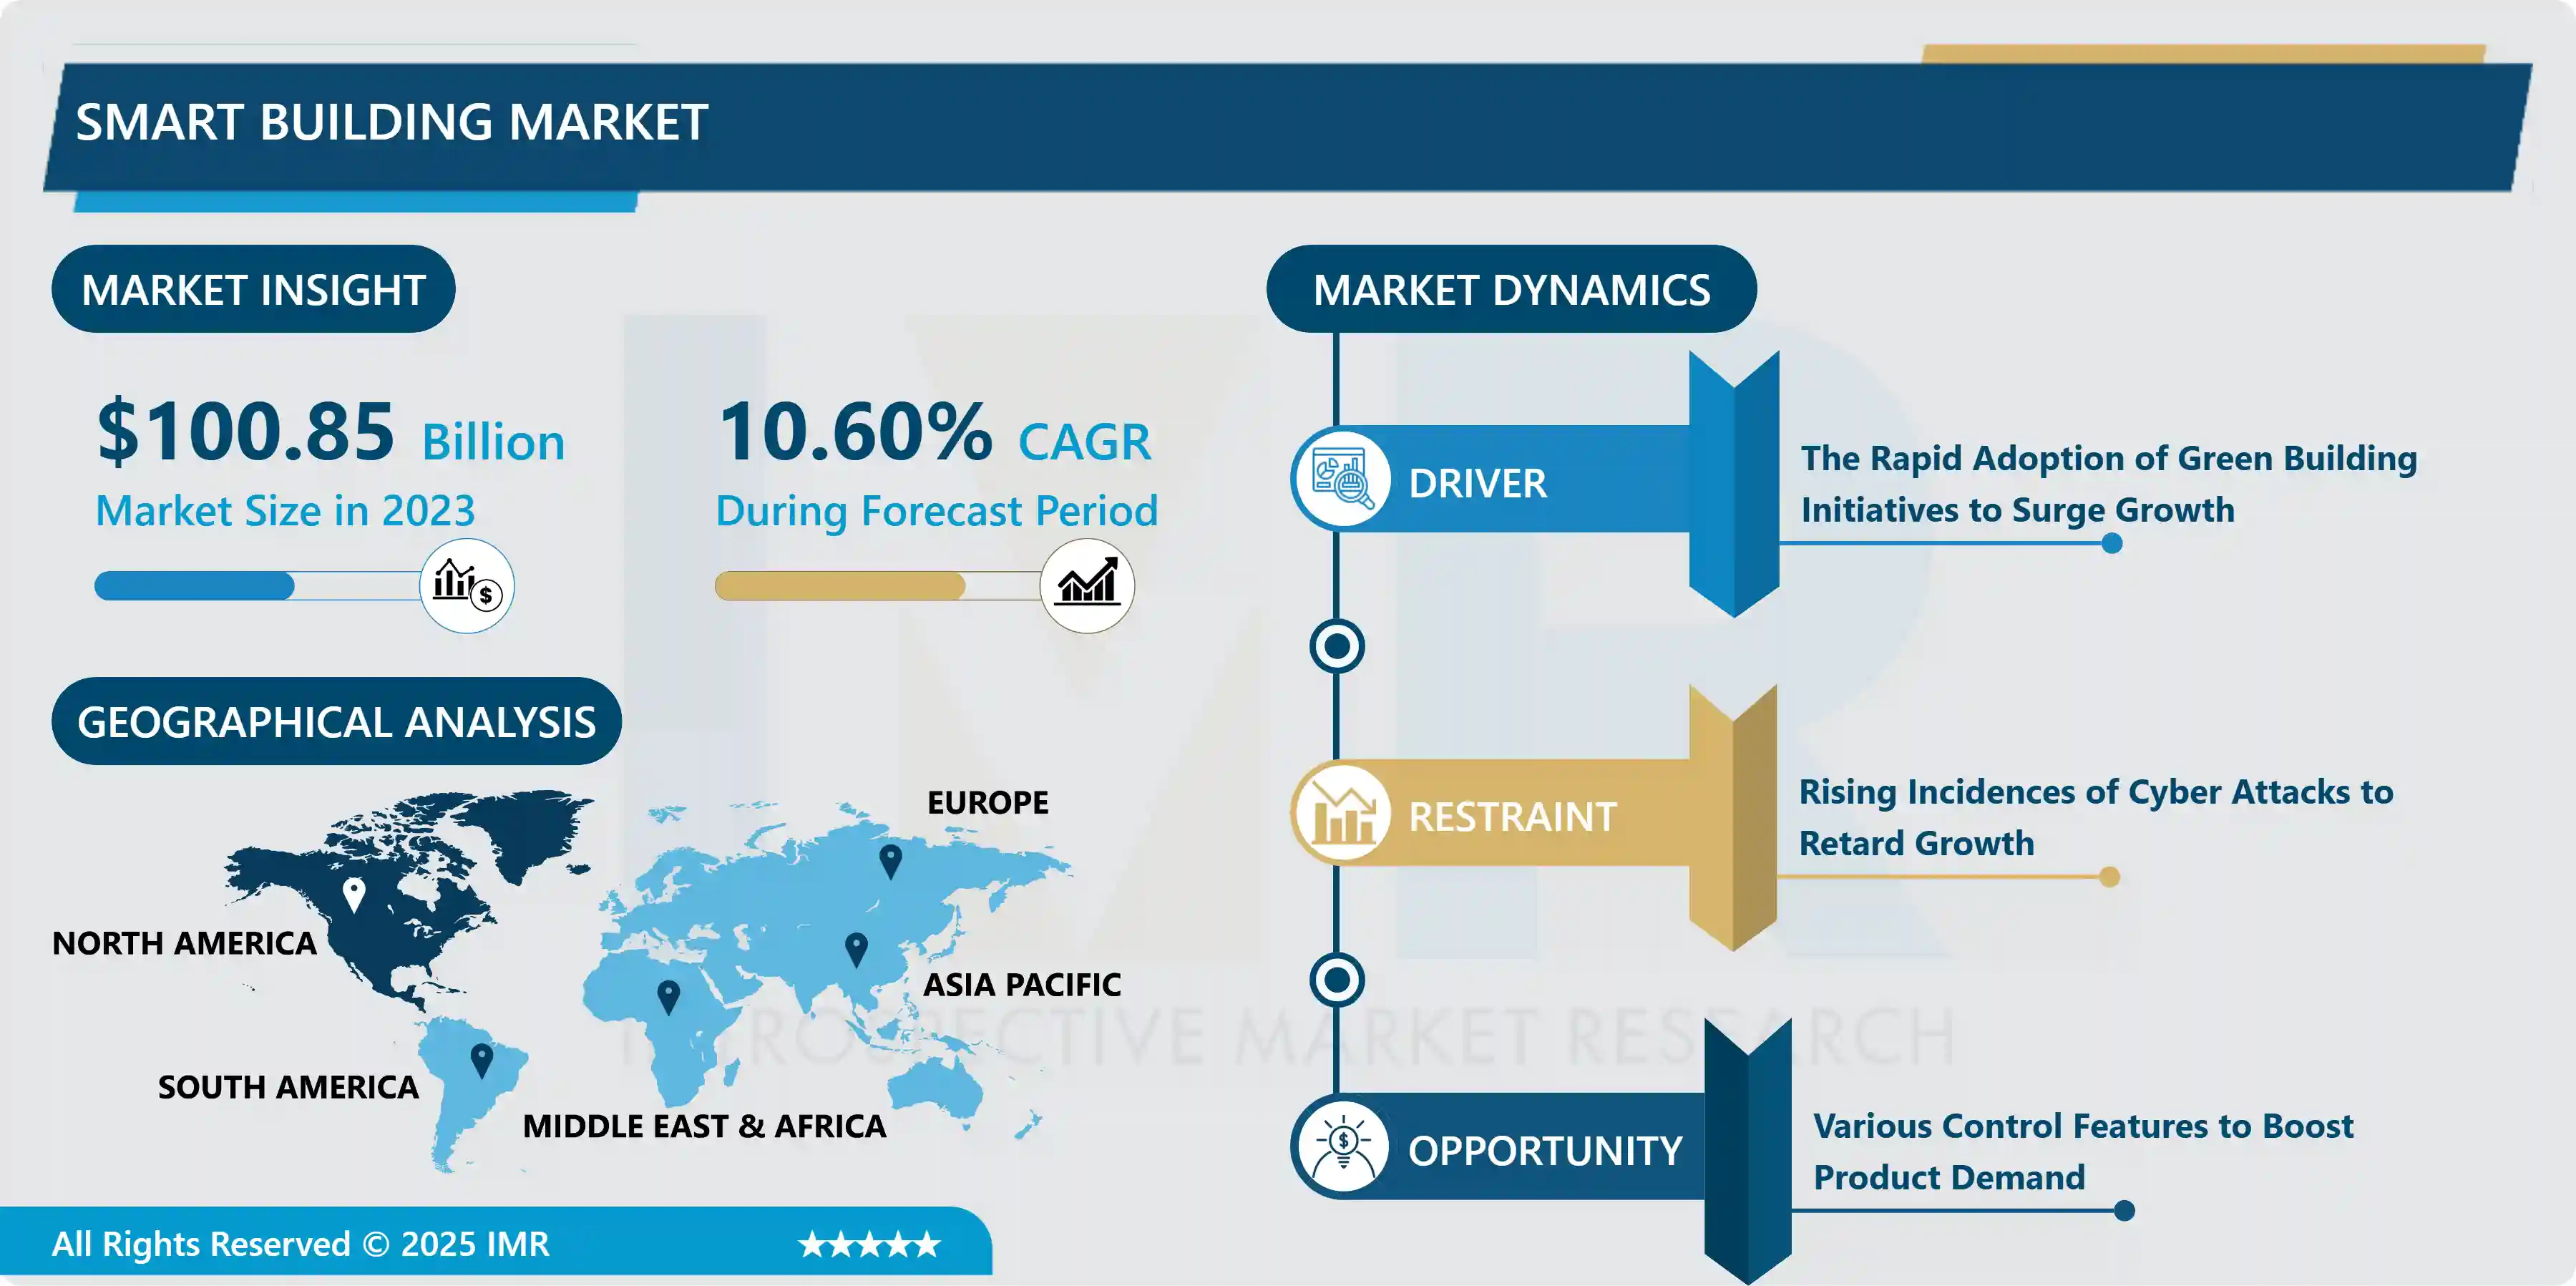
Smart Building Market Size Was Valued at USD 100.85 Billion in 2023 and is Projected to Reach USD 305.48 Billion by 2032, Growing at a CAGR of 10.60% From 2024-2032.
Smart building market is in high growth phase, due to which it’s increasing its usage of technology in the building operation and management to reduce energy consumption and to enable the occupants with better experiences. Smart building means the buildings which connected with IoT devices, AI and sophisticated data analysis to develop intelligent spaces. These technologies allow for the continuous supervision and management of systems like social, lighting, security, and HVAC and energy use in the building. The major forces that will drive market growth include the increased awareness for energy efficiency, the demand for better security networks, and the emergence of smart city programs. Smart infrastructure is an emerging concept that has attracted a lot of investment from governments and private players to meet sustainability agendas and decrease carbon footprints. Furthermore, technological advancement and its utilization in smart home devices are making consumer demand forces the CRE sector to adapt as well.
Here the smart building market has also been classified by the component as solutions and services. Solutions include construction of building infrastructural, security and emergency, and efficient energy systems. The services segment that include smart building technologies installation, maintenance and management services is anticipated to lead this market because of the increasing smart building systems complexity and advanced technologies?.
However, another major growth enabler in the smart building market is the growing deployment of internet of things (IoT) devices and sensors. These devices allow for constant tracking of the status of a building, from temperature and occupancy, to air quality, thus helping prevent loss or damages and inform decision making. Moreover, the latest techniques in data analytics and machine learning algorithms make smart buildings gather and analyze huge data to discover trends, improve efficiency, and determine time-critical maintenance.
Moreover, the proliferation of cloud computing and connectivity solutions has also played a crucial role in driving the smart building market forward. Cloud-based platforms provide the scalability and flexibility required to integrate diverse building systems and devices, enabling seamless communication and interoperability. This allows building operators to remotely monitor and manage their facilities, implement automated controls, and access actionable insights to improve overall efficiency and performance. Overall, as the demand for smart, connected buildings continues to rise, the smart building market is poised for further growth and innovation in the years to come.
Smart Building Market Trend Analysis
Integration of Artificial Intelligence (AI)
- AI algorithms analyze data from sensors embedded within building systems to predict potential equipment failures before they occur. By identifying patterns and anomalies in data, AI-powered predictive maintenance helps facility managers schedule maintenance activities proactively, minimizing downtime and reducing maintenance costs.
- AI enables smart buildings to optimize energy usage by analyzing real-time data on occupancy, weather conditions, and energy consumption patterns. AI algorithms can adjust heating, ventilation, and air conditioning (HVAC) systems, lighting controls, and other building systems dynamically to maximize energy efficiency while maintaining occupant comfort. This results in significant cost savings and reduces the environmental impact of building operations.
- AI-driven smart building systems can personalize the indoor environment based on individual preferences and behavior patterns. By leveraging data from occupancy sensors, temperature sensors, and feedback from occupants, AI algorithms can adjust lighting, temperature, and air quality settings to create comfortable and productive workspaces. This not only enhances occupant satisfaction but also boosts productivity and employee well-being.
Focus on Health and Wellness
- Smart buildings are integrating advanced ventilation systems equipped with high-efficiency particulate air (HEPA) filters and air quality sensors to ensure optimal indoor air quality. These systems continuously monitor and regulate air circulation, filtration, and humidity levels to minimize the presence of airborne pollutants and allergens, promoting a healthier indoor environment for occupants.
- Smart buildings are incorporating wellness technologies such as circadian lighting systems and biophilic design elements to enhance occupant well-being. Circadian lighting mimics the natural rhythm of daylight to regulate sleep-wake cycles and improve mood and productivity. Biophilic design integrates natural elements like greenery and natural light into building interiors, fostering a connection to nature and reducing stress levels among occupants.
- Smart building systems are leveraging data analytics and feedback mechanisms to provide insights into occupant behavior and preferences related to health and wellness. By analyzing data from wearable devices, occupancy sensors, and user feedback surveys, building operators can identify trends, assess the impact of wellness initiatives, and tailor building environments to better meet the needs of occupants. This data-driven approach enables continuous improvement in promoting health and wellness within smart buildings.
Smart Building Market Segment Analysis:
Smart Surfaces Market is Segmented on the basis of Application, Automation Type and Service
By Application, Commercial segment is expected to dominate the market during the forecast period.
- In the commercial sector, smart building technologies are primarily focused on improving energy efficiency, reducing operational costs, and enhancing occupant productivity. Features such as smart lighting, HVAC systems, and integrated building management systems are widely adopted. Additionally, commercial smart buildings often incorporate advanced security systems, including facial recognition and AI-driven surveillance, to ensure safety and streamline access control. The integration of IoT devices enables real-time monitoring and maintenance, reducing downtime and operational disruptions.
- In the residential sector, smart building technologies aim to enhance comfort, convenience, and security for homeowners. Smart home systems include smart thermostats, lighting controls, security cameras, and voice-activated assistants, all of which can be managed via smartphone apps or centralized hubs. Energy management is also a key focus, with solutions like smart meters and solar power integration helping residents monitor and reduce their energy consumption. The rise of home automation systems that integrate various smart devices into a cohesive ecosystem is making smart homes more accessible and user-friendly.
- The industrial sector leverages smart building technologies to optimize operational efficiency, safety, and sustainability in manufacturing and warehousing environments. Smart sensors and IoT devices are used to monitor equipment performance, track inventory, and ensure workplace safety. Automated systems, such as robotics and advanced HVAC controls, help streamline processes and reduce energy usage. Additionally, predictive maintenance powered by AI and machine learning minimizes downtime and extends the lifespan of critical machinery, enhancing overall productivity.
- Across all sectors, there is a growing trend toward integrating renewable energy sources and sustainable practices within smart buildings. Commercial, residential, and industrial smart buildings are increasingly incorporating solar panels, wind turbines, and energy storage solutions to reduce reliance on traditional energy sources. This shift towards sustainability is driven by regulatory pressures, cost savings, and a broader commitment to environmental responsibility. Moreover, the use of big data and analytics across these applications allows for continuous improvement in building performance, occupant satisfaction, and energy management.
By Automation Type, Energy Management segment held the largest share in 2023
- Automation in energy management is crucial for optimizing energy consumption and enhancing sustainability within smart buildings. Systems such as smart meters, automated lighting, and HVAC controls adjust energy use based on real-time data and occupancy patterns. These systems can significantly reduce energy waste and lower operational costs. Additionally, integrating renewable energy sources and energy storage solutions within the energy management framework enables buildings to achieve net-zero energy goals, contributing to environmental sustainability.
- Infrastructure management automation focuses on the efficient operation and maintenance of a building's physical assets. This includes systems for monitoring and managing elevators, water supply, heating and cooling systems, and other essential infrastructure components. Automated infrastructure management systems use sensors and IoT devices to provide real-time data on equipment status and performance, enabling predictive maintenance and reducing the risk of failures. This proactive approach extends the lifespan of building systems and enhances reliability.
- Automation in intelligent security systems enhances the safety and security of smart buildings. These systems incorporate advanced technologies such as AI-driven surveillance cameras, biometric access controls, and intrusion detection systems. Intelligent security systems can analyze video footage in real-time to identify potential threats and trigger automated responses, such as locking doors or alerting security personnel. Additionally, integration with other building systems allows for a coordinated response to security incidents, improving overall safety and reducing the risk of unauthorized access.
Smart Building Market Regional Insights:
North America to Make Notable Contributions Towards Overall Market Size
- North America, particularly the United States, is a hub for technological innovation and the adoption of cutting-edge smart building technologies. The region has a robust ecosystem of technology companies, startups, and research institutions that drive the development and deployment of advanced IoT devices, AI-driven systems, and automation solutions. This technological leadership positions North America at the forefront of the smart building market.
- Government regulations and policies in North America are increasingly focused on energy efficiency, sustainability, and smart infrastructure development. Programs and incentives, such as tax rebates for energy-efficient upgrades and grants for smart city initiatives, encourage the adoption of smart building technologies. These regulatory frameworks support market growth by providing financial and policy-driven incentives for building owners and operators to invest in smart solutions.
- There is a growing emphasis on reducing energy consumption and minimizing environmental impact in North America. Businesses and consumers alike are prioritizing sustainability, driving demand for smart building technologies that can optimize energy use and integrate renewable energy sources. The focus on achieving LEED (Leadership in Energy and Environmental Design) certification and other sustainability benchmarks further propels the adoption of smart building solutions in the region.
- Both the commercial and residential sectors in North America are experiencing significant uptake of smart building technologies. In the commercial sector, companies seek to enhance operational efficiency, improve occupant comfort, and reduce costs through smart building systems. The residential sector sees growing interest in smart home technologies that offer convenience, security, and energy savings. The widespread adoption across these sectors contributes substantially to the overall market growth in North America.
Active Key Players in the Smart Building Market
- Johnson Controls (U.S.)
- Honeywell (U.S.)
- Schneider (France)
- UTC (U.S.)
- Siemens (Germany)
- Ingersoll Rand (Trane)
- Azbil (Japan)
- ABB (Switzerland)
- Emerson (U.S.)
- Eaton (Ireland)
- Control4 Corporation (U.S.)
- Bosch (Germany)
- Panasonic (Japan)
- Delta Controls (Canada)
- Legrand (France)
- Cisco (U.S.)
- IBM (U.S.)
- Advantech (China)
- Current (GE)
- Others Key Players
|
Smart Building Market |
|||
|
Base Year: |
2023 |
Forecast Period: |
2024-2032 |
|
Historical Data: |
2017 to 2023 |
Market Size in 2023: |
USD 100.85 Bn. |
|
CAGR 2024-32: |
10.60% |
Market Size in 2032: |
USD 305.48 Bn. |
|
|
By Automation Type |
|
|
|
By Service |
|
||
|
By Application |
|
||
|
By Region |
|
||
|
Key Market Drivers: |
|
||
|
Key Market Restraints: |
|
||
|
Key Opportunities: |
|
||
|
Companies Covered in the report: |
UTC (U.S.), Siemens(Germany),IngersollRand(Trane),Azbil (Japan),ABB(Switzerland),Emerson(U.S.),Eaton(Ireland),Control4Corporation (U.S.),Bosch(Germany),Panasonic(Japan),Delta Controls(Canada),Legrand(France),Cisco(U.S.),IBM (U.S.),Advantech (China),Current (GE) and Others Key Players
|
||
Chapter 1: Introduction
1.1 Scope and Coverage
Chapter 2:Executive Summary
Chapter 3: Market Landscape
3.1 Market Dynamics
3.1.1 Drivers
3.1.2 Restraints
3.1.3 Opportunities
3.1.4 Challenges
3.2 Market Trend Analysis
3.3 PESTLE Analysis
3.4 Porter's Five Forces Analysis
3.5 Industry Value Chain Analysis
3.6 Ecosystem
3.7 Regulatory Landscape
3.8 Price Trend Analysis
3.9 Patent Analysis
3.10 Technology Evolution
3.11 Investment Pockets
3.12 Import-Export Analysis
Chapter 4: Smart Building Market by Automation Type (2018-2032)
4.1 Smart Building Market Snapshot and Growth Engine
4.2 Market Overview
4.3 Energy Management
4.3.1 Introduction and Market Overview
4.3.2 Historic and Forecasted Market Size in Value USD and Volume Units
4.3.3 Key Market Trends, Growth Factors, and Opportunities
4.3.4 Geographic Segmentation Analysis
4.4 Infrastructure Management
4.5 Network & Communication Management
4.6 Intelligent Security Systems
Chapter 5: Smart Building Market by Service (2018-2032)
5.1 Smart Building Market Snapshot and Growth Engine
5.2 Market Overview
5.3 Professional Services
5.3.1 Introduction and Market Overview
5.3.2 Historic and Forecasted Market Size in Value USD and Volume Units
5.3.3 Key Market Trends, Growth Factors, and Opportunities
5.3.4 Geographic Segmentation Analysis
5.4 Managed Services
Chapter 6: Smart Building Market by Application (2018-2032)
6.1 Smart Building Market Snapshot and Growth Engine
6.2 Market Overview
6.3 Commercial
6.3.1 Introduction and Market Overview
6.3.2 Historic and Forecasted Market Size in Value USD and Volume Units
6.3.3 Key Market Trends, Growth Factors, and Opportunities
6.3.4 Geographic Segmentation Analysis
6.4 Residential
6.5 Industrial
Chapter 7: Company Profiles and Competitive Analysis
7.1 Competitive Landscape
7.1.1 Competitive Benchmarking
7.1.2 Smart Building Market Share by Manufacturer (2024)
7.1.3 Industry BCG Matrix
7.1.4 Heat Map Analysis
7.1.5 Mergers and Acquisitions
7.2 AURIONPRO
7.2.1 Company Overview
7.2.2 Key Executives
7.2.3 Company Snapshot
7.2.4 Role of the Company in the Market
7.2.5 Sustainability and Social Responsibility
7.2.6 Operating Business Segments
7.2.7 Product Portfolio
7.2.8 Business Performance
7.2.9 Key Strategic Moves and Recent Developments
7.2.10 SWOT Analysis
7.3 HUAWEI TECHNOLOGIES CO. LTD
7.4 ARMAN DESIGN
7.5 KIOSK INFORMATION SYSTEMS
7.6 PHOENIX KIOSK INC
7.7 REDYREF
7.8 KONTRON AG
7.9 INSPUR
7.10 SLABB INC.
7.11 KIOSK INFORMATION SYSTEMS
Chapter 8: Global Smart Building Market By Region
8.1 Overview
8.2. North America Smart Building Market
8.2.1 Key Market Trends, Growth Factors and Opportunities
8.2.2 Top Key Companies
8.2.3 Historic and Forecasted Market Size by Segments
8.2.4 Historic and Forecasted Market Size by Automation Type
8.2.4.1 Energy Management
8.2.4.2 Infrastructure Management
8.2.4.3 Network & Communication Management
8.2.4.4 Intelligent Security Systems
8.2.5 Historic and Forecasted Market Size by Service
8.2.5.1 Professional Services
8.2.5.2 Managed Services
8.2.6 Historic and Forecasted Market Size by Application
8.2.6.1 Commercial
8.2.6.2 Residential
8.2.6.3 Industrial
8.2.7 Historic and Forecast Market Size by Country
8.2.7.1 US
8.2.7.2 Canada
8.2.7.3 Mexico
8.3. Eastern Europe Smart Building Market
8.3.1 Key Market Trends, Growth Factors and Opportunities
8.3.2 Top Key Companies
8.3.3 Historic and Forecasted Market Size by Segments
8.3.4 Historic and Forecasted Market Size by Automation Type
8.3.4.1 Energy Management
8.3.4.2 Infrastructure Management
8.3.4.3 Network & Communication Management
8.3.4.4 Intelligent Security Systems
8.3.5 Historic and Forecasted Market Size by Service
8.3.5.1 Professional Services
8.3.5.2 Managed Services
8.3.6 Historic and Forecasted Market Size by Application
8.3.6.1 Commercial
8.3.6.2 Residential
8.3.6.3 Industrial
8.3.7 Historic and Forecast Market Size by Country
8.3.7.1 Russia
8.3.7.2 Bulgaria
8.3.7.3 The Czech Republic
8.3.7.4 Hungary
8.3.7.5 Poland
8.3.7.6 Romania
8.3.7.7 Rest of Eastern Europe
8.4. Western Europe Smart Building Market
8.4.1 Key Market Trends, Growth Factors and Opportunities
8.4.2 Top Key Companies
8.4.3 Historic and Forecasted Market Size by Segments
8.4.4 Historic and Forecasted Market Size by Automation Type
8.4.4.1 Energy Management
8.4.4.2 Infrastructure Management
8.4.4.3 Network & Communication Management
8.4.4.4 Intelligent Security Systems
8.4.5 Historic and Forecasted Market Size by Service
8.4.5.1 Professional Services
8.4.5.2 Managed Services
8.4.6 Historic and Forecasted Market Size by Application
8.4.6.1 Commercial
8.4.6.2 Residential
8.4.6.3 Industrial
8.4.7 Historic and Forecast Market Size by Country
8.4.7.1 Germany
8.4.7.2 UK
8.4.7.3 France
8.4.7.4 The Netherlands
8.4.7.5 Italy
8.4.7.6 Spain
8.4.7.7 Rest of Western Europe
8.5. Asia Pacific Smart Building Market
8.5.1 Key Market Trends, Growth Factors and Opportunities
8.5.2 Top Key Companies
8.5.3 Historic and Forecasted Market Size by Segments
8.5.4 Historic and Forecasted Market Size by Automation Type
8.5.4.1 Energy Management
8.5.4.2 Infrastructure Management
8.5.4.3 Network & Communication Management
8.5.4.4 Intelligent Security Systems
8.5.5 Historic and Forecasted Market Size by Service
8.5.5.1 Professional Services
8.5.5.2 Managed Services
8.5.6 Historic and Forecasted Market Size by Application
8.5.6.1 Commercial
8.5.6.2 Residential
8.5.6.3 Industrial
8.5.7 Historic and Forecast Market Size by Country
8.5.7.1 China
8.5.7.2 India
8.5.7.3 Japan
8.5.7.4 South Korea
8.5.7.5 Malaysia
8.5.7.6 Thailand
8.5.7.7 Vietnam
8.5.7.8 The Philippines
8.5.7.9 Australia
8.5.7.10 New Zealand
8.5.7.11 Rest of APAC
8.6. Middle East & Africa Smart Building Market
8.6.1 Key Market Trends, Growth Factors and Opportunities
8.6.2 Top Key Companies
8.6.3 Historic and Forecasted Market Size by Segments
8.6.4 Historic and Forecasted Market Size by Automation Type
8.6.4.1 Energy Management
8.6.4.2 Infrastructure Management
8.6.4.3 Network & Communication Management
8.6.4.4 Intelligent Security Systems
8.6.5 Historic and Forecasted Market Size by Service
8.6.5.1 Professional Services
8.6.5.2 Managed Services
8.6.6 Historic and Forecasted Market Size by Application
8.6.6.1 Commercial
8.6.6.2 Residential
8.6.6.3 Industrial
8.6.7 Historic and Forecast Market Size by Country
8.6.7.1 Turkiye
8.6.7.2 Bahrain
8.6.7.3 Kuwait
8.6.7.4 Saudi Arabia
8.6.7.5 Qatar
8.6.7.6 UAE
8.6.7.7 Israel
8.6.7.8 South Africa
8.7. South America Smart Building Market
8.7.1 Key Market Trends, Growth Factors and Opportunities
8.7.2 Top Key Companies
8.7.3 Historic and Forecasted Market Size by Segments
8.7.4 Historic and Forecasted Market Size by Automation Type
8.7.4.1 Energy Management
8.7.4.2 Infrastructure Management
8.7.4.3 Network & Communication Management
8.7.4.4 Intelligent Security Systems
8.7.5 Historic and Forecasted Market Size by Service
8.7.5.1 Professional Services
8.7.5.2 Managed Services
8.7.6 Historic and Forecasted Market Size by Application
8.7.6.1 Commercial
8.7.6.2 Residential
8.7.6.3 Industrial
8.7.7 Historic and Forecast Market Size by Country
8.7.7.1 Brazil
8.7.7.2 Argentina
8.7.7.3 Rest of SA
Chapter 9 Analyst Viewpoint and Conclusion
9.1 Recommendations and Concluding Analysis
9.2 Potential Market Strategies
Chapter 10 Research Methodology
10.1 Research Process
10.2 Primary Research
10.3 Secondary Research
|
Smart Building Market |
|||
|
Base Year: |
2023 |
Forecast Period: |
2024-2032 |
|
Historical Data: |
2017 to 2023 |
Market Size in 2023: |
USD 100.85 Bn. |
|
CAGR 2024-32: |
10.60% |
Market Size in 2032: |
USD 305.48 Bn. |
|
|
By Automation Type |
|
|
|
By Service |
|
||
|
By Application |
|
||
|
By Region |
|
||
|
Key Market Drivers: |
|
||
|
Key Market Restraints: |
|
||
|
Key Opportunities: |
|
||
|
Companies Covered in the report: |
UTC (U.S.), Siemens(Germany),IngersollRand(Trane),Azbil (Japan),ABB(Switzerland),Emerson(U.S.),Eaton(Ireland),Control4Corporation (U.S.),Bosch(Germany),Panasonic(Japan),Delta Controls(Canada),Legrand(France),Cisco(U.S.),IBM (U.S.),Advantech (China),Current (GE) and Others Key Players
|
||


