


Radiation Dose Management Service Market Synopsis
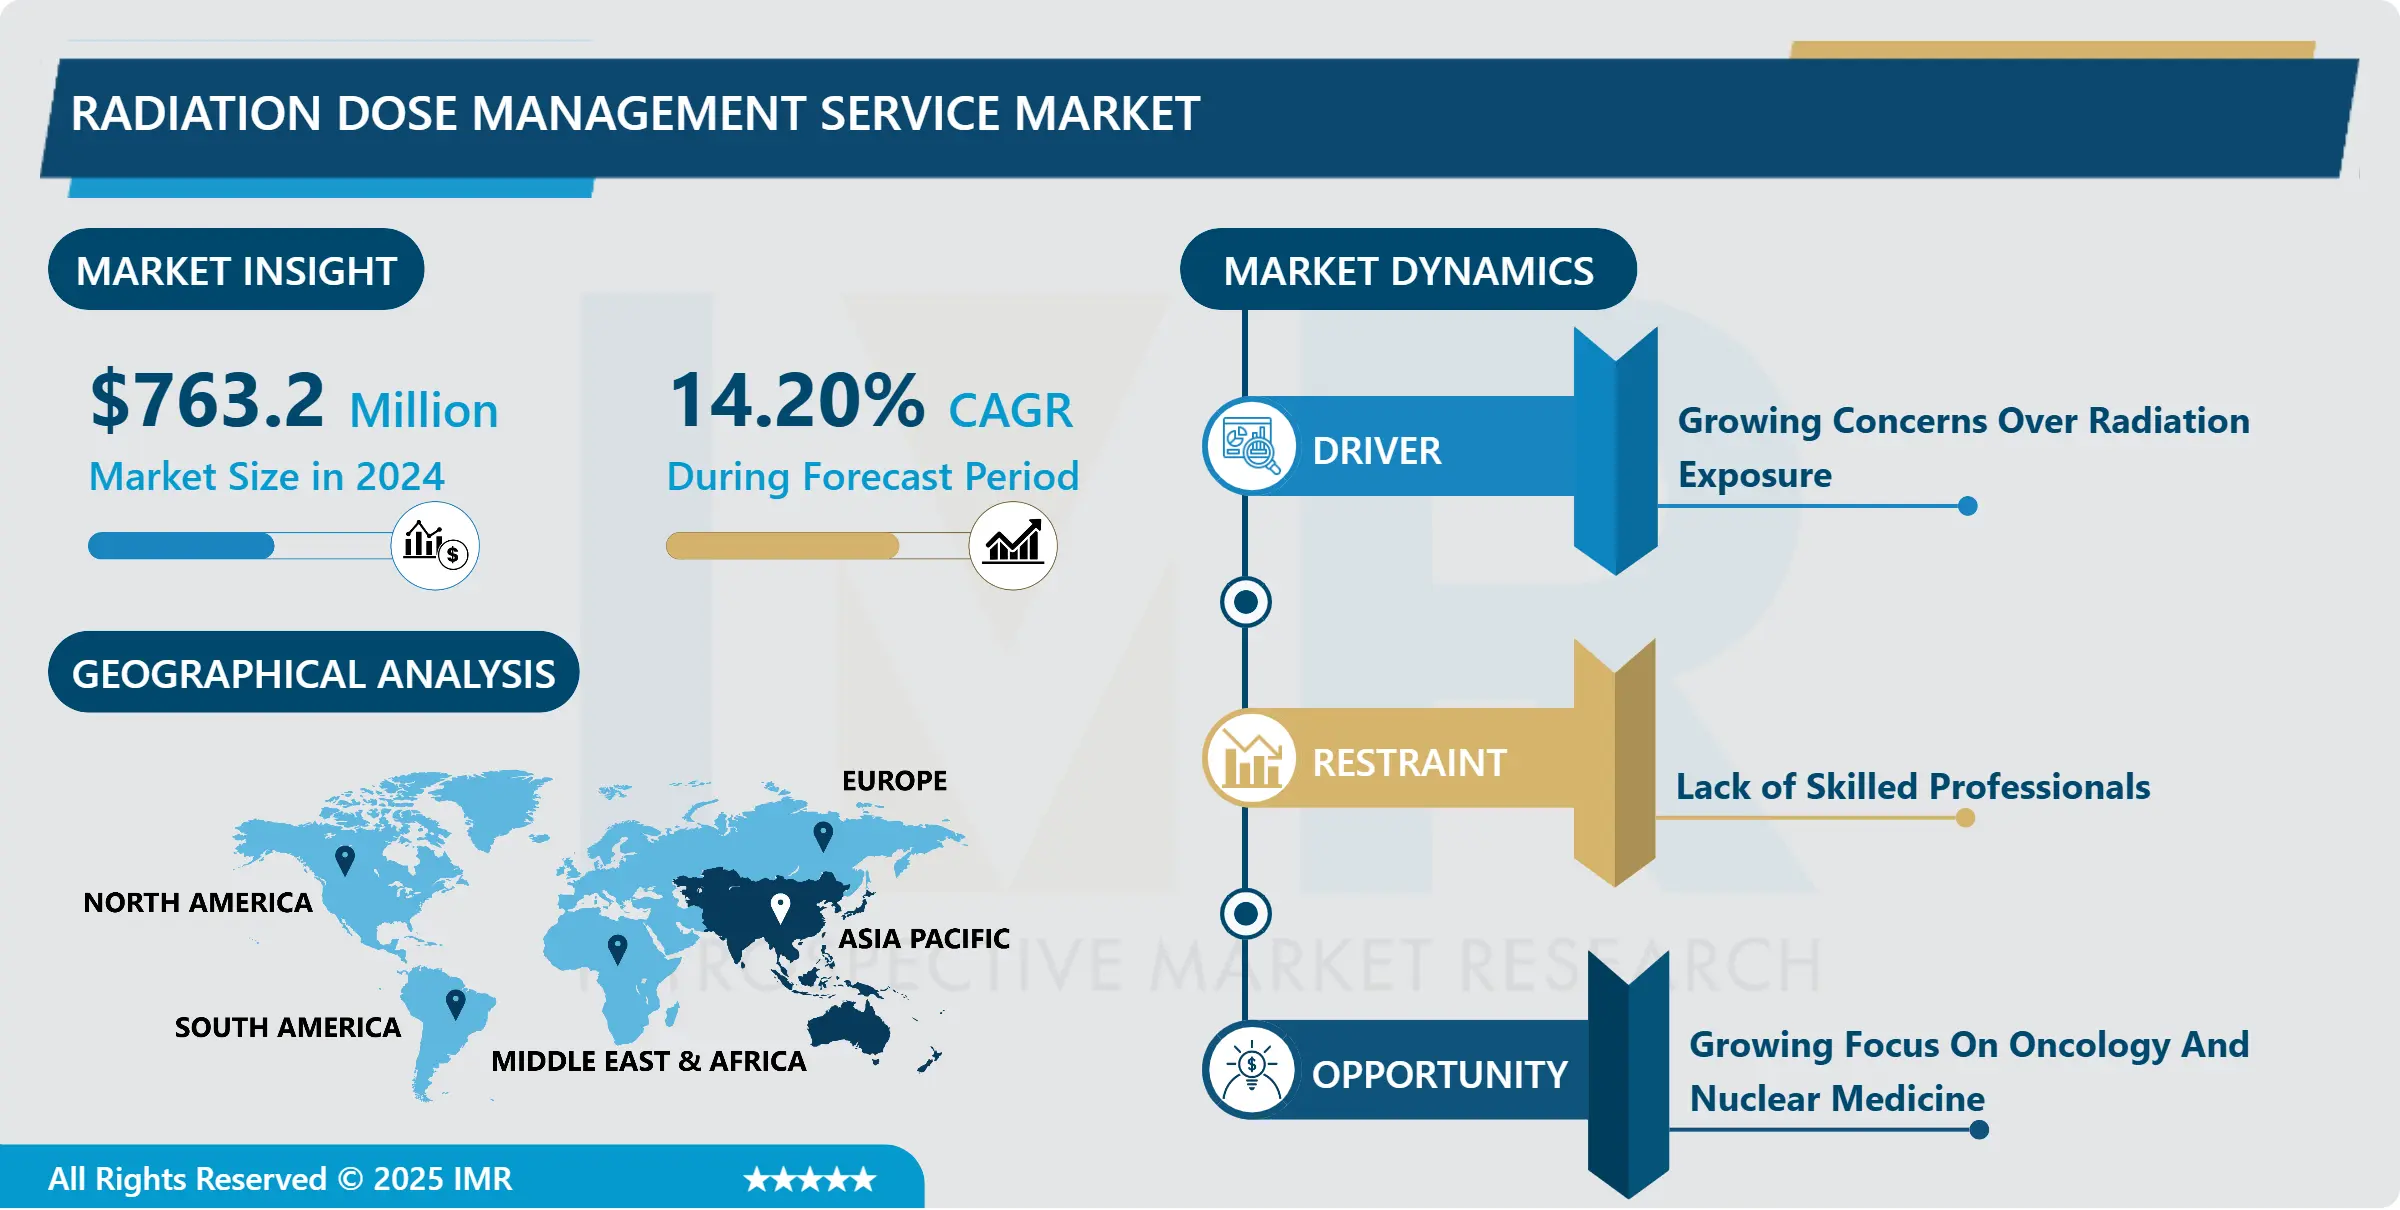
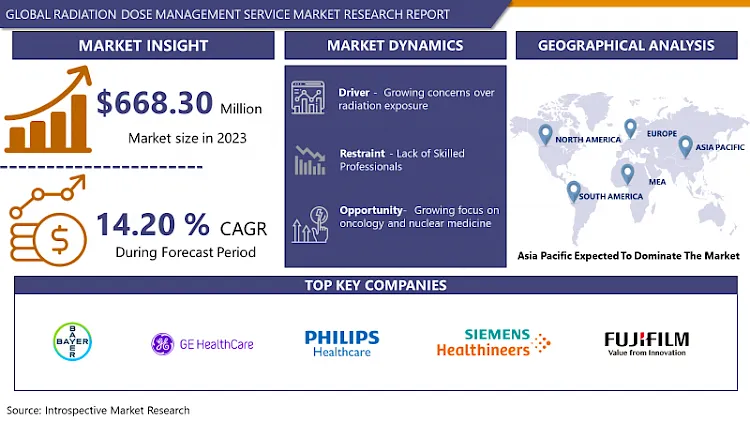
Radiation Dose Management Service Market Size Was Valued at USD 763.2 Million in 2024, and is Projected to Reach USD 2207.84 Million by 2032, Growing at a CAGR of 14.20% From 2025-2032.
The Radiation Dose Management Service Market refers to the sector that provides tools, technologies, and services aimed at monitoring, recording, and managing the exposure to ionizing radiation within healthcare settings. This market encompasses software solutions for dose tracking, regulatory compliance, and optimization of radiation used in medical imaging and therapy, as well as consulting and training services to ensure the safe and effective use of radiological procedures. The primary goal of these services is to enhance patient safety, improve clinical outcomes, and ensure adherence to stringent regulatory standards by minimizing unnecessary radiation exposure and optimizing necessary doses.
The Radiation Dose Management Service Market is a rapidly expanding market because there is more adoption and emphasis given to the fact that there can be serious complications by being exposed to radiation in hospitals and other related medical facilities. This market is of strategic importance for Radiant due to the growing demand for enhancing patient safety and meeting regulatory demands in diagnostic imaging practices. Radiation dose management solutions are having steady growth in utilization in the sector to help assess and address patients’ radiation doses in diagnosis and therapeutic procedures. These apply assistance in averting radiation-related diseases hence offering better patients’ care without boosting radiation impact.
Technological developments are among the significant determinants that contribute to the growth of the radiation dose management service market. The combination of utilizing enhanced software applications as well as medical imaging devices allows for the monitoring and analysis of cumulative radiation doses in real-time. It can also help control radiation exposure by providing better information to help in selecting and optimizing procedures that produce the best diagnostic results. Furthermore, the adoption of eHealth in the format of electronic health records empowers dose management systems to be integrated into the current systems thus improving accurate and proper data sharing among the medical professionals.
Administrations in various parts of the world are upping the standards that medical practitioners are required to follow to utilize radiation appropriately. These regulations remain key contributors to the uptake of radiation dose management services due to compliance factors. The market is also achieving steady growth in spending on healthcare infrastructure and steady experience of entities related to chronic diseases that demand the implementation of regular imaging examinations. In addition, managing patient expectations regarding radiation risks is also demanding attention as patients are more informed and sensitive towards radiation exposure, thus exerting pressure on healthcare providers to implement dose management systems to sustain market competitiveness and consumer confidence.
They can be described as possessing several principal members who are involved in the global market of medical devices and hardware along with some dedicated software developers. These companies are keenly indulged in different strategies to increase their product portfolio and increase their market share some of them are merger-allied or acquisition-allied strategies. Ongoing advances in research and development ensure that newer, enhanced systems that can better facilitate effective dose management and easier use are developed, thus contributing to sustainable market growth. In summary, this LM seeks to conclude that the radiation dose management service market will grow strongly bolstered by technological advancement, certifications, and rising health consciousness among the global populace.
Radiation Dose Management Service Market Trend Analysis
Rising Usage of Diagnostic Imaging and the Necessity of Effective Radiation Dose Management
- The increase in the number of diagnostic imaging procedures as per capita health expenditure including Computerized Tomography (CT) scans, X-rays, Nuclear Medicine, etc. is adding a lot of value to the global radiation dose management market. These imaging techniques are considered one of the most important tools of modern diagnostics and therapy, providing invaluable information about the human body and its functions necessary for correct diagnostics of the diseases and development of efficient treatment strategies. However, very few of them are applied with ionizing radiation that in the case of insufficient precautions can harm the health of the patient. The use of these techniques has therefore risen, and this has in turn led to the need to determine doses that are safe for patient radiation exposure. The process of radiation management assists in providing the exact amount of Radiation that is required to aid the diagnostic process while avoiding the negative consequences that are associated with radiation exposure.
- Also, there is an increasing trend of using these imaging modalities and this led to concerns from regulatory authorities hence policies on radiation protection standards were developed. Many countries like the United States which has the Food and Drug Administration (FDA) European Commission and many others have set standards and Slegislation that dictate how much radiation people are exposed to. The entropy of these regulations makes it necessary for healthcare facilities to employ new technology in the management of radiation doses. These systems are not only invaluable in the area of patient safety by minimizing patients’ risk of exposure but also assist healthcare facilities in evading fines and improving their general quality of service. Inevitably, radiation dose management solutions have emerged as essential tools in the clinical pathways reflected in the functional models of hospitals and diagnostic centers as a means to promote patient protection and ensure compliance with regulatory requirements.
Patient Safety and Regulatory Compliance
- Radiation safety has become an increasingly significant concern within medical imaging, and to combat the risks, appropriate measures have been put in place to regulate these hazards. It is therefore cumbersome to name a single regulation but an example of the existing legislation includes the European Directive 2013/59/Euratom which regulates radiation exposure to protect patients in the member countries of the European Union. This directive has led to the adoption of radiation dose management solutions from across Europe to ensure that patients’ exposure meets or is even lower than these set standards. These solutions will allow healthcare facilities to manage and control radiation doses to patients to achieve the minimum necessary dose for diagnosis. This regulatory framework has not just only benefitted the patient by increasing his or her safety, but also has improved the overall culture of learning and being answerable and responsible in institutions of healthcare.
- In a similar manner, positive and sound regulatory scenarios along with increasing awareness of potential hazards of radiation exposure influence the market of radiation dose management in the United States. The approvals themselves, particularly by the U. S. Food and Drug Administration (FDA), elaborate strategies that denote careful dose prescription and patient protection. These regulations call for the use of dose control systems to meet federal and state recommendations. Growing tendencies of the population to endeavor health risks associated with high levels of ionizing radiation exposure, including the emergence of cancer, has also contributed to the increased public expectations regarding patients’ radiation doses as well as greater attention to the question of dose optimization in medical practice. As a result, healthcare providers, particularly hospitals and diagnostic centers, are applying stringent standards about dose management technology solutions in a bid to meet the laid down standards and regulations, ensure ultimate patient safety, and generally upgrade healthcare standards.
Radiation Dose Management Service Market Segment Analysis:
The radiation Dose Management Service Market is Segmented based on Product & Services, Modality, Mode of Deployment, Revenue Model, Application, End-User, and Region.
By Modality, Computed Tomography segment is expected to dominate the market during the forecast period
- Computed Tomography (CT) stands as the cornerstone of modern medical imaging, holding a dominant position among imaging modalities due to its versatility and diagnostic efficacy. CT scans are extensively utilized across a spectrum of medical disciplines, ranging from routine diagnostic evaluations to complex surgical planning. The ability of CT imaging to provide detailed cross-sectional images of internal structures with exceptional clarity makes it indispensable in diagnosing a myriad of conditions, including traumatic injuries, cancers, and vascular diseases. As a result, healthcare providers rely heavily on CT scans for accurate disease detection, treatment monitoring, and intervention guidance, cementing its status as the dominant imaging modality in contemporary medical practice.
- The widespread adoption of CT imaging brings forth the imperative need for effective dose management strategies to mitigate the potential risks associated with ionizing radiation exposure. Given the relatively higher radiation doses delivered during CT scans compared to other imaging modalities, ensuring patient safety while maintaining diagnostic efficacy is paramount. Consequently, dose optimization techniques, radiation dose monitoring systems, and adherence to established protocols for the justification and optimization of CT scans have become integral components of clinical practice. The prominence of CT scans across diverse medical specialties underscores the critical importance of robust dose management practices in safeguarding patient health and optimizing healthcare delivery.
By Revenue Model, the Capital/Annual Purchase Model segment held the largest share in 2024
- The capital/annual purchase model stands as the prevailing revenue model in the realm of radiation dose management solutions, primarily due to its inherent advantages and widespread appeal to healthcare institutions. This model offers a straightforward approach, allowing facilities to make a one-time capital investment or opt for annual payments to acquire dose management solutions outright. Such a structure provides institutions with a sense of financial predictability, enabling them to allocate resources efficiently and plan budgets over an extended period. By securing ownership of the dose management system, healthcare providers gain autonomy and control over its implementation and customization, tailoring it to suit their specific needs and workflows. This ownership aspect fosters a sense of accountability and a long-term commitment to the effective utilization of dose management technologies.
- Furthermore, the capital/annual purchase model offers tangible ownership benefits, affording healthcare institutions the flexibility to customize and scale dose management solutions according to evolving requirements and technological advancements. Unlike subscription-based models that entail ongoing payments without ownership rights, the capital/annual purchase model allows facilities to amortize costs over time, potentially resulting in cost savings in the long run. Additionally, owning the dose management system facilitates seamless integration with existing infrastructure and enables in-house maintenance and upgrades, thereby reducing reliance on external vendors and enhancing operational efficiency. Overall, the attractiveness of the capital/annual purchase model lies in its ability to provide financial stability, ownership advantages, and flexibility for healthcare institutions seeking to invest in robust and sustainable dose management solutions.
Radiation Dose Management Service Market Regional Insights:
Asia Pacific is Expected to Dominate the Market Over the Forecast Period
- In the Asia Pacific region, the radiation dose management service market holds a dominant share, largely propelled by several key factors driving its growth trajectory. One significant driver is the substantial investments in healthcare infrastructure witnessed across countries like China, Japan, and India. These investments are aimed at addressing the burgeoning healthcare needs of rapidly growing populations, particularly in urban areas where demand for medical services, including diagnostic imaging procedures, is surging. As these nations continue to modernize their healthcare systems, there's a parallel increase in the adoption of advanced medical imaging technologies, creating a conducive environment for the uptake of radiation dose management solutions.
- Moreover, the rising incidence of chronic diseases in the Asia Pacific region further amplifies the demand for medical imaging services, thereby contributing to the expansion of the radiation dose management market. Chronic conditions such as cardiovascular diseases, cancer, and respiratory illnesses necessitate frequent diagnostic imaging procedures, driving the need for efficient radiation dose monitoring and management solutions. Countries like India and China, with their large patient populations, are particularly significant contributors to this trend.
- Government initiatives aimed at promoting radiation safety also play a pivotal role in propelling market growth in the Asia Pacific region. Regulatory bodies in countries like Japan and South Korea have implemented stringent guidelines and standards to ensure the safe use of radiation in medical imaging practices. These initiatives not only foster a culture of radiation safety but also drive the adoption of radiation dose management solutions by healthcare providers seeking to comply with regulatory requirements.
- Despite these favorable conditions, challenges such as limited awareness about radiation safety practices and the high cost of advanced radiation dose management solutions pose potential impediments to market expansion. Efforts to address these challenges through educational campaigns, collaborations between healthcare stakeholders, and technological advancements aimed at cost reduction are crucial for sustaining the momentum of growth in the Asia Pacific radiation dose management service market.
Active Key Players in the Radiation Dose Management Service Market
- Bayer AG
- GE Healthcare
- Philips Healthcare
- Siemens Healthcare
- FUJIFILM Holdings Corporation
- Canon Inc.
- PACSHealth, LLC
- Sectra AB
- Bracco Imaging S.P.A.
- Qaelum N.V.
- Agfa Healthcare
- Novarad Corporation
- Medic Vision
- Guerbet
- Medsquare
- INFINITT Healthcare Co. Ltd.
- Volpara Helath Limited.
- Medic Vision
- Imalogix
- Dedalus S.P.A
- Nanjing Perlove Medical Equipment CO., LTD.
- Mirion Technologies, Inc.
- Landauer
- Polimaster
- Fortive
- Other Active Players
Key Industry Developments in the Radiation Dose Management Service Market:
- May 2023 - Carestream Health announced the introduction of its novel DRX-LC Detector, designed to improve image quality, patient comfort, and diagnostic confidence, as well as productivity for capturing long-length images in orthopedics.
- February 2023 - Carestream Health partnered with Robarts Research Institute to increase and demonstrate the clinical value of digital X-ray, digital tomosynthesis, and dual-energy technologies. It would improve the outcomes of patients with cardiothoracic and pulmonary diseases.
|
Global Radiation Dose Management Service Market |
|||
|
Base Year: |
2024 |
Forecast Period: |
2025-2032 |
|
Historical Data: |
2018 to 2023 |
Market Size in 2024: |
USD 763.2 Mn. |
|
Forecast Period 2025-32 CAGR: |
14.20% |
Market Size in 2032: |
USD 2207.84 Mn. |
|
Segments Covered: |
By Product & Services |
|
|
|
By Modality |
|
||
|
By Mode of Deployment |
|
||
|
By Revenue Model |
|
||
|
By Application |
|
||
|
By End-User |
|
||
|
By Region |
|
||
|
Key Market Drivers: |
|
||
|
Key Market Restraints: |
|
||
|
Key Opportunities: |
|
||
|
Companies Covered in the report: |
|
||
Chapter 1: Introduction
1.1 Scope and Coverage
Chapter 2:Executive Summary
Chapter 3: Market Landscape
3.1 Market Dynamics
3.1.1 Drivers
3.1.2 Restraints
3.1.3 Opportunities
3.1.4 Challenges
3.2 Market Trend Analysis
3.3 PESTLE Analysis
3.4 Porter's Five Forces Analysis
3.5 Industry Value Chain Analysis
3.6 Ecosystem
3.7 Regulatory Landscape
3.8 Price Trend Analysis
3.9 Patent Analysis
3.10 Technology Evolution
3.11 Investment Pockets
3.12 Import-Export Analysis
Chapter 4: Radiation Dose Management Service Market by Product & Services (2018-2032)
4.1 Radiation Dose Management Service Market Snapshot and Growth Engine
4.2 Market Overview
4.3 Radiation Dose Management Solutions
4.3.1 Introduction and Market Overview
4.3.2 Historic and Forecasted Market Size in Value USD and Volume Units
4.3.3 Key Market Trends, Growth Factors, and Opportunities
4.3.4 Geographic Segmentation Analysis
4.4 Standalone Solutions
4.5 Integrated Solutions
4.6 Radiation Dose Management Services
4.7 Support & Maintenance Services
4.8 Implementation & Integration Services
4.9 Consulting Services
4.10 Education & Training Services
4.11 Radiation Dose Management
Chapter 5: Radiation Dose Management Service Market by Modality (2018-2032)
5.1 Radiation Dose Management Service Market Snapshot and Growth Engine
5.2 Market Overview
5.3 Computed Tomography
5.3.1 Introduction and Market Overview
5.3.2 Historic and Forecasted Market Size in Value USD and Volume Units
5.3.3 Key Market Trends, Growth Factors, and Opportunities
5.3.4 Geographic Segmentation Analysis
5.4 Fluoroscopy & Interventional Imaging
5.5 Radiography
5.6 Mammography
5.7 Nuclear Medicine
Chapter 6: Radiation Dose Management Service Market by Mode of Deployment (2018-2032)
6.1 Radiation Dose Management Service Market Snapshot and Growth Engine
6.2 Market Overview
6.3 On-Premises
6.3.1 Introduction and Market Overview
6.3.2 Historic and Forecasted Market Size in Value USD and Volume Units
6.3.3 Key Market Trends, Growth Factors, and Opportunities
6.3.4 Geographic Segmentation Analysis
6.4 Cloud-Based
6.5 Web-Based
Chapter 7: Radiation Dose Management Service Market by Revenue Model (2018-2032)
7.1 Radiation Dose Management Service Market Snapshot and Growth Engine
7.2 Market Overview
7.3 Capital/Annual Purchase Model
7.3.1 Introduction and Market Overview
7.3.2 Historic and Forecasted Market Size in Value USD and Volume Units
7.3.3 Key Market Trends, Growth Factors, and Opportunities
7.3.4 Geographic Segmentation Analysis
7.4 Pay-Per Procedure Model
Chapter 8: Radiation Dose Management Service Market by Application (2018-2032)
8.1 Radiation Dose Management Service Market Snapshot and Growth Engine
8.2 Market Overview
8.3 Oncology
8.3.1 Introduction and Market Overview
8.3.2 Historic and Forecasted Market Size in Value USD and Volume Units
8.3.3 Key Market Trends, Growth Factors, and Opportunities
8.3.4 Geographic Segmentation Analysis
8.4 Cardiology
8.5 Dental
8.6 Orthopaedic Application
8.7 Other Applications (Neuroimaging
8.8 Genitourinary Imaging
8.9 etc)
Chapter 9: Radiation Dose Management Service Market by End-User (2018-2032)
9.1 Radiation Dose Management Service Market Snapshot and Growth Engine
9.2 Market Overview
9.3 Hospitals and Healthcare Systems
9.3.1 Introduction and Market Overview
9.3.2 Historic and Forecasted Market Size in Value USD and Volume Units
9.3.3 Key Market Trends, Growth Factors, and Opportunities
9.3.4 Geographic Segmentation Analysis
9.4 Ambulatory Surgery Centers
9.5 Diagnostic and Imaging Centers
9.6 Other End-users (Academic Research Institutes
9.7 Public and Private Research Laboratories)
Chapter 10: Company Profiles and Competitive Analysis
10.1 Competitive Landscape
10.1.1 Competitive Benchmarking
10.1.2 Radiation Dose Management Service Market Share by Manufacturer (2024)
10.1.3 Industry BCG Matrix
10.1.4 Heat Map Analysis
10.1.5 Mergers and Acquisitions
10.2 FLIR SYSTEMS INC. (U.S.)
10.2.1 Company Overview
10.2.2 Key Executives
10.2.3 Company Snapshot
10.2.4 Role of the Company in the Market
10.2.5 Sustainability and Social Responsibility
10.2.6 Operating Business Segments
10.2.7 Product Portfolio
10.2.8 Business Performance
10.2.9 Key Strategic Moves and Recent Developments
10.2.10 SWOT Analysis
10.3 FLUKE CORPORATION (U.S.)
10.4 LEONARDO DRS (U.S.)
10.5 TESTO INC. (U.S.)
10.6 UNITED TECHNOLOGIES (U.S.)
10.7 TELEDYNE FLIR LLC (U.S.)
10.8 L3HARRIS TECHNOLOGIES INC (U.S.)
10.9 SEEK THERMAL INC. (U.S.)
10.10 TRIJICON INC. (U.S.)
10.11 RAYTHEON CO. (U.S.)
10.12 BULLARD GMBH (GERMANY)
10.13 XENICS (BELGIUM)
10.14 AXIS COMMUNICATIONS AB (SWEDEN)
10.15 BAE SYSTEMS PLC (UK)
10.16 THERMOTEKNIX SYSTEMS (UK)
10.17 HT ITALIA S.R.L. (ITALY)
10.18 LEONARDO (ITALY)
10.19 DALI TECHNOLOGY COLTD. (CHINA)
10.20 ZHEJIANG DALI TECHNOLOGY COLTD. (CHINA)
10.21 OPGAL OPTRONIC INDUSTRIES LTD (ISRAEL)
10.22
Chapter 11: Global Radiation Dose Management Service Market By Region
11.1 Overview
11.2. North America Radiation Dose Management Service Market
11.2.1 Key Market Trends, Growth Factors and Opportunities
11.2.2 Top Key Companies
11.2.3 Historic and Forecasted Market Size by Segments
11.2.4 Historic and Forecasted Market Size by Product & Services
11.2.4.1 Radiation Dose Management Solutions
11.2.4.2 Standalone Solutions
11.2.4.3 Integrated Solutions
11.2.4.4 Radiation Dose Management Services
11.2.4.5 Support & Maintenance Services
11.2.4.6 Implementation & Integration Services
11.2.4.7 Consulting Services
11.2.4.8 Education & Training Services
11.2.4.9 Radiation Dose Management
11.2.5 Historic and Forecasted Market Size by Modality
11.2.5.1 Computed Tomography
11.2.5.2 Fluoroscopy & Interventional Imaging
11.2.5.3 Radiography
11.2.5.4 Mammography
11.2.5.5 Nuclear Medicine
11.2.6 Historic and Forecasted Market Size by Mode of Deployment
11.2.6.1 On-Premises
11.2.6.2 Cloud-Based
11.2.6.3 Web-Based
11.2.7 Historic and Forecasted Market Size by Revenue Model
11.2.7.1 Capital/Annual Purchase Model
11.2.7.2 Pay-Per Procedure Model
11.2.8 Historic and Forecasted Market Size by Application
11.2.8.1 Oncology
11.2.8.2 Cardiology
11.2.8.3 Dental
11.2.8.4 Orthopaedic Application
11.2.8.5 Other Applications (Neuroimaging
11.2.8.6 Genitourinary Imaging
11.2.8.7 etc)
11.2.9 Historic and Forecasted Market Size by End-User
11.2.9.1 Hospitals and Healthcare Systems
11.2.9.2 Ambulatory Surgery Centers
11.2.9.3 Diagnostic and Imaging Centers
11.2.9.4 Other End-users (Academic Research Institutes
11.2.9.5 Public and Private Research Laboratories)
11.2.10 Historic and Forecast Market Size by Country
11.2.10.1 US
11.2.10.2 Canada
11.2.10.3 Mexico
11.3. Eastern Europe Radiation Dose Management Service Market
11.3.1 Key Market Trends, Growth Factors and Opportunities
11.3.2 Top Key Companies
11.3.3 Historic and Forecasted Market Size by Segments
11.3.4 Historic and Forecasted Market Size by Product & Services
11.3.4.1 Radiation Dose Management Solutions
11.3.4.2 Standalone Solutions
11.3.4.3 Integrated Solutions
11.3.4.4 Radiation Dose Management Services
11.3.4.5 Support & Maintenance Services
11.3.4.6 Implementation & Integration Services
11.3.4.7 Consulting Services
11.3.4.8 Education & Training Services
11.3.4.9 Radiation Dose Management
11.3.5 Historic and Forecasted Market Size by Modality
11.3.5.1 Computed Tomography
11.3.5.2 Fluoroscopy & Interventional Imaging
11.3.5.3 Radiography
11.3.5.4 Mammography
11.3.5.5 Nuclear Medicine
11.3.6 Historic and Forecasted Market Size by Mode of Deployment
11.3.6.1 On-Premises
11.3.6.2 Cloud-Based
11.3.6.3 Web-Based
11.3.7 Historic and Forecasted Market Size by Revenue Model
11.3.7.1 Capital/Annual Purchase Model
11.3.7.2 Pay-Per Procedure Model
11.3.8 Historic and Forecasted Market Size by Application
11.3.8.1 Oncology
11.3.8.2 Cardiology
11.3.8.3 Dental
11.3.8.4 Orthopaedic Application
11.3.8.5 Other Applications (Neuroimaging
11.3.8.6 Genitourinary Imaging
11.3.8.7 etc)
11.3.9 Historic and Forecasted Market Size by End-User
11.3.9.1 Hospitals and Healthcare Systems
11.3.9.2 Ambulatory Surgery Centers
11.3.9.3 Diagnostic and Imaging Centers
11.3.9.4 Other End-users (Academic Research Institutes
11.3.9.5 Public and Private Research Laboratories)
11.3.10 Historic and Forecast Market Size by Country
11.3.10.1 Russia
11.3.10.2 Bulgaria
11.3.10.3 The Czech Republic
11.3.10.4 Hungary
11.3.10.5 Poland
11.3.10.6 Romania
11.3.10.7 Rest of Eastern Europe
11.4. Western Europe Radiation Dose Management Service Market
11.4.1 Key Market Trends, Growth Factors and Opportunities
11.4.2 Top Key Companies
11.4.3 Historic and Forecasted Market Size by Segments
11.4.4 Historic and Forecasted Market Size by Product & Services
11.4.4.1 Radiation Dose Management Solutions
11.4.4.2 Standalone Solutions
11.4.4.3 Integrated Solutions
11.4.4.4 Radiation Dose Management Services
11.4.4.5 Support & Maintenance Services
11.4.4.6 Implementation & Integration Services
11.4.4.7 Consulting Services
11.4.4.8 Education & Training Services
11.4.4.9 Radiation Dose Management
11.4.5 Historic and Forecasted Market Size by Modality
11.4.5.1 Computed Tomography
11.4.5.2 Fluoroscopy & Interventional Imaging
11.4.5.3 Radiography
11.4.5.4 Mammography
11.4.5.5 Nuclear Medicine
11.4.6 Historic and Forecasted Market Size by Mode of Deployment
11.4.6.1 On-Premises
11.4.6.2 Cloud-Based
11.4.6.3 Web-Based
11.4.7 Historic and Forecasted Market Size by Revenue Model
11.4.7.1 Capital/Annual Purchase Model
11.4.7.2 Pay-Per Procedure Model
11.4.8 Historic and Forecasted Market Size by Application
11.4.8.1 Oncology
11.4.8.2 Cardiology
11.4.8.3 Dental
11.4.8.4 Orthopaedic Application
11.4.8.5 Other Applications (Neuroimaging
11.4.8.6 Genitourinary Imaging
11.4.8.7 etc)
11.4.9 Historic and Forecasted Market Size by End-User
11.4.9.1 Hospitals and Healthcare Systems
11.4.9.2 Ambulatory Surgery Centers
11.4.9.3 Diagnostic and Imaging Centers
11.4.9.4 Other End-users (Academic Research Institutes
11.4.9.5 Public and Private Research Laboratories)
11.4.10 Historic and Forecast Market Size by Country
11.4.10.1 Germany
11.4.10.2 UK
11.4.10.3 France
11.4.10.4 The Netherlands
11.4.10.5 Italy
11.4.10.6 Spain
11.4.10.7 Rest of Western Europe
11.5. Asia Pacific Radiation Dose Management Service Market
11.5.1 Key Market Trends, Growth Factors and Opportunities
11.5.2 Top Key Companies
11.5.3 Historic and Forecasted Market Size by Segments
11.5.4 Historic and Forecasted Market Size by Product & Services
11.5.4.1 Radiation Dose Management Solutions
11.5.4.2 Standalone Solutions
11.5.4.3 Integrated Solutions
11.5.4.4 Radiation Dose Management Services
11.5.4.5 Support & Maintenance Services
11.5.4.6 Implementation & Integration Services
11.5.4.7 Consulting Services
11.5.4.8 Education & Training Services
11.5.4.9 Radiation Dose Management
11.5.5 Historic and Forecasted Market Size by Modality
11.5.5.1 Computed Tomography
11.5.5.2 Fluoroscopy & Interventional Imaging
11.5.5.3 Radiography
11.5.5.4 Mammography
11.5.5.5 Nuclear Medicine
11.5.6 Historic and Forecasted Market Size by Mode of Deployment
11.5.6.1 On-Premises
11.5.6.2 Cloud-Based
11.5.6.3 Web-Based
11.5.7 Historic and Forecasted Market Size by Revenue Model
11.5.7.1 Capital/Annual Purchase Model
11.5.7.2 Pay-Per Procedure Model
11.5.8 Historic and Forecasted Market Size by Application
11.5.8.1 Oncology
11.5.8.2 Cardiology
11.5.8.3 Dental
11.5.8.4 Orthopaedic Application
11.5.8.5 Other Applications (Neuroimaging
11.5.8.6 Genitourinary Imaging
11.5.8.7 etc)
11.5.9 Historic and Forecasted Market Size by End-User
11.5.9.1 Hospitals and Healthcare Systems
11.5.9.2 Ambulatory Surgery Centers
11.5.9.3 Diagnostic and Imaging Centers
11.5.9.4 Other End-users (Academic Research Institutes
11.5.9.5 Public and Private Research Laboratories)
11.5.10 Historic and Forecast Market Size by Country
11.5.10.1 China
11.5.10.2 India
11.5.10.3 Japan
11.5.10.4 South Korea
11.5.10.5 Malaysia
11.5.10.6 Thailand
11.5.10.7 Vietnam
11.5.10.8 The Philippines
11.5.10.9 Australia
11.5.10.10 New Zealand
11.5.10.11 Rest of APAC
11.6. Middle East & Africa Radiation Dose Management Service Market
11.6.1 Key Market Trends, Growth Factors and Opportunities
11.6.2 Top Key Companies
11.6.3 Historic and Forecasted Market Size by Segments
11.6.4 Historic and Forecasted Market Size by Product & Services
11.6.4.1 Radiation Dose Management Solutions
11.6.4.2 Standalone Solutions
11.6.4.3 Integrated Solutions
11.6.4.4 Radiation Dose Management Services
11.6.4.5 Support & Maintenance Services
11.6.4.6 Implementation & Integration Services
11.6.4.7 Consulting Services
11.6.4.8 Education & Training Services
11.6.4.9 Radiation Dose Management
11.6.5 Historic and Forecasted Market Size by Modality
11.6.5.1 Computed Tomography
11.6.5.2 Fluoroscopy & Interventional Imaging
11.6.5.3 Radiography
11.6.5.4 Mammography
11.6.5.5 Nuclear Medicine
11.6.6 Historic and Forecasted Market Size by Mode of Deployment
11.6.6.1 On-Premises
11.6.6.2 Cloud-Based
11.6.6.3 Web-Based
11.6.7 Historic and Forecasted Market Size by Revenue Model
11.6.7.1 Capital/Annual Purchase Model
11.6.7.2 Pay-Per Procedure Model
11.6.8 Historic and Forecasted Market Size by Application
11.6.8.1 Oncology
11.6.8.2 Cardiology
11.6.8.3 Dental
11.6.8.4 Orthopaedic Application
11.6.8.5 Other Applications (Neuroimaging
11.6.8.6 Genitourinary Imaging
11.6.8.7 etc)
11.6.9 Historic and Forecasted Market Size by End-User
11.6.9.1 Hospitals and Healthcare Systems
11.6.9.2 Ambulatory Surgery Centers
11.6.9.3 Diagnostic and Imaging Centers
11.6.9.4 Other End-users (Academic Research Institutes
11.6.9.5 Public and Private Research Laboratories)
11.6.10 Historic and Forecast Market Size by Country
11.6.10.1 Turkiye
11.6.10.2 Bahrain
11.6.10.3 Kuwait
11.6.10.4 Saudi Arabia
11.6.10.5 Qatar
11.6.10.6 UAE
11.6.10.7 Israel
11.6.10.8 South Africa
11.7. South America Radiation Dose Management Service Market
11.7.1 Key Market Trends, Growth Factors and Opportunities
11.7.2 Top Key Companies
11.7.3 Historic and Forecasted Market Size by Segments
11.7.4 Historic and Forecasted Market Size by Product & Services
11.7.4.1 Radiation Dose Management Solutions
11.7.4.2 Standalone Solutions
11.7.4.3 Integrated Solutions
11.7.4.4 Radiation Dose Management Services
11.7.4.5 Support & Maintenance Services
11.7.4.6 Implementation & Integration Services
11.7.4.7 Consulting Services
11.7.4.8 Education & Training Services
11.7.4.9 Radiation Dose Management
11.7.5 Historic and Forecasted Market Size by Modality
11.7.5.1 Computed Tomography
11.7.5.2 Fluoroscopy & Interventional Imaging
11.7.5.3 Radiography
11.7.5.4 Mammography
11.7.5.5 Nuclear Medicine
11.7.6 Historic and Forecasted Market Size by Mode of Deployment
11.7.6.1 On-Premises
11.7.6.2 Cloud-Based
11.7.6.3 Web-Based
11.7.7 Historic and Forecasted Market Size by Revenue Model
11.7.7.1 Capital/Annual Purchase Model
11.7.7.2 Pay-Per Procedure Model
11.7.8 Historic and Forecasted Market Size by Application
11.7.8.1 Oncology
11.7.8.2 Cardiology
11.7.8.3 Dental
11.7.8.4 Orthopaedic Application
11.7.8.5 Other Applications (Neuroimaging
11.7.8.6 Genitourinary Imaging
11.7.8.7 etc)
11.7.9 Historic and Forecasted Market Size by End-User
11.7.9.1 Hospitals and Healthcare Systems
11.7.9.2 Ambulatory Surgery Centers
11.7.9.3 Diagnostic and Imaging Centers
11.7.9.4 Other End-users (Academic Research Institutes
11.7.9.5 Public and Private Research Laboratories)
11.7.10 Historic and Forecast Market Size by Country
11.7.10.1 Brazil
11.7.10.2 Argentina
11.7.10.3 Rest of SA
Chapter 12 Analyst Viewpoint and Conclusion
12.1 Recommendations and Concluding Analysis
12.2 Potential Market Strategies
Chapter 13 Research Methodology
13.1 Research Process
13.2 Primary Research
13.3 Secondary Research
|
Global Radiation Dose Management Service Market |
|||
|
Base Year: |
2024 |
Forecast Period: |
2025-2032 |
|
Historical Data: |
2018 to 2023 |
Market Size in 2024: |
USD 763.2 Mn. |
|
Forecast Period 2025-32 CAGR: |
14.20% |
Market Size in 2032: |
USD 2207.84 Mn. |
|
Segments Covered: |
By Product & Services |
|
|
|
By Modality |
|
||
|
By Mode of Deployment |
|
||
|
By Revenue Model |
|
||
|
By Application |
|
||
|
By End-User |
|
||
|
By Region |
|
||
|
Key Market Drivers: |
|
||
|
Key Market Restraints: |
|
||
|
Key Opportunities: |
|
||
|
Companies Covered in the report: |
|
||


