


Phosphates for Animal Feed or Nutrition Market Synopsis
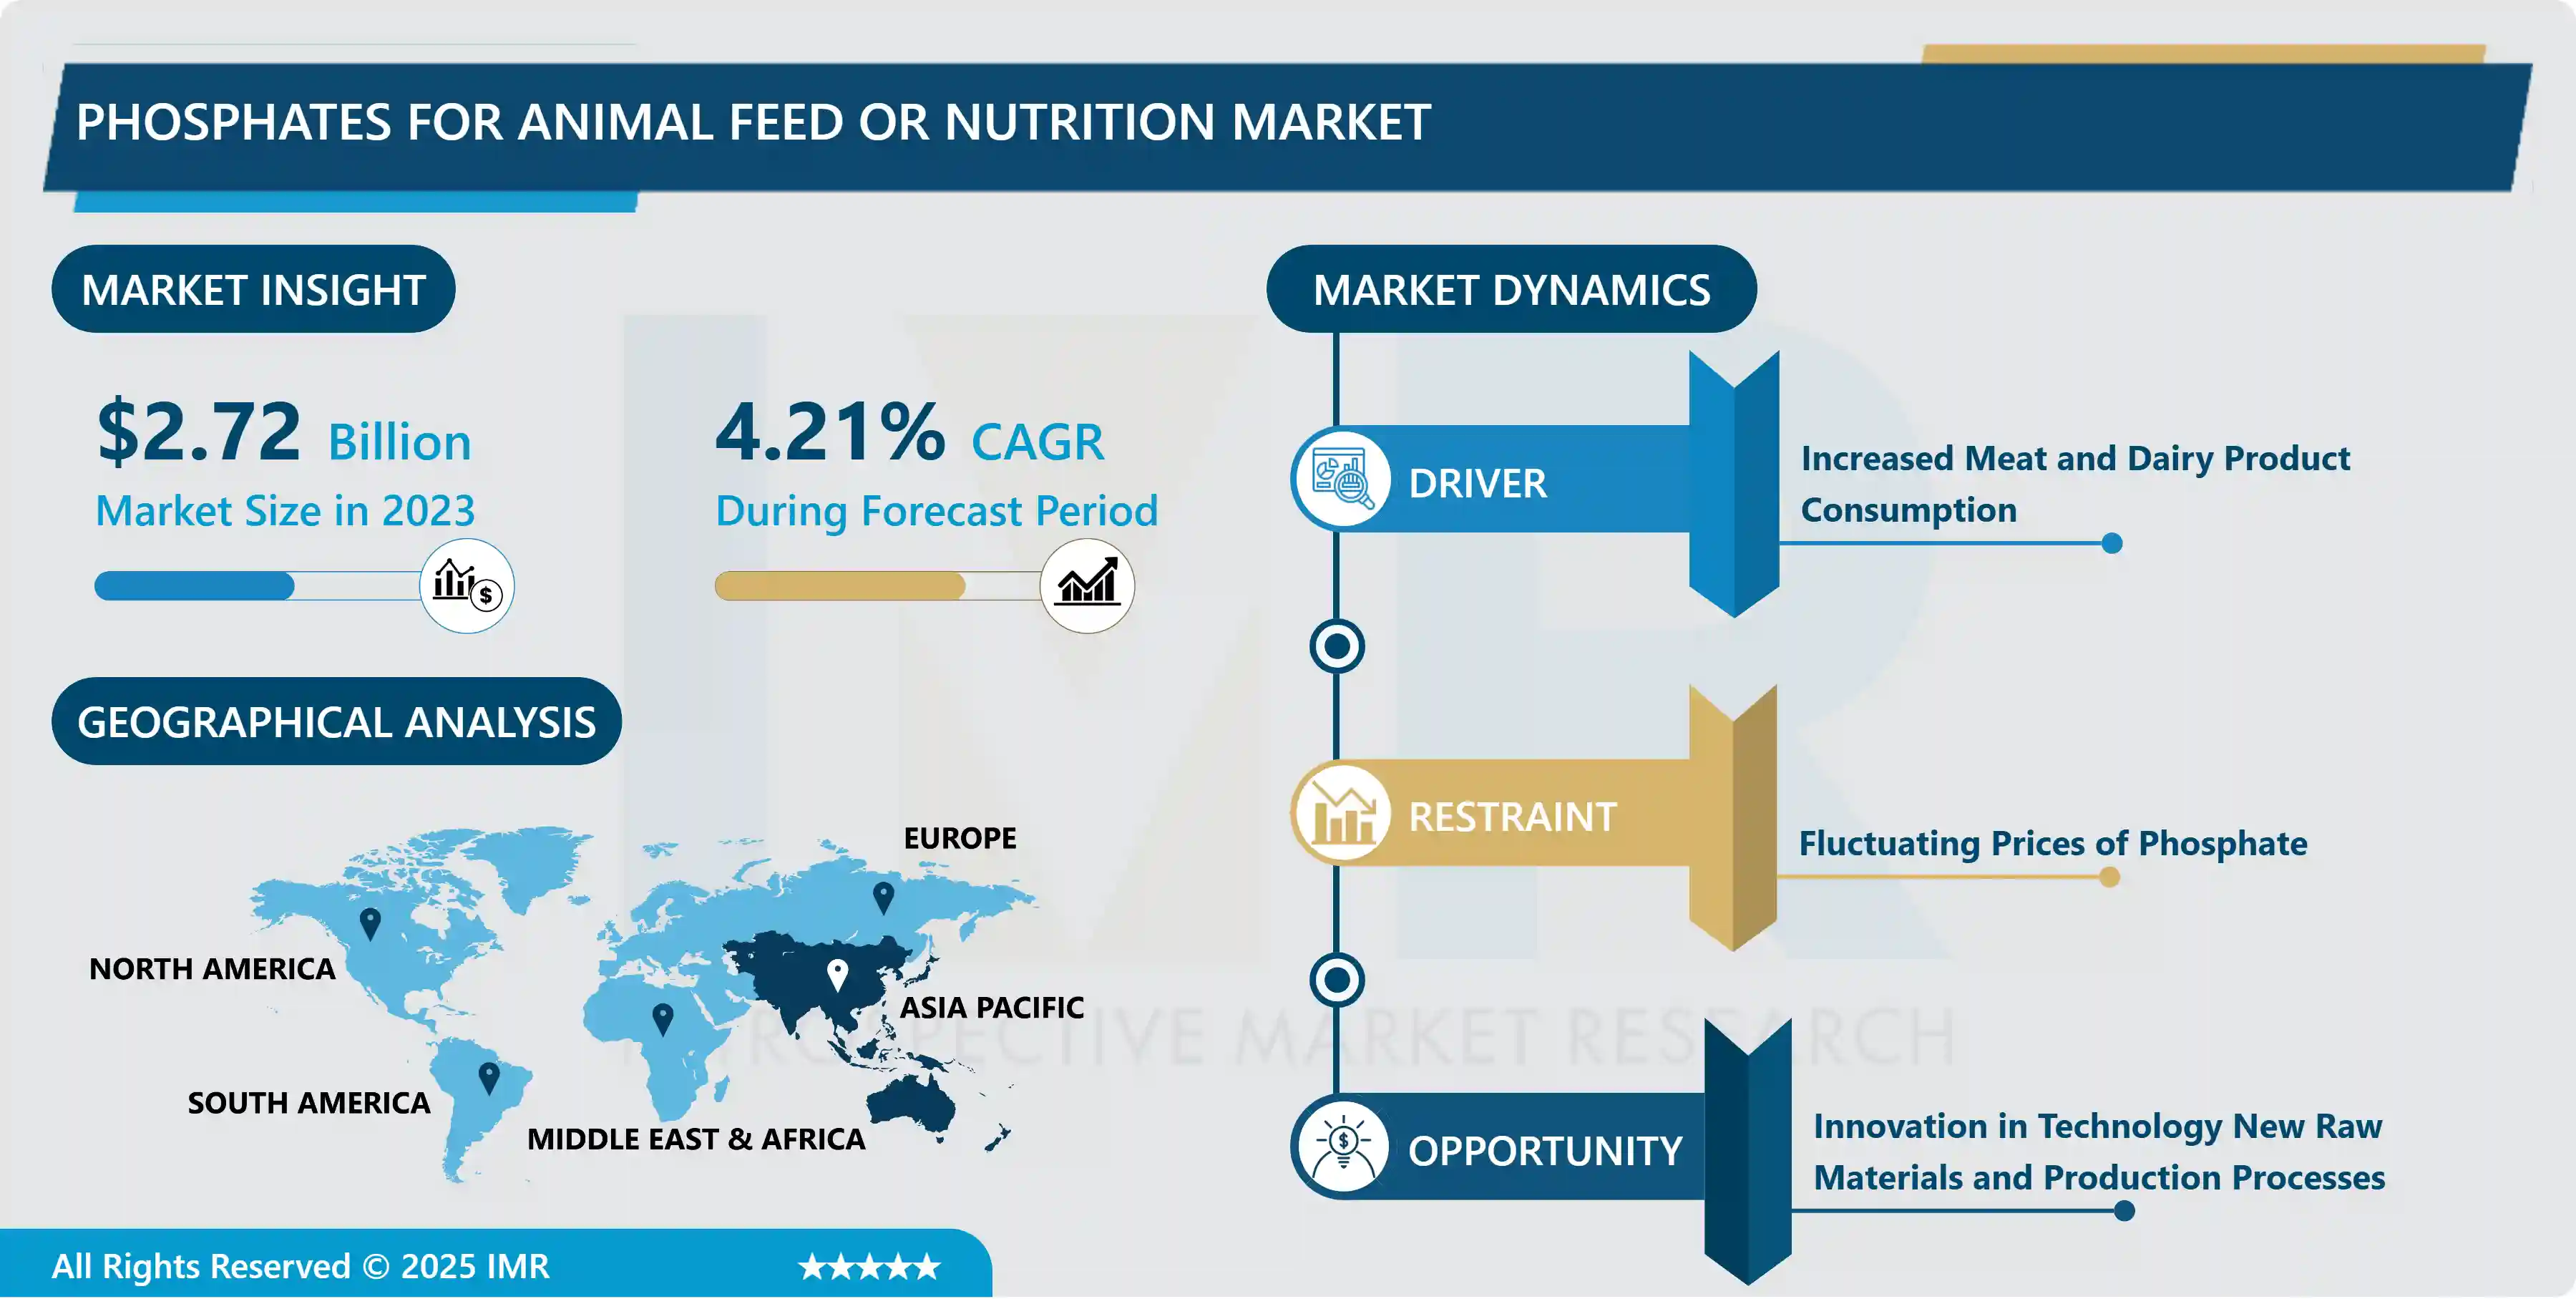
Global Phosphates for Animal Feed or Nutrition Market Size Was Valued at USD 2.72 Billion in 2023 and is Projected to Reach USD 3.94 Billion by 2032, Growing at a CAGR of 4.21% From 2024-2032
Phosphates utilized in animal feed or nutrition are vital compounds that actively contribute to the comprehensive health and growth of livestock. They are essential in facilitating bone formation, metabolic processes, and overall well-being. Compounds like Monocalcium Phosphate serve as essential elements in feed formulations, guaranteeing efficient nutrient utilization and elevating the productivity of animals in both the agricultural and livestock sectors
The utilization of phosphates in animal feed or nutrition is diverse and crucial for sustaining the health and productivity of livestock. Phosphates, such as Monocalcium Phosphate, are extensively incorporated into feed formulations to provide essential phosphorus and calcium. These compounds actively contribute to bone development, metabolic processes, and overall growth across various animal species. The precise integration of phosphates ensures a well-balanced diet for animals, meeting their nutritional requirements and fostering optimal health.
Phosphates enhance the bioavailability of essential nutrients, facilitating efficient absorption in the digestive systems of animals. in preventing nutritional deficiencies, ultimately enhancing the quality of animal products like meat and dairy. Additionally, phosphates contribute to addressing environmental concerns by reducing phosphorus excretion in animal waste, aligning with sustainable farming practices.
The future demand for phosphates in animal feed or nutrition is expected to witness steady growth. With the global population on the rise and dietary preferences shifting towards protein-rich diets, there will be an increasing need for efficient and sustainable animal farming. Phosphates, given their crucial role in enhancing animal nutrition, are poised to play a central role in meeting this demand. Ongoing advancements in agricultural practices and an increasing awareness of the importance of animal welfare further emphasize the potential for sustained and growing demand for phosphates in the foreseeable future.'
 Phosphates for Animal Feed or Nutrition Market Trend Analysis:
Increased Meat and Dairy Product Consumption
- The expansion of the Phosphates for Animal Feed or Nutrition market is significantly propelled by the increasing consumer demand for meat and dairy products. The surge in meat and dairy consumption, particularly in developing regions, actively fuels the market's growth due to the rising preference for protein-rich diets. This dietary shift serves as a primary catalyst, fostering a robust market for phosphates that play an indispensable role in enhancing animal nutrition.
- A crucial factor contributing to the growth of the Phosphates for Animal Feed or Nutrition market is these compounds' pivotal role in fostering livestock health. Phosphates actively contribute to the development of strong bones and teeth in animals, ensuring their overall well-being. Moreover, phosphates positively impact metabolic processes, actively promoting efficient nutrient utilization. This aspect sustains the growing demand for quality animal products, highlighting the indispensable nature of phosphates in animal nutrition.
- In the dynamic landscape of agriculture and livestock, the flourishing Phosphates for Animal Feed or Nutrition market is driven by the escalating need for improved feed formulations. Market participants are actively responding to the heightened demand for specialized feed additives that optimize animal nutrition. This proactive approach not only addresses current market requirements but also positions phosphates as crucial components shaping the future trajectory of animal feed and nutrition.
Innovation in Technology New Raw Materials and Production Processes
- The growth of the Phosphates for Animal Feed or Nutrition market is experiencing significant momentum driven by technological innovation, the introduction of new raw materials, and advancements in production processes. Technological breakthroughs are actively creating opportunities for improved efficiency and effectiveness in phosphate manufacturing. These innovations contribute to a streamlined production cycle, positively impacting the market's overall growth as stakeholders leverage cutting-edge solutions to meet evolving demands.
- The introduction of new raw materials plays a pivotal role in transforming the landscape of the Phosphates for Animal Feed or Nutrition market. Actively exploring and incorporating alternative sources contribute to diversifying the raw material base, ensuring a sustainable and resilient supply chain. This strategic shift not only addresses environmental concerns but also fosters market growth by creating opportunities for novel formulations, aligning with the dynamic needs of the animal feed and nutrition sector.
- The phosphates for the Animal Feed or Nutrition market is the continuous evolution of production processes. Embracing and implementing efficient manufacturing techniques actively enhances the market's competitiveness and responsiveness. This proactive approach not only meets the current demand for phosphates but positions the industry to capitalize on future opportunities, showcasing the sector's adaptability and commitment to ongoing improvement.
Phosphates for Animal Feed or Nutrition Market Segment Analysis:
Phosphates for Animal Feed or Nutrition Market Segmented on the basis of Type, Form, and Livestock
By Livestock, Poultry segment is expected to dominate the market during the forecast period
- The Poultry segment's dominance in propelling the growth of the Phosphates for Animal Feed or Nutrition market can be attributed to various factors. The active expansion of the poultry industry, driven by increasing consumer demand for poultry products, boosts the requirement for enhanced animal nutrition. Phosphates play a pivotal role in promoting the health and growth of poultry, thereby contributing to the productivity of the sector.
- The adaptability and efficiency of phosphates in poultry feed formulations actively contribute to their prominence. These compounds play a crucial role in supporting bone development, metabolic functions, and overall well-being in poultry. As the poultry industry continues to witness expansion and intensification, the demand for phosphates in animal feed formulations experiences a significant rise, solidifying the Poultry segment as a key driver in shaping the growth trajectory of the Phosphates for Animal Feed or Nutrition market.
By Type, Monocalcium Phosphate segment held the largest share of 43.50% in 2022
- The leading share of the Monocalcium Phosphate segment in driving the growth of the Phosphates for Animal Feed or Nutrition market. its prevalence in animal feed formulations stems from the versatility and effectiveness of Monocalcium Phosphate in providing essential phosphorus and calcium for livestock. This segment actively fulfills the nutritional requirements of various animals, significantly contributing to their overall health and productivity.
- The ease of integration into feed formulations and the bioavailability of nutrients make Monocalcium Phosphate a preferred choice for manufacturers. Its active role in supporting bone development and metabolic functions in animals positions it as a crucial component in the animal nutrition landscape. The consistent demand for efficient and reliable phosphate sources in animal feed formulations underscores the dominance of the Monocalcium Phosphate segment, establishing it as a key contributor to the market's substantial share.
Phosphates for Animal Feed or Nutrition Market Regional Insights:
Asia Pacific is Expected to Dominate the Market Over the Forecast period
- The leading role of Asia Pacific in driving the growth of the Phosphates for Animal Feed or Nutrition market can be attributed to several crucial factors. The region is actively witnessing a growing demand for meat and dairy products, driven by an expanding population and rising disposable incomes. This increased demand for animal products amplifies the necessity for enhanced animal nutrition, with phosphates being essential in meeting these evolving requirements.
- The proactive adoption of advanced agricultural practices and a rising awareness of the importance of animal nutrition in various countries across the Asia Pacific contribute to the region's prominence in the market. As the agriculture and livestock sectors undergo modernization, there is a heightened emphasis on optimizing feed formulations, with phosphates being integral to this process. This dynamic landscape positions Asia Pacific at the forefront of the Phosphates for Animal Feed or Nutrition market's growth, underscoring its major influence on the direction of the industry.
Phosphates for Animal Feed or Nutrition Market Top Key Players:
- J. R. Simplot Company (US)
- Mosiac (US)
- Nutrien Ltd. (Canada)
- Phosagro (Russia)
- EuroChem Group (Switzerland)
- Elixir Group (Balkans)
- Prayon Group (Belgium)
- Yara International ASA (Norway)
- Fosfitalia Group (Italy)
- AB LIFOSA (Spain)
- Sinochem Group (China)
- WengFu Group Co., Ltd. (China)
- Reanjoy Laboratories (China)
- Sichuan Lomon Corporation (China)
- Tata Chemicals (India)
- Rotem (Turkey)
- OCP Group (North Africa)
- Phosphea (North Africa), and Other Major Players.
Key Industry Developments in the Phosphates for Animal Feed or Nutrition Market:
- In July 2024, Cargill Animal Nutrition and Health is committed to delivering innovative feed, digital, biosecurity, and farm management solutions across various animal and aquaculture species. Sustainability remains a core focus, with increasing demand for sustainable solutions. "Our customers rely on us to help achieve their sustainability goals," said Linda Midgley, Enterprise Sustainability Lead. Cargill is launching a new sustainability strategy emphasizing collaboration and innovation throughout the value chain. In today’s Industry Perspectives, Ms. Midgley highlights how this strategy leads to tangible sustainability wins while prioritizing customer needs.
- In June 2024, ADM Animal Nutrition, a division of ADM, is expanding its recalls announced on March 30 and April 11, 2024, to include additional products due to elevated levels of magnesium, sodium, calcium, chloride, or phosphorus. These elevated levels may lead to various health issues in animals, including weight loss, decreased appetite, lethargy, and potential mortality. ADM is committed to ensuring the safety and well-being of all animals and encourages customers to check their products and consult with veterinarians if they have concerns.
|
Global Phosphates for Animal Feed or Nutrition Market |
|||
|
Base Year: |
2023 |
Forecast Period: |
2024-2032 |
|
Historical Data: |
2017 to 2023 |
Market Size in 2023: |
USD 2.72 Bn. |
|
Forecast Period 2024-32 CAGR: |
4.21 % |
Market Size in 2032: |
USD 3.94 Bn. |
|
Segments Covered: |
By Type |
|
|
|
By Form |
|
||
|
By Livestock |
|
||
|
By Region |
|
||
|
Key Market Drivers: |
|
||
|
Key Market Restraints: |
|
||
|
Key Opportunities: |
|
||
|
Companies Covered in the report: |
|
||
Chapter 1: Introduction
1.1 Scope and Coverage
Chapter 2:Executive Summary
Chapter 3: Market Landscape
3.1 Market Dynamics
3.1.1 Drivers
3.1.2 Restraints
3.1.3 Opportunities
3.1.4 Challenges
3.2 Market Trend Analysis
3.3 PESTLE Analysis
3.4 Porter's Five Forces Analysis
3.5 Industry Value Chain Analysis
3.6 Ecosystem
3.7 Regulatory Landscape
3.8 Price Trend Analysis
3.9 Patent Analysis
3.10 Technology Evolution
3.11 Investment Pockets
3.12 Import-Export Analysis
Chapter 4: Phosphates for Animal Feed or Nutrition Market by Type (2018-2032)
4.1 Phosphates for Animal Feed or Nutrition Market Snapshot and Growth Engine
4.2 Market Overview
4.3 Monocalcium Phosphate
4.3.1 Introduction and Market Overview
4.3.2 Historic and Forecasted Market Size in Value USD and Volume Units
4.3.3 Key Market Trends, Growth Factors, and Opportunities
4.3.4 Geographic Segmentation Analysis
4.4 Dicalcium Phosphate
4.5 Mono-Dicalcium Phosphate
4.6 Tricalcium Phosphate
4.7 Defluorinated Phosphate
Chapter 5: Phosphates for Animal Feed or Nutrition Market by Form (2018-2032)
5.1 Phosphates for Animal Feed or Nutrition Market Snapshot and Growth Engine
5.2 Market Overview
5.3 Powder
5.3.1 Introduction and Market Overview
5.3.2 Historic and Forecasted Market Size in Value USD and Volume Units
5.3.3 Key Market Trends, Growth Factors, and Opportunities
5.3.4 Geographic Segmentation Analysis
5.4 Granule
Chapter 6: Phosphates for Animal Feed or Nutrition Market by Livestock (2018-2032)
6.1 Phosphates for Animal Feed or Nutrition Market Snapshot and Growth Engine
6.2 Market Overview
6.3 Poultry
6.3.1 Introduction and Market Overview
6.3.2 Historic and Forecasted Market Size in Value USD and Volume Units
6.3.3 Key Market Trends, Growth Factors, and Opportunities
6.3.4 Geographic Segmentation Analysis
6.4 Swine
6.5 Cattle
6.6 Aquatic Animals
Chapter 7: Company Profiles and Competitive Analysis
7.1 Competitive Landscape
7.1.1 Competitive Benchmarking
7.1.2 Phosphates for Animal Feed or Nutrition Market Share by Manufacturer (2024)
7.1.3 Industry BCG Matrix
7.1.4 Heat Map Analysis
7.1.5 Mergers and Acquisitions
7.2 ANDERSON HAY(US)
7.2.1 Company Overview
7.2.2 Key Executives
7.2.3 Company Snapshot
7.2.4 Role of the Company in the Market
7.2.5 Sustainability and Social Responsibility
7.2.6 Operating Business Segments
7.2.7 Product Portfolio
7.2.8 Business Performance
7.2.9 Key Strategic Moves and Recent Developments
7.2.10 SWOT Analysis
7.3 ACX GLOBAL(US)
7.4 BAILEY FARMS(US)
7.5 ALDAHRA FAGAVI(SAUDI ARABIA)
7.6 GRUPO OSÉS(SPAIN)
7.7 GRUPPO CARLI(ITALY)
7.8 BORDER VALLEY TRADING(US)
7.9 BARR-AG(CANADA)
7.10 ALFA TEC(US)
7.11 STANDLEE HAY(US)
7.12 SACATE PELLET MILLS(US)
7.13 OXBOW ANIMAL HEALTH(US)
7.14 M&C HAY(US)
7.15 ACCOMAZZO(US)
7.16 HUISHAN DIARY(CHINA)
7.17 QIUSHI GRASS INDUSTRY(CHINA)
7.18 BEIJING HDR TRADING(CHINA)
7.19 BEIJING LVTIANYUAN ECOLOGICAL FARM(CHINA)
7.20 MODERN GRASSLAND(CHINA)
7.21 INNER MONGOLIA DACHEN AGRICULTURE(CHINA)
7.22 INNER MONGOLIA HUANGYANGWA GRASS INDUSTRY (CHINA)
7.23 AND OTHER KEY PLAYERS
7.24
Chapter 8: Global Phosphates for Animal Feed or Nutrition Market By Region
8.1 Overview
8.2. North America Phosphates for Animal Feed or Nutrition Market
8.2.1 Key Market Trends, Growth Factors and Opportunities
8.2.2 Top Key Companies
8.2.3 Historic and Forecasted Market Size by Segments
8.2.4 Historic and Forecasted Market Size by Type
8.2.4.1 Monocalcium Phosphate
8.2.4.2 Dicalcium Phosphate
8.2.4.3 Mono-Dicalcium Phosphate
8.2.4.4 Tricalcium Phosphate
8.2.4.5 Defluorinated Phosphate
8.2.5 Historic and Forecasted Market Size by Form
8.2.5.1 Powder
8.2.5.2 Granule
8.2.6 Historic and Forecasted Market Size by Livestock
8.2.6.1 Poultry
8.2.6.2 Swine
8.2.6.3 Cattle
8.2.6.4 Aquatic Animals
8.2.7 Historic and Forecast Market Size by Country
8.2.7.1 US
8.2.7.2 Canada
8.2.7.3 Mexico
8.3. Eastern Europe Phosphates for Animal Feed or Nutrition Market
8.3.1 Key Market Trends, Growth Factors and Opportunities
8.3.2 Top Key Companies
8.3.3 Historic and Forecasted Market Size by Segments
8.3.4 Historic and Forecasted Market Size by Type
8.3.4.1 Monocalcium Phosphate
8.3.4.2 Dicalcium Phosphate
8.3.4.3 Mono-Dicalcium Phosphate
8.3.4.4 Tricalcium Phosphate
8.3.4.5 Defluorinated Phosphate
8.3.5 Historic and Forecasted Market Size by Form
8.3.5.1 Powder
8.3.5.2 Granule
8.3.6 Historic and Forecasted Market Size by Livestock
8.3.6.1 Poultry
8.3.6.2 Swine
8.3.6.3 Cattle
8.3.6.4 Aquatic Animals
8.3.7 Historic and Forecast Market Size by Country
8.3.7.1 Russia
8.3.7.2 Bulgaria
8.3.7.3 The Czech Republic
8.3.7.4 Hungary
8.3.7.5 Poland
8.3.7.6 Romania
8.3.7.7 Rest of Eastern Europe
8.4. Western Europe Phosphates for Animal Feed or Nutrition Market
8.4.1 Key Market Trends, Growth Factors and Opportunities
8.4.2 Top Key Companies
8.4.3 Historic and Forecasted Market Size by Segments
8.4.4 Historic and Forecasted Market Size by Type
8.4.4.1 Monocalcium Phosphate
8.4.4.2 Dicalcium Phosphate
8.4.4.3 Mono-Dicalcium Phosphate
8.4.4.4 Tricalcium Phosphate
8.4.4.5 Defluorinated Phosphate
8.4.5 Historic and Forecasted Market Size by Form
8.4.5.1 Powder
8.4.5.2 Granule
8.4.6 Historic and Forecasted Market Size by Livestock
8.4.6.1 Poultry
8.4.6.2 Swine
8.4.6.3 Cattle
8.4.6.4 Aquatic Animals
8.4.7 Historic and Forecast Market Size by Country
8.4.7.1 Germany
8.4.7.2 UK
8.4.7.3 France
8.4.7.4 The Netherlands
8.4.7.5 Italy
8.4.7.6 Spain
8.4.7.7 Rest of Western Europe
8.5. Asia Pacific Phosphates for Animal Feed or Nutrition Market
8.5.1 Key Market Trends, Growth Factors and Opportunities
8.5.2 Top Key Companies
8.5.3 Historic and Forecasted Market Size by Segments
8.5.4 Historic and Forecasted Market Size by Type
8.5.4.1 Monocalcium Phosphate
8.5.4.2 Dicalcium Phosphate
8.5.4.3 Mono-Dicalcium Phosphate
8.5.4.4 Tricalcium Phosphate
8.5.4.5 Defluorinated Phosphate
8.5.5 Historic and Forecasted Market Size by Form
8.5.5.1 Powder
8.5.5.2 Granule
8.5.6 Historic and Forecasted Market Size by Livestock
8.5.6.1 Poultry
8.5.6.2 Swine
8.5.6.3 Cattle
8.5.6.4 Aquatic Animals
8.5.7 Historic and Forecast Market Size by Country
8.5.7.1 China
8.5.7.2 India
8.5.7.3 Japan
8.5.7.4 South Korea
8.5.7.5 Malaysia
8.5.7.6 Thailand
8.5.7.7 Vietnam
8.5.7.8 The Philippines
8.5.7.9 Australia
8.5.7.10 New Zealand
8.5.7.11 Rest of APAC
8.6. Middle East & Africa Phosphates for Animal Feed or Nutrition Market
8.6.1 Key Market Trends, Growth Factors and Opportunities
8.6.2 Top Key Companies
8.6.3 Historic and Forecasted Market Size by Segments
8.6.4 Historic and Forecasted Market Size by Type
8.6.4.1 Monocalcium Phosphate
8.6.4.2 Dicalcium Phosphate
8.6.4.3 Mono-Dicalcium Phosphate
8.6.4.4 Tricalcium Phosphate
8.6.4.5 Defluorinated Phosphate
8.6.5 Historic and Forecasted Market Size by Form
8.6.5.1 Powder
8.6.5.2 Granule
8.6.6 Historic and Forecasted Market Size by Livestock
8.6.6.1 Poultry
8.6.6.2 Swine
8.6.6.3 Cattle
8.6.6.4 Aquatic Animals
8.6.7 Historic and Forecast Market Size by Country
8.6.7.1 Turkiye
8.6.7.2 Bahrain
8.6.7.3 Kuwait
8.6.7.4 Saudi Arabia
8.6.7.5 Qatar
8.6.7.6 UAE
8.6.7.7 Israel
8.6.7.8 South Africa
8.7. South America Phosphates for Animal Feed or Nutrition Market
8.7.1 Key Market Trends, Growth Factors and Opportunities
8.7.2 Top Key Companies
8.7.3 Historic and Forecasted Market Size by Segments
8.7.4 Historic and Forecasted Market Size by Type
8.7.4.1 Monocalcium Phosphate
8.7.4.2 Dicalcium Phosphate
8.7.4.3 Mono-Dicalcium Phosphate
8.7.4.4 Tricalcium Phosphate
8.7.4.5 Defluorinated Phosphate
8.7.5 Historic and Forecasted Market Size by Form
8.7.5.1 Powder
8.7.5.2 Granule
8.7.6 Historic and Forecasted Market Size by Livestock
8.7.6.1 Poultry
8.7.6.2 Swine
8.7.6.3 Cattle
8.7.6.4 Aquatic Animals
8.7.7 Historic and Forecast Market Size by Country
8.7.7.1 Brazil
8.7.7.2 Argentina
8.7.7.3 Rest of SA
Chapter 9 Analyst Viewpoint and Conclusion
9.1 Recommendations and Concluding Analysis
9.2 Potential Market Strategies
Chapter 10 Research Methodology
10.1 Research Process
10.2 Primary Research
10.3 Secondary Research
|
Global Phosphates for Animal Feed or Nutrition Market |
|||
|
Base Year: |
2023 |
Forecast Period: |
2024-2032 |
|
Historical Data: |
2017 to 2023 |
Market Size in 2023: |
USD 2.72 Bn. |
|
Forecast Period 2024-32 CAGR: |
4.21 % |
Market Size in 2032: |
USD 3.94 Bn. |
|
Segments Covered: |
By Type |
|
|
|
By Form |
|
||
|
By Livestock |
|
||
|
By Region |
|
||
|
Key Market Drivers: |
|
||
|
Key Market Restraints: |
|
||
|
Key Opportunities: |
|
||
|
Companies Covered in the report: |
|
||


