


Performance Chemicals Market Synopsis
Performance Chemicals Market Size Was Valued at USD 295.2 Billion in 2024 and is Projected to Reach USD 471.21 Billion by 2032, Growing at a CAGR of 6.02% From 2025-2032.
Performance chemicals refer to a broad category of specialty chemicals designed to enhance the performance or functionality of products in various industries. They are formulated for specific applications and often offer improved properties such as durability, strength, resistance to heat or chemicals, and other desirable characteristics. These chemicals are used in diverse sectors including automotive, construction, electronics, agriculture, and healthcare, among others.
Performance chemicals are specialized chemicals used in various industries for specific applications requiring high performance, reliability, and efficiency. They are commonly used in the automotive industry for fuel additives, engine coolants, adhesives, sealants, construction, electronics, agriculture, oil and gas, personal care, and cosmetics. In the automotive industry, they improve fuel efficiency, reduce emissions, and prevent corrosion. In the construction industry, they enhance concrete properties, form a barrier against moisture, and improve adhesion, durability, and resistance to corrosion.
In the electronics industry, they are crucial in semiconductor fabrication, Printed Circuit Board (PCB) production, and electronic cleaning agents. In the agricultural industry, they protect crops from pests, diseases, and weeds, enhance nutrient uptake, and improve soil fertility. In the oil and gas industry, they control viscosity, lubricate equipment, and prevent formation damage. In the personal care and cosmetics industry, they are used in shampoos, lotions, creams, preserves, antioxidants, and UV absorbers and filters. The demand for performance chemicals continues to grow as industries seek innovative solutions to improve efficiency, sustainability, and product performance.
Performance chemicals are essential in industries like automotive, aerospace, electronics, construction, and agriculture to improve product performance, efficiency, and durability. They play a crucial role in developing advanced materials with specific properties like strength, heat resistance, conductivity, and corrosion resistance. Regulatory compliance drives the demand for eco-friendly performance chemicals, such as low-VOC coatings and adhesives. Innovation and R&D drive for improved performance chemicals fuels the demand.
The expansion of emerging economies in industries like automotive, electronics, construction, and healthcare has contributed to the demand for performance chemicals. Performance chemicals help companies enhance efficiency and reduce costs by improving product performance, reducing maintenance requirements, and optimizing manufacturing processes. Some performance chemicals are used in specialized applications like specialty coatings, catalysts, surfactants, and polymers, offering unique properties and benefits.
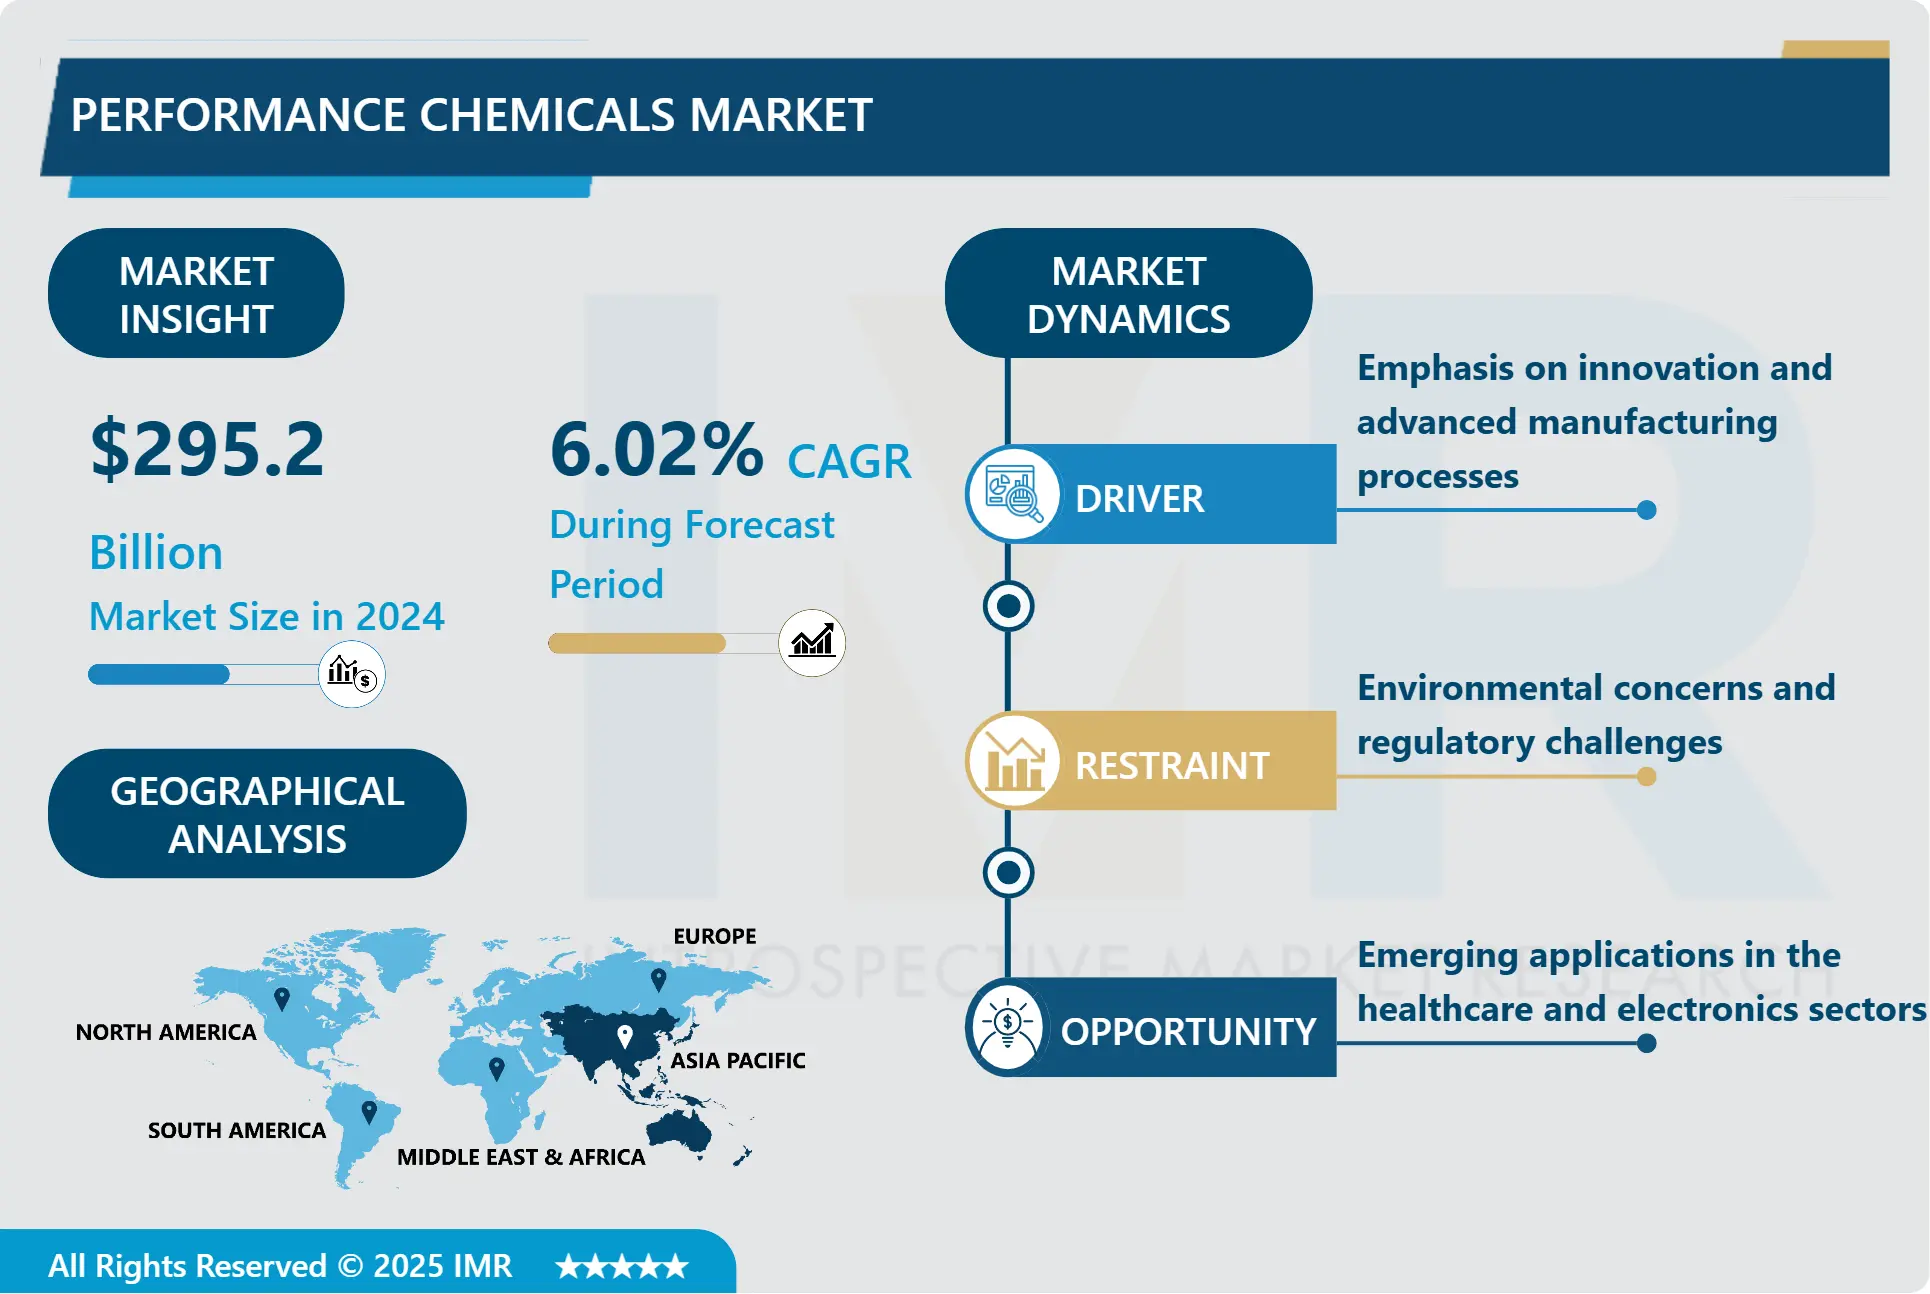

Performance Chemicals Market Trend Analysis- Emphasis on innovation and advanced manufacturing processes
- Innovation and advanced manufacturing processes are crucial in the performance chemicals industry for growth and competitiveness. Innovation drives product development and differentiation, allowing manufacturers to differentiate their products and gain a competitive edge. Advanced manufacturing processes, such as process automation, predictive analytics, and real-time monitoring, optimize production processes, minimize waste, and reduce energy consumption, resulting in operational efficiency and cost savings.
- Customization and tailored solutions are also enabled by innovation, allowing companies to meet specific customer requirements with technologies like 3D printing and precision engineering. Sustainability and environmental responsibility are also emphasized, allowing companies to develop more sustainable and environmentally friendly solutions. By leveraging eco-friendly raw materials, reducing resource consumption, and minimizing emissions and waste generation, manufacturers can address environmental concerns and enhance brand reputation.
- Advanced manufacturing processes also enable companies to bring new products to market faster and respond quickly to changing customer demands. Agile methodologies, such as lean production and just-in-time inventory management, enhance flexibility and responsiveness across the supply chain, allowing manufacturers to capitalize on emerging trends and capture market opportunities ahead of competitors.
Performance Chemicals Market Restraint - Environmental concerns and regulatory challenges
- The performance chemicals industry faces restraints due to environmental concerns and regulatory challenges. Pollution from the production and use of these chemicals can lead to air, water, and soil pollution, affecting ecosystems and human health. Resource depletion from non-renewable resources like fossil fuels and minerals can cause habitat destruction, biodiversity loss, and depletion of natural resources.
- Certain performance chemicals, particularly those derived from fossil fuels, can contribute to greenhouse gas emissions and exacerbate climate change. Regulating challenges include stringent regulations addressing environmental and health concerns, which may include restrictions on certain chemicals, emission limits, and environmental monitoring and reporting requirements.
- Compliance costs for manufacturers can be significant, affecting profitability and competitiveness in the market. Global harmonization is also a challenge for the industry, as it operates in a global marketplace, making it difficult for companies to navigate disparate regulatory frameworks across different countries and regions. Harmonizing regulations and standards internationally can facilitate trade and ensure consistent environmental and safety standards, but requires coordination among governments and industry stakeholders.
Performance Chemicals Market Opportunity- Emerging applications in the healthcare and electronics sectors
- Performance chemicals are emerging in the healthcare and electronics sectors, offering significant opportunities for innovation and growth. In the healthcare sector, they can be used to develop advanced drug delivery systems, improve patient compliance, and minimize side effects. They are also crucial in the manufacturing of medical devices, such as implants and diagnostic equipment, which can improve biocompatibility, durability, and performance.
- Performance chemicals are also essential in biotechnology applications, such as tissue engineering and regenerative medicine. In the electronics sector, they are essential in semiconductor manufacturing processes, enabling the production of smaller, faster, and more energy-efficient devices. They are also enabling the development of printed electronics, enabling the fabrication of flexible displays, sensors, and wearable devices.
- Performance chemicals are also crucial for the development of advanced energy storage technologies, such as lithium-ion batteries and supercapacitors, which improve the performance, safety, and longevity of these devices, driving innovation in portable electronics, electric vehicles, and renewable energy systems.
Performance Chemicals Market Challenge- Changing Customer Needs and Preferences
- Performance chemicals companies face a significant challenge due to evolving customer needs and preferences. These changes are driven by technological advancements, regulatory requirements, and evolving consumer preferences. Companies must adapt to these changes to remain competitive. Customization requirements are also a significant challenge, as customers often demand customized solutions.
- Sustainability concerns are also growing, necessitating companies to develop eco-friendly products and reduce their environmental footprint. Regulatory compliance is another challenge, as customers prioritize products that meet or exceed standards. Globalization has intensified competition, forcing companies to respond quickly to changing customer needs.
- Digital transformation has transformed customer interactions, requiring companies to leverage digital technologies to enhance customer engagement. Supply chain complexity can also be a challenge, as changing customer needs introduce complexities like fluctuating demand and inventory management issues. Building and maintaining strong brand loyalty and reputation is crucial for performance chemicals companies to retain and attract customers amidst changing preferences.
Performance Chemicals Market Segment Analysis:
Performance Chemicals Market Segmented on the basis of type, application, and end-users.
By Type, Antioxidants segment is expected to dominate the market during the forecast period
- Antioxidants are increasingly being used in various industries to prevent degradation caused by oxidation, leading to a growing demand for their use. They play a crucial role in extending product shelf life, reducing waste, and enhancing sustainability. As environmental concerns and regulations become more stringent, there is a greater emphasis on incorporating antioxidants into formulations to improve product lifespan and reduce environmental impact.
- Antioxidants are also found in industries like automotive, packaging, cosmetics, and agriculture. Technological advancements in antioxidants have led to more effective and versatile formulations, fueling the demand for antioxidant-based solutions. Consumer awareness of antioxidant benefits in health and product performance has also increased demand for products fortified with antioxidants.
By Application, Pesticides segment held the largest share of 54.7% in 2024
- Performance chemicals are essential in industries like automotive, construction, agriculture, and consumer goods, particularly in pesticides. These chemicals play a crucial role in protecting crops from pests and diseases, enhancing yields and quality. The demand for these chemicals is high due to their essential roles in various applications.
- The market for pesticides is substantial, reflecting the significant agricultural activities worldwide. Technological advancements have led to more efficient and effective pesticides, further driving demand. The regulatory environment surrounding these chemicals may also impact market dynamics, with compliance with environmental protection and human health regulations potentially influencing market share within these segments.
Performance Chemicals Market Regional Insights:
Asia Pacific is Expected to Dominate the Market Over the Forecast period
- The Asia-Pacific region is experiencing rapid economic growth, particularly in China and India, which is driving industrialization and urbanization, leading to increased demand for performance chemicals in industries like automotive, construction, electronics, and manufacturing. The region's large population and skilled workforce have fueled the demand for products and services requiring performance chemicals, including consumer goods, healthcare products, and infrastructure development.
- Government initiatives in the region are implementing policies and regulations to support industries, often requiring performance chemicals to improve product quality, safety, and environmental sustainability. Technological advancements in the region are also driving market growth as industries adopt these advancements to improve their products and processes. Infrastructure projects in the region, such as roads, bridges, airports, and utilities, require performance chemicals for construction materials, coatings, and adhesives, further driving demand in the market.
Performance Chemicals Market Top Key Players:
- Dow Chemical Company (US)
- DuPont de Nemours, Inc. (US)
- ExxonMobil Chemical Company (US)
- Eastman Chemical Company (US)
- Chevron Phillips Chemical Company LLC (US)
- PPG Industries, Inc. (US)
- Huntsman Corporation (US)
- Air Products and Chemicals, Inc. (US)
- Celanese Corporation (US)
- Evonik Industries AG (Germany)
- BASF SE (Germany)
- LANXESS AG (Germany)
- Covestro AG (Germany)
- Wacker Chemie AG (Germany)
- Croda International Plc (UK)
- SABIC (Saudi Arabia)
- Akzo Nobel N.V. (Netherlands)
- LyondellBasell Industries N.V. (Netherlands)
- Clariant AG (Switzerland)
- Sumitomo Chemical Company, Limited (Japan)
- Mitsubishi Chemical Corporation (Japan)
- Shin-Etsu Chemical Co., Ltd. (Japan)
- SABIC (Saudi Arabia), and other active players
Key Industry Developments in the Performance Chemicals Market
- In November 2024, Exxon Mobil Corporation announced its acquisition of Denbury Inc. This transaction is a major step forward in the profitable growth of our Low Carbon Solutions business, expands the low-carbon leadership and best positions us to meet the decarbonization needs of industrial customers while also reducing emissions in our own operations. company expands low-carbon leadership and best positions to meet the decarbonization needs of industrial customers while also reducing emissions in company operations.
- In August 2024, DuPont announced acquisition of Spectrum Plastics Group ("Spectrum"), a recognized leader in specialty medical devices and components markets. This acquisition fully aligns with our strategic objectives and is expected to increase overall top-line growth rates for DuPont through a broader and more integrated set of offerings for critical healthcare applications led by customer-driven innovation.
|
Global Performance Chemicals Market |
|||
|
Base Year: |
2024 |
Forecast Period: |
2025-2032 |
|
Historical Data: |
2018 to 2023 |
Market Size in 2024: |
295.2 Bn. |
|
Forecast Period 2025-32 CAGR: |
6.02% |
Market Size in 2032: |
471.22 Bn. |
|
Segments Covered: |
By Type |
|
|
|
By Application |
|
||
|
By End User |
|
||
|
By Region |
|
||
|
Key Market Drivers: |
|
||
|
Key Market Restraints: |
|
||
|
Key Opportunities: |
|
||
|
Companies Covered in the report: |
|
||
Chapter 1: Introduction
1.1 Scope and Coverage
Chapter 2:Executive Summary
Chapter 3: Market Landscape
3.1 Market Dynamics
3.1.1 Drivers
3.1.2 Restraints
3.1.3 Opportunities
3.1.4 Challenges
3.2 Market Trend Analysis
3.3 PESTLE Analysis
3.4 Porter's Five Forces Analysis
3.5 Industry Value Chain Analysis
3.6 Ecosystem
3.7 Regulatory Landscape
3.8 Price Trend Analysis
3.9 Patent Analysis
3.10 Technology Evolution
3.11 Investment Pockets
3.12 Import-Export Analysis
Chapter 4: Performance Chemicals Market by Type (2018-2032)
4.1 Performance Chemicals Market Snapshot and Growth Engine
4.2 Market Overview
4.3 Antioxidants
4.3.1 Introduction and Market Overview
4.3.2 Historic and Forecasted Market Size in Value USD and Volume Units
4.3.3 Key Market Trends, Growth Factors, and Opportunities
4.3.4 Geographic Segmentation Analysis
4.4 Surfactants
4.5 Biocides
Chapter 5: Performance Chemicals Market by Application (2018-2032)
5.1 Performance Chemicals Market Snapshot and Growth Engine
5.2 Market Overview
5.3 Pesticides
5.3.1 Introduction and Market Overview
5.3.2 Historic and Forecasted Market Size in Value USD and Volume Units
5.3.3 Key Market Trends, Growth Factors, and Opportunities
5.3.4 Geographic Segmentation Analysis
5.4 Advanced Ceramic Materials
5.5 Cosmetic Chemicals
5.6 Electronic Chemicals
5.7 Food Additives
5.8 Imaging chemicals and Materials
Chapter 6: Performance Chemicals Market by End User (2018-2032)
6.1 Performance Chemicals Market Snapshot and Growth Engine
6.2 Market Overview
6.3 Agrochemicals
6.3.1 Introduction and Market Overview
6.3.2 Historic and Forecasted Market Size in Value USD and Volume Units
6.3.3 Key Market Trends, Growth Factors, and Opportunities
6.3.4 Geographic Segmentation Analysis
6.4 Industrial Processes
6.5 Construction
6.6 Automotive
6.7 Personal Care
6.8 Textile
Chapter 7: Company Profiles and Competitive Analysis
7.1 Competitive Landscape
7.1.1 Competitive Benchmarking
7.1.2 Performance Chemicals Market Share by Manufacturer (2024)
7.1.3 Industry BCG Matrix
7.1.4 Heat Map Analysis
7.1.5 Mergers and Acquisitions
7.2 BEYOND MEAT (US)
7.2.1 Company Overview
7.2.2 Key Executives
7.2.3 Company Snapshot
7.2.4 Role of the Company in the Market
7.2.5 Sustainability and Social Responsibility
7.2.6 Operating Business Segments
7.2.7 Product Portfolio
7.2.8 Business Performance
7.2.9 Key Strategic Moves and Recent Developments
7.2.10 SWOT Analysis
7.3 IMPOSSIBLE FOODS (US)
7.4 MEMPHIS MEATS (US)
7.5 JUST INC. (US)
7.6 NEW AGE MEATS (US)
7.7 NO EVIL FOODS (US)
7.8 PERFECT DAY (US)
7.9 EAT JUST INC. (US)
7.10 ALPHA FOODS CO. (US)
7.11 GOOD CATCH (US)
7.12 TOFURKY (US)
7.13 GREENLEAF FOODS (US)
7.14 GARDEIN (CANADA)
7.15 QUORN FOODS (UK)
7.16 PLANT & BEAN (UK)
7.17 MOVING MOUNTAINS FOODS (UK)
7.18 VBITES (UK)
7.19 THE VEGETARIAN BUTCHER (NETHERLANDS)
7.20 OJAH BV (NETHERLANDS)
7.21 VIVERA (NETHERLANDS)
7.22 ALEPH FARMS (ISRAEL)
7.23 MOSA MEAT (NETHERLANDS)
7.24 FUTURE MEAT TECHNOLOGIES (ISRAEL)
7.25 GOLD & GREEN FOODS (FINLAND)
7.26
Chapter 8: Global Performance Chemicals Market By Region
8.1 Overview
8.2. North America Performance Chemicals Market
8.2.1 Key Market Trends, Growth Factors and Opportunities
8.2.2 Top Key Companies
8.2.3 Historic and Forecasted Market Size by Segments
8.2.4 Historic and Forecasted Market Size by Type
8.2.4.1 Antioxidants
8.2.4.2 Surfactants
8.2.4.3 Biocides
8.2.5 Historic and Forecasted Market Size by Application
8.2.5.1 Pesticides
8.2.5.2 Advanced Ceramic Materials
8.2.5.3 Cosmetic Chemicals
8.2.5.4 Electronic Chemicals
8.2.5.5 Food Additives
8.2.5.6 Imaging chemicals and Materials
8.2.6 Historic and Forecasted Market Size by End User
8.2.6.1 Agrochemicals
8.2.6.2 Industrial Processes
8.2.6.3 Construction
8.2.6.4 Automotive
8.2.6.5 Personal Care
8.2.6.6 Textile
8.2.7 Historic and Forecast Market Size by Country
8.2.7.1 US
8.2.7.2 Canada
8.2.7.3 Mexico
8.3. Eastern Europe Performance Chemicals Market
8.3.1 Key Market Trends, Growth Factors and Opportunities
8.3.2 Top Key Companies
8.3.3 Historic and Forecasted Market Size by Segments
8.3.4 Historic and Forecasted Market Size by Type
8.3.4.1 Antioxidants
8.3.4.2 Surfactants
8.3.4.3 Biocides
8.3.5 Historic and Forecasted Market Size by Application
8.3.5.1 Pesticides
8.3.5.2 Advanced Ceramic Materials
8.3.5.3 Cosmetic Chemicals
8.3.5.4 Electronic Chemicals
8.3.5.5 Food Additives
8.3.5.6 Imaging chemicals and Materials
8.3.6 Historic and Forecasted Market Size by End User
8.3.6.1 Agrochemicals
8.3.6.2 Industrial Processes
8.3.6.3 Construction
8.3.6.4 Automotive
8.3.6.5 Personal Care
8.3.6.6 Textile
8.3.7 Historic and Forecast Market Size by Country
8.3.7.1 Russia
8.3.7.2 Bulgaria
8.3.7.3 The Czech Republic
8.3.7.4 Hungary
8.3.7.5 Poland
8.3.7.6 Romania
8.3.7.7 Rest of Eastern Europe
8.4. Western Europe Performance Chemicals Market
8.4.1 Key Market Trends, Growth Factors and Opportunities
8.4.2 Top Key Companies
8.4.3 Historic and Forecasted Market Size by Segments
8.4.4 Historic and Forecasted Market Size by Type
8.4.4.1 Antioxidants
8.4.4.2 Surfactants
8.4.4.3 Biocides
8.4.5 Historic and Forecasted Market Size by Application
8.4.5.1 Pesticides
8.4.5.2 Advanced Ceramic Materials
8.4.5.3 Cosmetic Chemicals
8.4.5.4 Electronic Chemicals
8.4.5.5 Food Additives
8.4.5.6 Imaging chemicals and Materials
8.4.6 Historic and Forecasted Market Size by End User
8.4.6.1 Agrochemicals
8.4.6.2 Industrial Processes
8.4.6.3 Construction
8.4.6.4 Automotive
8.4.6.5 Personal Care
8.4.6.6 Textile
8.4.7 Historic and Forecast Market Size by Country
8.4.7.1 Germany
8.4.7.2 UK
8.4.7.3 France
8.4.7.4 The Netherlands
8.4.7.5 Italy
8.4.7.6 Spain
8.4.7.7 Rest of Western Europe
8.5. Asia Pacific Performance Chemicals Market
8.5.1 Key Market Trends, Growth Factors and Opportunities
8.5.2 Top Key Companies
8.5.3 Historic and Forecasted Market Size by Segments
8.5.4 Historic and Forecasted Market Size by Type
8.5.4.1 Antioxidants
8.5.4.2 Surfactants
8.5.4.3 Biocides
8.5.5 Historic and Forecasted Market Size by Application
8.5.5.1 Pesticides
8.5.5.2 Advanced Ceramic Materials
8.5.5.3 Cosmetic Chemicals
8.5.5.4 Electronic Chemicals
8.5.5.5 Food Additives
8.5.5.6 Imaging chemicals and Materials
8.5.6 Historic and Forecasted Market Size by End User
8.5.6.1 Agrochemicals
8.5.6.2 Industrial Processes
8.5.6.3 Construction
8.5.6.4 Automotive
8.5.6.5 Personal Care
8.5.6.6 Textile
8.5.7 Historic and Forecast Market Size by Country
8.5.7.1 China
8.5.7.2 India
8.5.7.3 Japan
8.5.7.4 South Korea
8.5.7.5 Malaysia
8.5.7.6 Thailand
8.5.7.7 Vietnam
8.5.7.8 The Philippines
8.5.7.9 Australia
8.5.7.10 New Zealand
8.5.7.11 Rest of APAC
8.6. Middle East & Africa Performance Chemicals Market
8.6.1 Key Market Trends, Growth Factors and Opportunities
8.6.2 Top Key Companies
8.6.3 Historic and Forecasted Market Size by Segments
8.6.4 Historic and Forecasted Market Size by Type
8.6.4.1 Antioxidants
8.6.4.2 Surfactants
8.6.4.3 Biocides
8.6.5 Historic and Forecasted Market Size by Application
8.6.5.1 Pesticides
8.6.5.2 Advanced Ceramic Materials
8.6.5.3 Cosmetic Chemicals
8.6.5.4 Electronic Chemicals
8.6.5.5 Food Additives
8.6.5.6 Imaging chemicals and Materials
8.6.6 Historic and Forecasted Market Size by End User
8.6.6.1 Agrochemicals
8.6.6.2 Industrial Processes
8.6.6.3 Construction
8.6.6.4 Automotive
8.6.6.5 Personal Care
8.6.6.6 Textile
8.6.7 Historic and Forecast Market Size by Country
8.6.7.1 Turkiye
8.6.7.2 Bahrain
8.6.7.3 Kuwait
8.6.7.4 Saudi Arabia
8.6.7.5 Qatar
8.6.7.6 UAE
8.6.7.7 Israel
8.6.7.8 South Africa
8.7. South America Performance Chemicals Market
8.7.1 Key Market Trends, Growth Factors and Opportunities
8.7.2 Top Key Companies
8.7.3 Historic and Forecasted Market Size by Segments
8.7.4 Historic and Forecasted Market Size by Type
8.7.4.1 Antioxidants
8.7.4.2 Surfactants
8.7.4.3 Biocides
8.7.5 Historic and Forecasted Market Size by Application
8.7.5.1 Pesticides
8.7.5.2 Advanced Ceramic Materials
8.7.5.3 Cosmetic Chemicals
8.7.5.4 Electronic Chemicals
8.7.5.5 Food Additives
8.7.5.6 Imaging chemicals and Materials
8.7.6 Historic and Forecasted Market Size by End User
8.7.6.1 Agrochemicals
8.7.6.2 Industrial Processes
8.7.6.3 Construction
8.7.6.4 Automotive
8.7.6.5 Personal Care
8.7.6.6 Textile
8.7.7 Historic and Forecast Market Size by Country
8.7.7.1 Brazil
8.7.7.2 Argentina
8.7.7.3 Rest of SA
Chapter 9 Analyst Viewpoint and Conclusion
9.1 Recommendations and Concluding Analysis
9.2 Potential Market Strategies
Chapter 10 Research Methodology
10.1 Research Process
10.2 Primary Research
10.3 Secondary Research
|
Global Performance Chemicals Market |
|||
|
Base Year: |
2024 |
Forecast Period: |
2025-2032 |
|
Historical Data: |
2018 to 2023 |
Market Size in 2024: |
295.2 Bn. |
|
Forecast Period 2025-32 CAGR: |
6.02% |
Market Size in 2032: |
471.22 Bn. |
|
Segments Covered: |
By Type |
|
|
|
By Application |
|
||
|
By End User |
|
||
|
By Region |
|
||
|
Key Market Drivers: |
|
||
|
Key Market Restraints: |
|
||
|
Key Opportunities: |
|
||
|
Companies Covered in the report: |
|
||


