


Packaged Coconut Water Market Overview
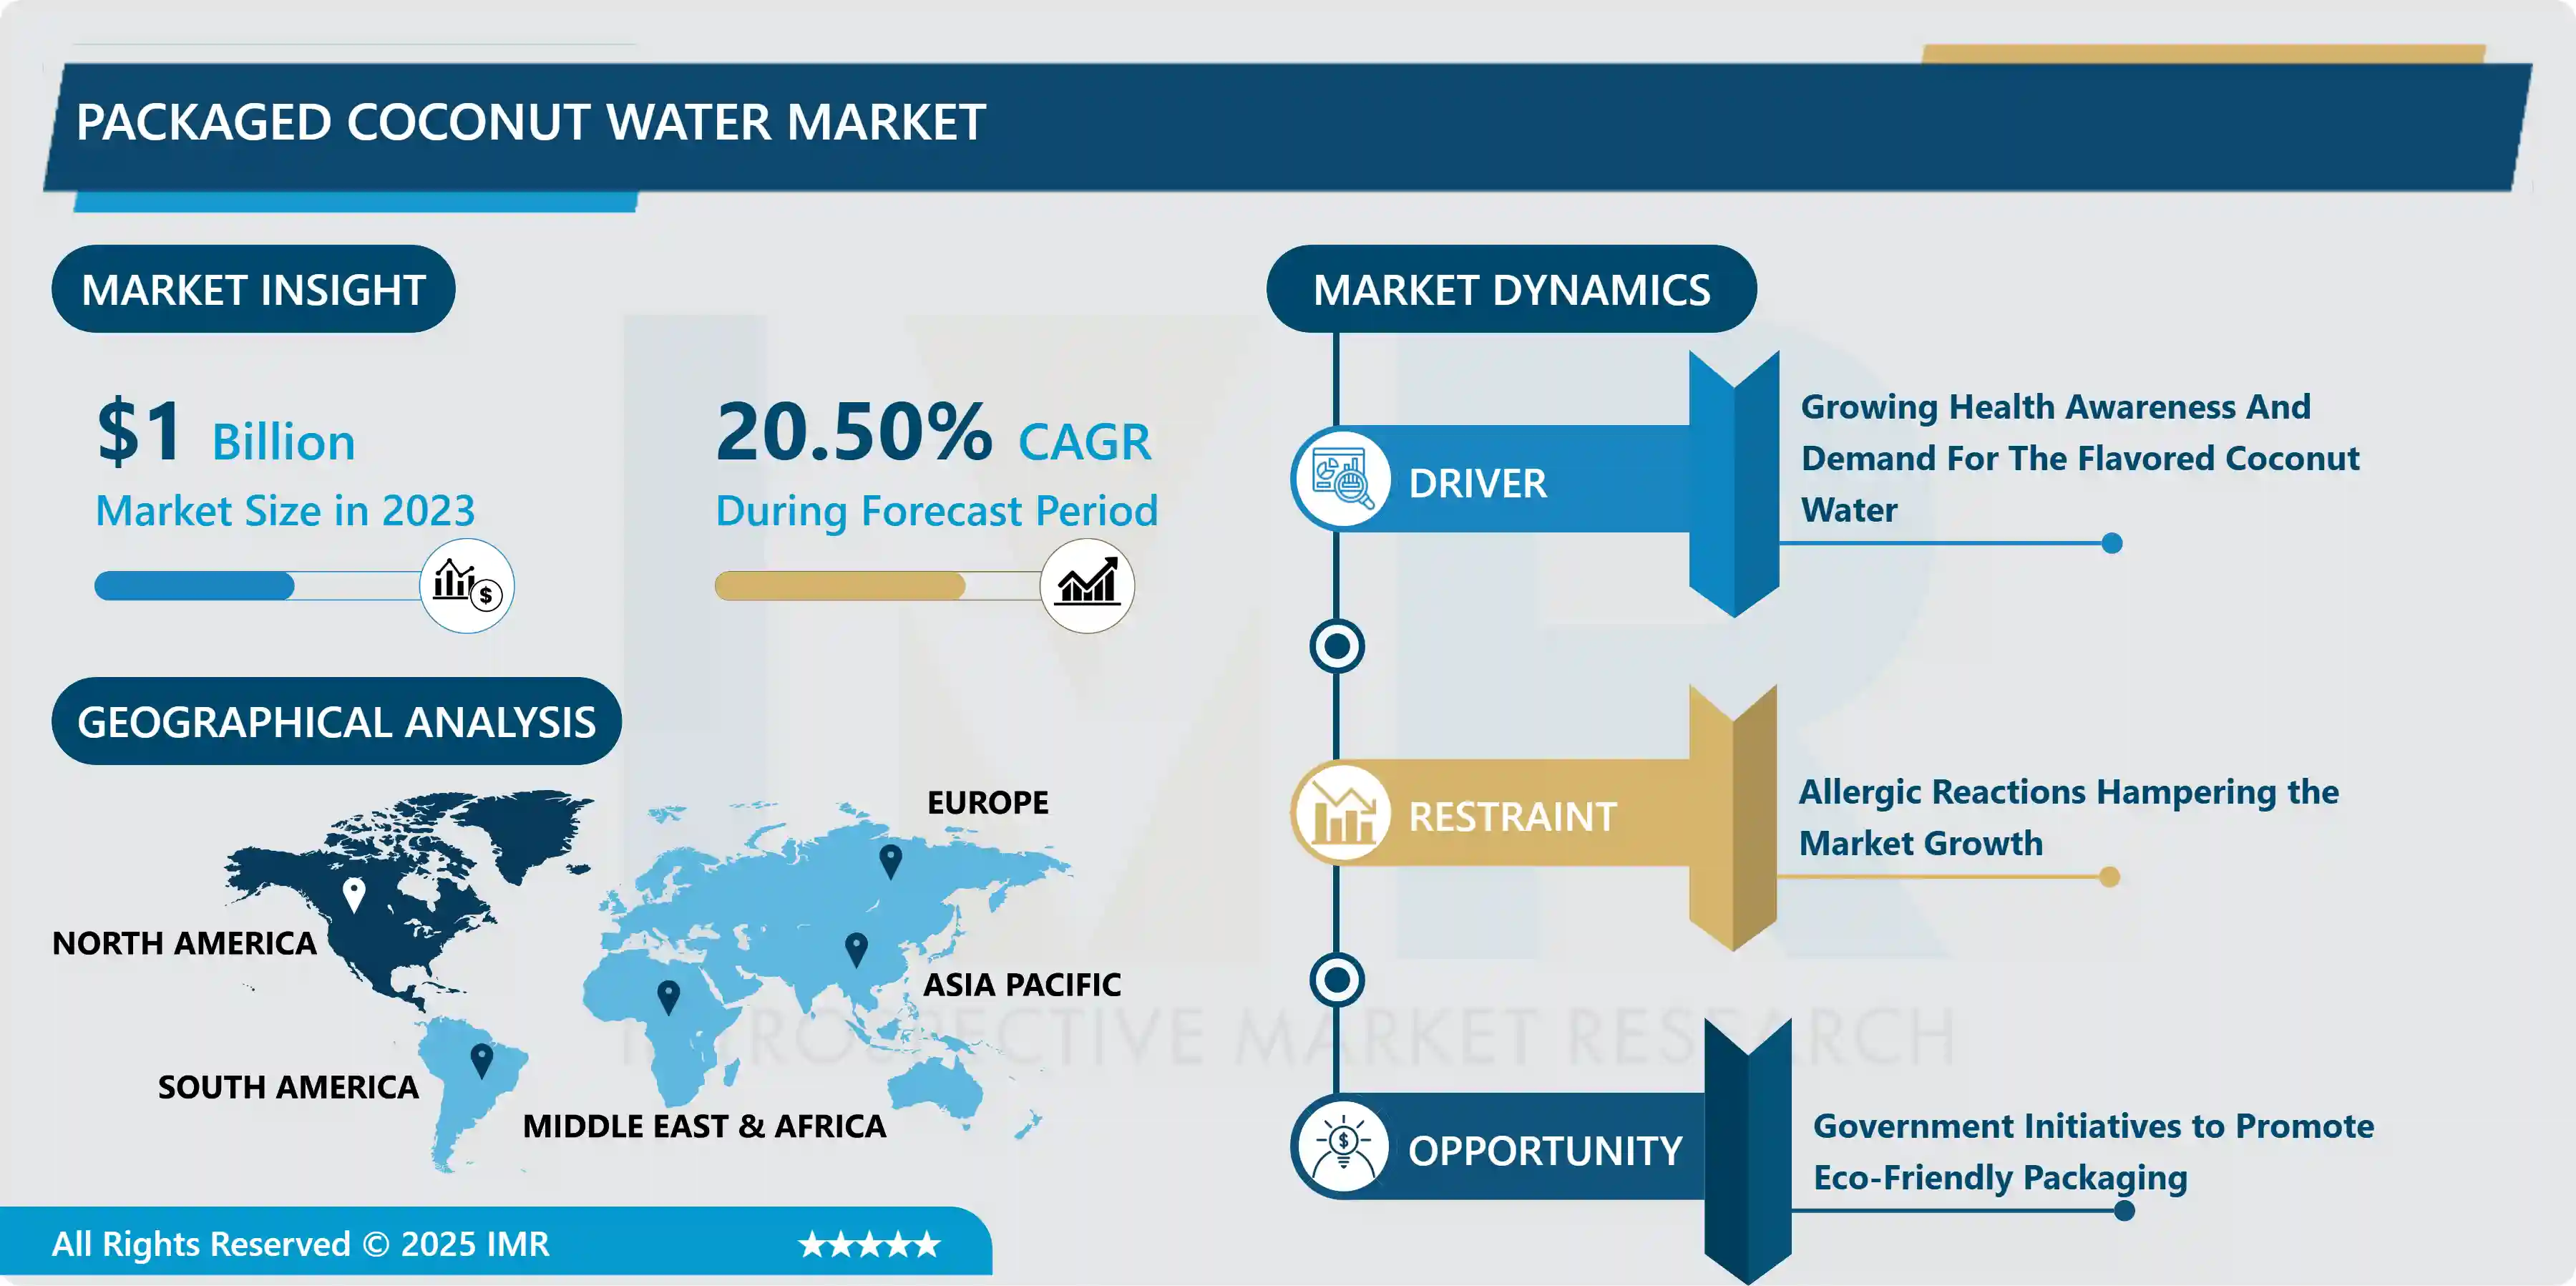
Market Size Was Valued at USD 1.00 Billion in 2023, and is Projected to Reach USD 5.37 Billion by 2032, Growing at a CAGR of 20.5% From 2024-2032.
Coconut water is an excellent option for carbonated beverages due to its great nutritional value. Given the increased acceptability and popularity of coconut water as a healthy drink, it has been advertised as a natural energy or sports drink with low fat, carbs, and calories and a high electrolyte content. Coconut water is a natural isotonic beverage that has the same electrolytic balance as our blood, hence it is often compared to blood plasma.
coconut water contains natural electrolytes, minerals, vitamins, complex carbohydrates, amino acids, and other nutrients. Natural carbohydrate content of the aqueous solution. This makes coconut water ideal for the growing sports drink sector. coconut water contains most minerals, including potassium, sodium, calcium, phosphorus, iron, copper, sulphur, and chlorides. Potassium accounts for more than half of the minerals, and its concentration is significantly impacted by potash manuring. coconut water is high in potassium and other minerals, which helps to enhance urine production. Coconut water is becoming increasingly popular as people become more health conscious and migrate away from carbonated beverages and towards fruit juices.
A growing global need for this item could greatly benefit numerous small farmers in Africa and Asia. To enter the international beverage market, coconut water must undergo thorough processing, packaging, transportation, and storage. Coconut water from young coconuts is seen as a natural and healthy drink option, serving as a good substitute for artificial sports drinks. Although there is limited scientific understanding of this natural resource, its global market is steadily growing. Packaged coconut water is gradually becoming more readily available in various retail outlets worldwide. Consumers are interested in low-sugar beverages at supermarkets because they are easily accessible and convenient. Consequently, the popularity of packaged coconut water has increased.

Market Dynamics And Factors For Packaged Coconut Water Market
Drivers:
Growing Health Awareness And Demand For The Flavored Coconut Water
- The packaged coconut water market is projected to be driven by a rapidly changing retail environment and increased awareness of the health advantages of drinking coconut water. Coconut water in a bottle is mostly consumed as a refreshing drink with a variety of health advantages. Potassium, Sodium, and Calcium, as well as 9.9 milligrams of Vitamin C per 100 gram, are all found in coconut water. Some producers have been accused of making baseless and misleading health benefit claims in the coconut water market in the United States in recent years. The FDA has issued warnings as a result of the slew of complaints and accusations, as well as many class-action lawsuits over misleading advertising claims. People's choices growing health concerns are projected to fuel the bottled coconut water industry. Organic and natural products are becoming increasingly popular. Coconut water is the greatest alternative to high-calorie juices and fizzy beverages because of its health advantages and low-calorie count. To improve product appeal and extend the client base of packaged coconut water around the world, companies are focused on product appearance and packaging attractiveness. Additionally, businesses are attempting to produce bottled coconut water in a variety of flavors. The rising popularity of ready-to-eat foods and expanding urbanization are two main factors driving up demand for packaged goods, which is expected to benefit the packaged coconut water market.
Restraints:
- Coconut water is dangerous for persons with allergies, which harms the market's growth. Coconut water may cause an allergic reaction if you have a fruit or nut allergy. Because coconut is a tree nut, it can increase allergic reactions in people, resulting in disease and, in some cases, death. Furthermore, coconut water has diuretic qualities, so if you drink too much of it, you may find yourself needing to go to the bathroom frequently. This is why you should only drink it in moderation, as it will only hydrate you and give you an energy boost.
Opportunities:
- The market is also benefiting from the rising food and beverage industry. The use of coconut water mix and concentrates in many inventive recipes has increased as a result of the burgeoning café culture and the expanding number of quick-service restaurants (QSRs). Other factors, such as government initiatives to promote eco-friendly packaging and coconut farming, as well as large expenditures in the growth of coconut agriculture, particularly in countries like the Philippines, are expected to boost the market in the future years.
Segmentation Analysis of Packaged Coconut Water Market
- By Packaging Type, the paperboards segment is anticipated to register the maximum packaged coconut water market share over the forecast period. Tetra Pak and other environmentally friendly paperboards have become more popular on the market. Because of their sustainable nature and on-the-go ease, market leaders such as Vita Coco and O.N.E continue to favor them. Paperboards and carton packs are preferred by more than 65 percent of coconut water producers for packaging and distribution. In nations like China, Russia, Brazil, and India, where tetra packs dominate the beverage packaging market, paperboards are the most flavored manner of packaging. With coconut water companies investing in novel flavors and forms, paperboard packaging offers a significant cost-cutting opportunity.
- By Variant, packaged plain coconut water is finding high demand, especially for medical formulations and cosmetics. Coconut water is commonly consumed due to its natural state and adaptability of application for a variety of potential end-users. Unflavored coconut beverages are preferred over flavored coconut drinks since they are lower in calories and contain no preservatives. Flavored coconut water, which is sweetened with appropriate flavors, can be readily marketed as a healthy alternative, increasing popularity among this demographic. Consumer taste in industrialized countries is shifting toward cola and caffeinated goods, therefore flavored health drinks are likely to be on the rise. Sweetened drinks provide suppliers with the opportunity to save money by optimizing the input ingredient composition, which is another important element driving the segment's growth.
- By Nature, the organic segment is expected to hold a significant packaged coconut water market share over the forecast period. People nowadays want organic and natural products. Due to its health benefits and low-calorie count, coconut water is the best alternative to high-calorie juices and fizzy beverages. To boost product appeal and expand the global customer base of packaged coconut water, companies are focusing on product appearance and packaging attractiveness.
- By Distribution Channel, an offline segment is anticipated to hold the packaged coconut water maximum market share throughout the projected period. Since packed coconut drinks have a shelf life of less than a year, efficient distribution and logistical sources are essential. In this area, retailers account for up to 80% of the sales. Supermarkets and hypermarkets are suitable outlets for selling huge quantities of goods for business use. Due to the abundance of retail chains in the North American region, supermarkets have the highest stake. Hypermarkets are also becoming more common in emerging countries like India. Coconut water is also widely available on the internet through e-commerce sites. Due to the quick expansion and penetration of e-shopping among millennials and Gen Z, the channel has acquired traction. Online stores, along with South Korea and Australia, are one of the preferred media of sales for coconut water, maple water, vitamin water, and other beverages in countries like China, where the online grocery market is expected to reach $196 billion by 2023.
Regional Analysis of Packaged Coconut Water Market
- In terms of packaged coconut water consumption, the Asia-Pacific region is predicted to dominate, particularly in China, India, Indonesia, and Australia. Coconut water is regarded as one of the healthiest beverages in Thailand. It's a clear, slightly sweet-tasting beverage made from green coconuts that's both isotonic and high in potassium. This makes it an ideal refresher for restoring the body's nutritional balance after sports, especially among the region's millennial population. Because Asia-Pacific is a major producer of coconut water in the region, the quality of products exported from the country is heavily influenced by the processing processes used by big corporations.
- The rapid movement in customer tastes for healthier options, as well as growing knowledge of the detrimental consequences of sugar-based drinks, is driving the usage of packaged coconut water in North America. The well-developed retail landscape allows product launches and advancements, as well as the presence of multinational food and beverage producers that have recognized the product's potential and invested significantly to expand its availability and reach.
- Due to rising disposable income levels and increased awareness of the benefits of natural products, the European market is expected to grow dramatically. Furthermore, packaged coconut water is gaining popularity among consumers, particularly in Germany, Italy, and the United Kingdom.
Players Covered in Packaged Coconut Market are
- Amy & Brian Naturals
- GraceKennedy Limited
- Green Coco Europe Marketing und Vertriebsgesellschaft mbH
- PepsiCo Inc.
- The Coca-Cola Company
- Jain Agro Food Products Private Limited
- Dabur India Ltd
- Pure Tropic
- C2O Pure Coconut Water LLC
- Blue Monkey
- Harmless Harvest
- Taste Nirvana
- Bai Brands
- Exotic Superfoods
- Del Monte
- Purity Organic LLC and other major players.
Key Industry Developments In Packaged Coconut Water Market
- In March 2024,100 Coconuts, the fastest-growing premium coconut water brand, is excited to announce the launch of its new 16.6-fluid can of 100% Pure Coconut Water, now available on Amazon and select retailers this summer.
- In April 2023, Coconutea is launching a rang of six coconut water categories after identifying a gap in UK market for premium offerings. Describe as super food in the bottle it combines pure coconut water and the green tea, celebrating the green coconut grown in Sri Lanka.
|
Packaged Coconut Water Market |
|||
|
Base Year: |
2023 |
Forecast Period: |
2024-2032 |
|
Historical Data: |
2017 to 2023 |
Market Size in 2023: |
USD 1.00 Bn. |
|
Forecast Period 2024-32 CAGR: |
20.5 % |
Market Size in 2032: |
USD 5.37 Bn. |
|
Segments Covered: |
By Packaging Type |
|
|
|
By Variant |
|
||
|
By Nature |
|
||
|
By Distribution Channel |
|
||
|
By Region |
|
||
|
Key Market Drivers: |
|
||
|
Key Market Restraints: |
|
||
|
Key Opportunities: |
|
||
|
Companies Covered in the report: |
|
||
Chapter 1: Introduction
1.1 Scope and Coverage
Chapter 2:Executive Summary
Chapter 3: Market Landscape
3.1 Market Dynamics
3.1.1 Drivers
3.1.2 Restraints
3.1.3 Opportunities
3.1.4 Challenges
3.2 Market Trend Analysis
3.3 PESTLE Analysis
3.4 Porter's Five Forces Analysis
3.5 Industry Value Chain Analysis
3.6 Ecosystem
3.7 Regulatory Landscape
3.8 Price Trend Analysis
3.9 Patent Analysis
3.10 Technology Evolution
3.11 Investment Pockets
3.12 Import-Export Analysis
Chapter 4: Packaged Coconut Water Market by Packaging Type (2018-2032)
4.1 Packaged Coconut Water Market Snapshot and Growth Engine
4.2 Market Overview
4.3 Paperboards
4.3.1 Introduction and Market Overview
4.3.2 Historic and Forecasted Market Size in Value USD and Volume Units
4.3.3 Key Market Trends, Growth Factors, and Opportunities
4.3.4 Geographic Segmentation Analysis
4.4 Plastic
4.5 Others
Chapter 5: Packaged Coconut Water Market by Variant (2018-2032)
5.1 Packaged Coconut Water Market Snapshot and Growth Engine
5.2 Market Overview
5.3 Plain
5.3.1 Introduction and Market Overview
5.3.2 Historic and Forecasted Market Size in Value USD and Volume Units
5.3.3 Key Market Trends, Growth Factors, and Opportunities
5.3.4 Geographic Segmentation Analysis
5.4 Flavored
Chapter 6: Packaged Coconut Water Market by Nature (2018-2032)
6.1 Packaged Coconut Water Market Snapshot and Growth Engine
6.2 Market Overview
6.3 Organic
6.3.1 Introduction and Market Overview
6.3.2 Historic and Forecasted Market Size in Value USD and Volume Units
6.3.3 Key Market Trends, Growth Factors, and Opportunities
6.3.4 Geographic Segmentation Analysis
6.4 Conventional
Chapter 7: Packaged Coconut Water Market by Distribution Channel (2018-2032)
7.1 Packaged Coconut Water Market Snapshot and Growth Engine
7.2 Market Overview
7.3 Online
7.3.1 Introduction and Market Overview
7.3.2 Historic and Forecasted Market Size in Value USD and Volume Units
7.3.3 Key Market Trends, Growth Factors, and Opportunities
7.3.4 Geographic Segmentation Analysis
7.4 Offline
Chapter 8: Company Profiles and Competitive Analysis
8.1 Competitive Landscape
8.1.1 Competitive Benchmarking
8.1.2 Packaged Coconut Water Market Share by Manufacturer (2024)
8.1.3 Industry BCG Matrix
8.1.4 Heat Map Analysis
8.1.5 Mergers and Acquisitions
8.2 SINCLAIR PHARMA (UK)
8.2.1 Company Overview
8.2.2 Key Executives
8.2.3 Company Snapshot
8.2.4 Role of the Company in the Market
8.2.5 Sustainability and Social Responsibility
8.2.6 Operating Business Segments
8.2.7 Product Portfolio
8.2.8 Business Performance
8.2.9 Key Strategic Moves and Recent Developments
8.2.10 SWOT Analysis
8.3 ALLERGAN (IRELAND)
8.4 MERZ PHARMA (GERMANY)
8.5 SUNEVA MEDICAL (US)
8.6 GALDERMA LABORATORIES (CANADA)
8.7 BIOPLUS CO.LTD. (SOUTH KOREA)
8.8 REVANCE THERAPEUTICS INC (US)
8.9 BIOXIS PHARMACEUTICALS (FRANCE)
8.10 DR. KORMAN (ISRAEL)
8.11 PROLLENIUM MEDICAL TECHNOLOGIES (CANADA)
8.12 ANIKA THERAPEUTICS INC (US)
8.13 SCULPT LUXURY DERMAL FILLERS LTD (CZECHIA REPUBLIC)
8.14 CANDELA CORPORATION (US)
Chapter 9: Global Packaged Coconut Water Market By Region
9.1 Overview
9.2. North America Packaged Coconut Water Market
9.2.1 Key Market Trends, Growth Factors and Opportunities
9.2.2 Top Key Companies
9.2.3 Historic and Forecasted Market Size by Segments
9.2.4 Historic and Forecasted Market Size by Packaging Type
9.2.4.1 Paperboards
9.2.4.2 Plastic
9.2.4.3 Others
9.2.5 Historic and Forecasted Market Size by Variant
9.2.5.1 Plain
9.2.5.2 Flavored
9.2.6 Historic and Forecasted Market Size by Nature
9.2.6.1 Organic
9.2.6.2 Conventional
9.2.7 Historic and Forecasted Market Size by Distribution Channel
9.2.7.1 Online
9.2.7.2 Offline
9.2.8 Historic and Forecast Market Size by Country
9.2.8.1 US
9.2.8.2 Canada
9.2.8.3 Mexico
9.3. Eastern Europe Packaged Coconut Water Market
9.3.1 Key Market Trends, Growth Factors and Opportunities
9.3.2 Top Key Companies
9.3.3 Historic and Forecasted Market Size by Segments
9.3.4 Historic and Forecasted Market Size by Packaging Type
9.3.4.1 Paperboards
9.3.4.2 Plastic
9.3.4.3 Others
9.3.5 Historic and Forecasted Market Size by Variant
9.3.5.1 Plain
9.3.5.2 Flavored
9.3.6 Historic and Forecasted Market Size by Nature
9.3.6.1 Organic
9.3.6.2 Conventional
9.3.7 Historic and Forecasted Market Size by Distribution Channel
9.3.7.1 Online
9.3.7.2 Offline
9.3.8 Historic and Forecast Market Size by Country
9.3.8.1 Russia
9.3.8.2 Bulgaria
9.3.8.3 The Czech Republic
9.3.8.4 Hungary
9.3.8.5 Poland
9.3.8.6 Romania
9.3.8.7 Rest of Eastern Europe
9.4. Western Europe Packaged Coconut Water Market
9.4.1 Key Market Trends, Growth Factors and Opportunities
9.4.2 Top Key Companies
9.4.3 Historic and Forecasted Market Size by Segments
9.4.4 Historic and Forecasted Market Size by Packaging Type
9.4.4.1 Paperboards
9.4.4.2 Plastic
9.4.4.3 Others
9.4.5 Historic and Forecasted Market Size by Variant
9.4.5.1 Plain
9.4.5.2 Flavored
9.4.6 Historic and Forecasted Market Size by Nature
9.4.6.1 Organic
9.4.6.2 Conventional
9.4.7 Historic and Forecasted Market Size by Distribution Channel
9.4.7.1 Online
9.4.7.2 Offline
9.4.8 Historic and Forecast Market Size by Country
9.4.8.1 Germany
9.4.8.2 UK
9.4.8.3 France
9.4.8.4 The Netherlands
9.4.8.5 Italy
9.4.8.6 Spain
9.4.8.7 Rest of Western Europe
9.5. Asia Pacific Packaged Coconut Water Market
9.5.1 Key Market Trends, Growth Factors and Opportunities
9.5.2 Top Key Companies
9.5.3 Historic and Forecasted Market Size by Segments
9.5.4 Historic and Forecasted Market Size by Packaging Type
9.5.4.1 Paperboards
9.5.4.2 Plastic
9.5.4.3 Others
9.5.5 Historic and Forecasted Market Size by Variant
9.5.5.1 Plain
9.5.5.2 Flavored
9.5.6 Historic and Forecasted Market Size by Nature
9.5.6.1 Organic
9.5.6.2 Conventional
9.5.7 Historic and Forecasted Market Size by Distribution Channel
9.5.7.1 Online
9.5.7.2 Offline
9.5.8 Historic and Forecast Market Size by Country
9.5.8.1 China
9.5.8.2 India
9.5.8.3 Japan
9.5.8.4 South Korea
9.5.8.5 Malaysia
9.5.8.6 Thailand
9.5.8.7 Vietnam
9.5.8.8 The Philippines
9.5.8.9 Australia
9.5.8.10 New Zealand
9.5.8.11 Rest of APAC
9.6. Middle East & Africa Packaged Coconut Water Market
9.6.1 Key Market Trends, Growth Factors and Opportunities
9.6.2 Top Key Companies
9.6.3 Historic and Forecasted Market Size by Segments
9.6.4 Historic and Forecasted Market Size by Packaging Type
9.6.4.1 Paperboards
9.6.4.2 Plastic
9.6.4.3 Others
9.6.5 Historic and Forecasted Market Size by Variant
9.6.5.1 Plain
9.6.5.2 Flavored
9.6.6 Historic and Forecasted Market Size by Nature
9.6.6.1 Organic
9.6.6.2 Conventional
9.6.7 Historic and Forecasted Market Size by Distribution Channel
9.6.7.1 Online
9.6.7.2 Offline
9.6.8 Historic and Forecast Market Size by Country
9.6.8.1 Turkiye
9.6.8.2 Bahrain
9.6.8.3 Kuwait
9.6.8.4 Saudi Arabia
9.6.8.5 Qatar
9.6.8.6 UAE
9.6.8.7 Israel
9.6.8.8 South Africa
9.7. South America Packaged Coconut Water Market
9.7.1 Key Market Trends, Growth Factors and Opportunities
9.7.2 Top Key Companies
9.7.3 Historic and Forecasted Market Size by Segments
9.7.4 Historic and Forecasted Market Size by Packaging Type
9.7.4.1 Paperboards
9.7.4.2 Plastic
9.7.4.3 Others
9.7.5 Historic and Forecasted Market Size by Variant
9.7.5.1 Plain
9.7.5.2 Flavored
9.7.6 Historic and Forecasted Market Size by Nature
9.7.6.1 Organic
9.7.6.2 Conventional
9.7.7 Historic and Forecasted Market Size by Distribution Channel
9.7.7.1 Online
9.7.7.2 Offline
9.7.8 Historic and Forecast Market Size by Country
9.7.8.1 Brazil
9.7.8.2 Argentina
9.7.8.3 Rest of SA
Chapter 10 Analyst Viewpoint and Conclusion
10.1 Recommendations and Concluding Analysis
10.2 Potential Market Strategies
Chapter 11 Research Methodology
11.1 Research Process
11.2 Primary Research
11.3 Secondary Research
|
Packaged Coconut Water Market |
|||
|
Base Year: |
2023 |
Forecast Period: |
2024-2032 |
|
Historical Data: |
2017 to 2023 |
Market Size in 2023: |
USD 1.00 Bn. |
|
Forecast Period 2024-32 CAGR: |
20.5 % |
Market Size in 2032: |
USD 5.37 Bn. |
|
Segments Covered: |
By Packaging Type |
|
|
|
By Variant |
|
||
|
By Nature |
|
||
|
By Distribution Channel |
|
||
|
By Region |
|
||
|
Key Market Drivers: |
|
||
|
Key Market Restraints: |
|
||
|
Key Opportunities: |
|
||
|
Companies Covered in the report: |
|
||


