


OLED TV Market Synopsis
Global OLED TV Market Size Was Valued at USD 10.28 Billion In 2023 And Is Projected to Reach USD 45.04 Billion By 2032, Growing at A CAGR of 17.84% From 2024-2032.
OLED TV stands for Organic Light-Emitting Diode Television. It is a type of television display technology that has gained significant popularity in recent years due to its impressive picture quality and unique features.
Unlike traditional LED/LCD TVs that use a backlight to illuminate pixels, OLED TVs use individual organic compounds that emit light when an electric current is applied. This means that each pixel in an OLED TV can independently emit its own light and can be turned on or off individually, resulting in true black levels, infinite contrast ratios, and vibrant, accurate colors.
One of the standout features of OLED TVs is their ability to achieve perfect blacks. When a pixel is turned off, it emits no light, creating absolute darkness in that part of the screen. This leads to unparalleled contrast and makes OLED TVs particularly well-suited for watching movies and playing video games where deep blacks are crucial for an immersive experience.
OLED TVs offer wide viewing angles, which means that the picture quality remains consistent even when viewed from off-center positions, making them great for group viewing. OLED technology is also incredibly thin and allows for flexible and curved display designs, which has enabled TV manufacturers to produce TVs with sleek, ultra-thin profiles.
OLED TVs are generally more expensive than their LED/LCD counterparts, and there have been concerns about the long-term durability of organic materials used in OLED displays. Nevertheless, OLED TVs have carved out a niche in the premium TV market and continue to evolve, offering consumers an excellent choice for an impressive and immersive home entertainment experience.
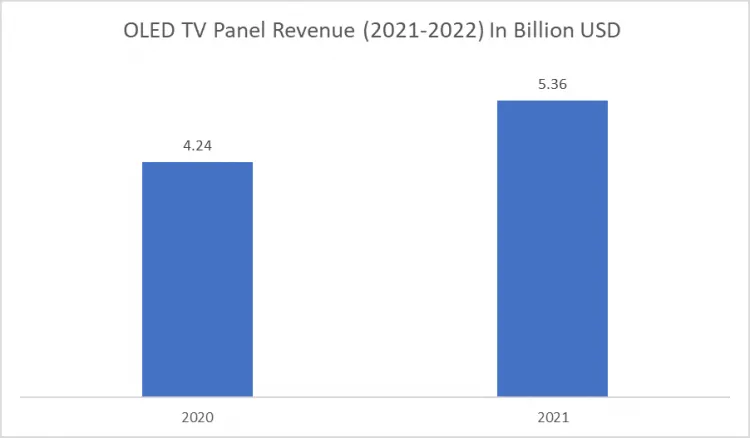
OLED TVs utilize OLED panels as their display technology. These panels consist of organic compounds that emit light when an electric current is applied. Each pixel in an OLED panel emits its light independently. This technology is fundamentally different from traditional LCD (Liquid Crystal Display) TVs, which use backlighting. Thus, the below graph mention that the OELD TV Panel revenue is increases so the OSLD market growth also increases.

The OLED TV Market Trend Analysis
High-demand for cost-effective and energy-saving OLED Lighting
- Lighting accounts for approximately 15% of the world's total energy consumption, with lighting-related activities contributing to roughly 5% of global carbon emissions. To combat these environmental challenges, the United Nations Environment Programme (UNEP) has issued guidance on adopting energy-efficient lighting solutions.
- The rapid urbanization and economic growth observed in Europe and the Middle East are expected to drive a substantial surge in demand for OLED-based lighting over the next two decades.
- Consequently, there is a growing need for increased adoption of LED-based lighting solutions to achieve cost-effective energy savings, which is poised to fuel the global expansion of the OLED lighting market in the coming years.
- The development and production of OLED lighting have led to advancements in OLED technology, making it more cost-effective and efficient. As OLED manufacturers scale up their production to meet the demand for lighting solutions, the economies of scale benefit not only the lighting sector but also OLED TVs. This results in more affordable OLED panels, which, in turn, makes OLED TVs more accessible to a broader consumer base.
Increase In Government Initiatives Towards OLED Adoption
- The adoption of OLED technology in lighting systems has presented a significant opportunity for the OLED TV market, offering cost savings and environmental benefits. Governments across the globe have shown a keen interest in embracing OLED lighting solutions to reduce costs and environmental pollution.
- For instance, Germany's government actively supports municipalities in upgrading their public assets, such as outdated street lighting, with modern OLED lighting through grants and incentives.
- The presence of organizations like the Middle East Lighting Association (MELA) in the Middle Eastern nations further amplifies this opportunity. MELA, a non-profit organization established in collaboration with leading lighting product manufacturers such as Gulf Advanced Lighting, Osram, Philips Lighting, and Tridonic, plays a pivotal role in shaping lighting policies, standards, and regulations across the region.
- Their efforts not only assist lawmakers in developing and enforcing lighting-related guidelines but also promote energy-efficient lighting practices for environmental conservation, human comfort, and consumer safety.
- This growing momentum toward government support and initiatives favoring OLED lighting systems signifies a positive trajectory for the OLED TV market. As more nations embrace OLED technology for lighting, it creates a favorable ecosystem where OLED displays, including TVs, can also benefit from the increased affordability and awareness of OLED technology, potentially expanding their market reach and consumer appeal.
Segmentation Analysis Of The OLED TV Market
OLED TV market segments covers the Technology, Product Type, Display Panel Type, Application. By Type, Active-matrix OLED (AMOLED) segment is Anticipated to Dominate the Market Over the Forecast period.
- Active-Matrix Organic Light-Emitting Diode (AMOLED) is a display technology that has gained widespread popularity in various electronic devices, particularly smartphones and high-end television sets.
- AMOLED displays are known for their vibrant colors, deep blacks, and fast response times. Unlike passive-matrix OLEDs (PMOLEDs), which are primarily used in smaller screens, AMOLEDs are designed for larger and more complex displays, making them suitable for a wide range of applications.
- The key feature that sets AMOLED displays apart is the use of an active matrix of thin-film transistors (TFTs) to control each individual OLED pixel. Each pixel in an AMOLED screen has its own dedicated transistor, which allows for precise control over the brightness and color of that pixel. This active-matrix arrangement results in high-resolution, sharp images, and also enables better power efficiency as compared to PMOLED displays.
- AMOLED displays are known for their flexibility and ability to produce curved and edge displays, which has enabled the creation of innovative smartphone designs and curved TVs. Additionally, AMOLED technology offers excellent viewing angles, meaning that the picture quality remains consistent even when viewed from off-center positions, making it ideal for larger screens like TVs.
Regional Analysis of The OLED TV Market
Asia Pacific is Expected to Dominate the Market Over the Forecast period.
- Asia-Pacific is home to some of the world's largest and most prominent electronics manufacturers, including Samsung, LG, Sony, and Panasonic, who have been at the forefront of OLED TV production. These companies have invested heavily in OLED technology research and development, leading to the creation of cutting-edge OLED TVs with innovative features and exceptional picture quality. Their presence and expertise in the region have positioned Asia-Pacific as a hub for OLED TV manufacturing and innovation.
- The rising affluence and growing middle-class population in many Asia-Pacific countries have resulted in an increased demand for high-end consumer electronics, including OLED TVs. As disposable incomes have risen, consumers in countries like China, South Korea, Japan, and India have shown a strong appetite for premium home entertainment systems, contributing significantly to the OLED TV market's growth.
- Asia-Pacific's vast and diverse consumer base has enabled OLED TV manufacturers to experiment with various screen sizes, form factors, and price points to cater to a wide range of preferences and budgets. This adaptability has been pivotal in capturing a substantial market share in both the high-end and mid-range segments.
- Supportive government policies and incentives in certain Asia-Pacific nations have encouraged the adoption of OLED technology. For instance, initiatives in South Korea and China have boosted OLED manufacturing and research, creating favorable conditions for the OLED TV market to thrive.
Top Key Players Covered in The OLED TV Market
- Acuity Brands (US)
- Kopin Corporation (US)
- Pixelligient Technologies (US)
- Lumiotec (US)
- Emagin Corporation (USA)
- BOE Technology (China)
- LG Display (South Korea)
- Osram (Germany)
- AU Optronics (Taiwan)
- Tianma Microelectronics (China)
- Samsung Electronics (South Korea)
- Universal Display Corporation (New Jersey)
- Royole Corporation (China)
- Konica Minolta Pioneer OLED (Japan)
- China Star Optoelectronics Technology (China)
- JOLED (Japan)
- Raystar Optronics (China)
- Panasonic(Japan)
- Truly International (Hong Kong)
- Visionox (China)
- Winstar Display (Taiwan)
- Wisechip Semiconductor (China), And Other Major Players
Key Industry Developments in the OLED TV Market
- In August 2023, LG Electronics (LG) is launching the world’s first wireless OLED TV, the 97-inch LG SIGNATURE OLED M (model 97M3). The 97M3 is currently available in South Korea, with plans for global rollout to key markets including North America and Europe later this year. Drawing on LG’s technical and design prowess from a decade of OLED innovation, the 97M3 is set to reaffirm the company’s leadership in the ultra-large premium TV segment with the industry’s largest 97-inch OLED screen and the Zero Connect Box, the world’s first wireless solution capable of real-time video and audio transmission at 4K 120Hz.
- In June 2023, Samsung launched a Made in India OLED TV with a Neural Quantum Processor 4K. Samsung OLED TV range consists of two series S95C and S90C. Both series come in three sizes 77-inch, 65-inch and 55-inch starting from INR 169,990.
|
OLED TV Market |
|||
|
Base Year: |
2023 |
Forecast Period: |
2024-2032 |
|
Historical Data: |
2017 to 2023 |
Market Size in 2023: |
USD 10.28 Bn. |
|
Forecast Period 2024-32 CAGR: |
17.84% |
Market Size in 2032: |
USD 45.04 Bn. |
|
Segments Covered: |
By Technology |
|
|
|
By Product Type |
|
||
|
By Display Panel Type |
|
||
|
By Application |
|
||
|
By Region |
|
||
|
Key Market Drivers: |
|
||
|
Key Market Restraints: |
|
||
|
Key Opportunities: |
|
||
|
Companies Covered in the Report: |
|
||
Chapter 1: Introduction
1.1 Scope and Coverage
Chapter 2:Executive Summary
Chapter 3: Market Landscape
3.1 Market Dynamics
3.1.1 Drivers
3.1.2 Restraints
3.1.3 Opportunities
3.1.4 Challenges
3.2 Market Trend Analysis
3.3 PESTLE Analysis
3.4 Porter's Five Forces Analysis
3.5 Industry Value Chain Analysis
3.6 Ecosystem
3.7 Regulatory Landscape
3.8 Price Trend Analysis
3.9 Patent Analysis
3.10 Technology Evolution
3.11 Investment Pockets
3.12 Import-Export Analysis
Chapter 4: OLED TV Market by Technology (2018-2032)
4.1 OLED TV Market Snapshot and Growth Engine
4.2 Market Overview
4.3 Active-matrix OLED (AMOLED)
4.3.1 Introduction and Market Overview
4.3.2 Historic and Forecasted Market Size in Value USD and Volume Units
4.3.3 Key Market Trends, Growth Factors, and Opportunities
4.3.4 Geographic Segmentation Analysis
4.4 Passive-matrix OLED (PAMOLED)
4.5 Foldable OLED
4.6 Others (Transparent OLED
4.7 White OLED)
Chapter 5: OLED TV Market by Product Type (2018-2032)
5.1 OLED TV Market Snapshot and Growth Engine
5.2 Market Overview
5.3 Display
5.3.1 Introduction and Market Overview
5.3.2 Historic and Forecasted Market Size in Value USD and Volume Units
5.3.3 Key Market Trends, Growth Factors, and Opportunities
5.3.4 Geographic Segmentation Analysis
5.4 Lighting
Chapter 6: OLED TV Market by Display Panel Type (2018-2032)
6.1 OLED TV Market Snapshot and Growth Engine
6.2 Market Overview
6.3 Rigid
6.3.1 Introduction and Market Overview
6.3.2 Historic and Forecasted Market Size in Value USD and Volume Units
6.3.3 Key Market Trends, Growth Factors, and Opportunities
6.3.4 Geographic Segmentation Analysis
6.4 Flexible
6.5 Others
Chapter 7: OLED TV Market by Application (2018-2032)
7.1 OLED TV Market Snapshot and Growth Engine
7.2 Market Overview
7.3 Smartphone & Tablet
7.3.1 Introduction and Market Overview
7.3.2 Historic and Forecasted Market Size in Value USD and Volume Units
7.3.3 Key Market Trends, Growth Factors, and Opportunities
7.3.4 Geographic Segmentation Analysis
7.4 Smartwatches & Wearables
7.5 Television
7.6 Digital Signage Systems
7.7 Others
Chapter 8: Company Profiles and Competitive Analysis
8.1 Competitive Landscape
8.1.1 Competitive Benchmarking
8.1.2 OLED TV Market Share by Manufacturer (2024)
8.1.3 Industry BCG Matrix
8.1.4 Heat Map Analysis
8.1.5 Mergers and Acquisitions
8.2 CISCO (US)
8.2.1 Company Overview
8.2.2 Key Executives
8.2.3 Company Snapshot
8.2.4 Role of the Company in the Market
8.2.5 Sustainability and Social Responsibility
8.2.6 Operating Business Segments
8.2.7 Product Portfolio
8.2.8 Business Performance
8.2.9 Key Strategic Moves and Recent Developments
8.2.10 SWOT Analysis
8.3 JUNIPER NETWORKS (US)
8.4 EXTREME NETWORKS (US)
8.5 NETGEAR (US)
8.6 ARUBA (US)
8.7 FORTINET (US)
8.8 CASA SYSTEMS (US)
8.9 BROADCOM (US)
8.10 UBIQUITI NETWORKS (US)
8.11 AT&T (US)
8.12 COM BUSINESS (US)
8.13 IPASS (US)
8.14 CAMBIUM NETWORKS (US)
8.15 ERICSSON (SWEDEN)
8.16 LEVER TECHNOLOGY GROUP (UK)
8.17 REDWAY NETWORKS (UK)
8.18 ORANGE BUSINESS SERVICES (FRANCE)
8.19 ALCATEL-LUCENT ENTERPRISE (FRANCE)
8.20 VODAFONE (UK)
8.21 FON (SPAIN)
8.22 HUAWEI (CHINA)
8.23 PANASONIC (JAPAN)
8.24 FUJITSU (JAPAN)
8.25 D-LINK SYSTEMS (TAIWAN)
8.26 AIRTEL (INDIA)
8.27 SUPERLOOP (AUSTRALIA)
8.28 TELSTRA (AUSTRALIA)
Chapter 9: Global OLED TV Market By Region
9.1 Overview
9.2. North America OLED TV Market
9.2.1 Key Market Trends, Growth Factors and Opportunities
9.2.2 Top Key Companies
9.2.3 Historic and Forecasted Market Size by Segments
9.2.4 Historic and Forecasted Market Size by Technology
9.2.4.1 Active-matrix OLED (AMOLED)
9.2.4.2 Passive-matrix OLED (PAMOLED)
9.2.4.3 Foldable OLED
9.2.4.4 Others (Transparent OLED
9.2.4.5 White OLED)
9.2.5 Historic and Forecasted Market Size by Product Type
9.2.5.1 Display
9.2.5.2 Lighting
9.2.6 Historic and Forecasted Market Size by Display Panel Type
9.2.6.1 Rigid
9.2.6.2 Flexible
9.2.6.3 Others
9.2.7 Historic and Forecasted Market Size by Application
9.2.7.1 Smartphone & Tablet
9.2.7.2 Smartwatches & Wearables
9.2.7.3 Television
9.2.7.4 Digital Signage Systems
9.2.7.5 Others
9.2.8 Historic and Forecast Market Size by Country
9.2.8.1 US
9.2.8.2 Canada
9.2.8.3 Mexico
9.3. Eastern Europe OLED TV Market
9.3.1 Key Market Trends, Growth Factors and Opportunities
9.3.2 Top Key Companies
9.3.3 Historic and Forecasted Market Size by Segments
9.3.4 Historic and Forecasted Market Size by Technology
9.3.4.1 Active-matrix OLED (AMOLED)
9.3.4.2 Passive-matrix OLED (PAMOLED)
9.3.4.3 Foldable OLED
9.3.4.4 Others (Transparent OLED
9.3.4.5 White OLED)
9.3.5 Historic and Forecasted Market Size by Product Type
9.3.5.1 Display
9.3.5.2 Lighting
9.3.6 Historic and Forecasted Market Size by Display Panel Type
9.3.6.1 Rigid
9.3.6.2 Flexible
9.3.6.3 Others
9.3.7 Historic and Forecasted Market Size by Application
9.3.7.1 Smartphone & Tablet
9.3.7.2 Smartwatches & Wearables
9.3.7.3 Television
9.3.7.4 Digital Signage Systems
9.3.7.5 Others
9.3.8 Historic and Forecast Market Size by Country
9.3.8.1 Russia
9.3.8.2 Bulgaria
9.3.8.3 The Czech Republic
9.3.8.4 Hungary
9.3.8.5 Poland
9.3.8.6 Romania
9.3.8.7 Rest of Eastern Europe
9.4. Western Europe OLED TV Market
9.4.1 Key Market Trends, Growth Factors and Opportunities
9.4.2 Top Key Companies
9.4.3 Historic and Forecasted Market Size by Segments
9.4.4 Historic and Forecasted Market Size by Technology
9.4.4.1 Active-matrix OLED (AMOLED)
9.4.4.2 Passive-matrix OLED (PAMOLED)
9.4.4.3 Foldable OLED
9.4.4.4 Others (Transparent OLED
9.4.4.5 White OLED)
9.4.5 Historic and Forecasted Market Size by Product Type
9.4.5.1 Display
9.4.5.2 Lighting
9.4.6 Historic and Forecasted Market Size by Display Panel Type
9.4.6.1 Rigid
9.4.6.2 Flexible
9.4.6.3 Others
9.4.7 Historic and Forecasted Market Size by Application
9.4.7.1 Smartphone & Tablet
9.4.7.2 Smartwatches & Wearables
9.4.7.3 Television
9.4.7.4 Digital Signage Systems
9.4.7.5 Others
9.4.8 Historic and Forecast Market Size by Country
9.4.8.1 Germany
9.4.8.2 UK
9.4.8.3 France
9.4.8.4 The Netherlands
9.4.8.5 Italy
9.4.8.6 Spain
9.4.8.7 Rest of Western Europe
9.5. Asia Pacific OLED TV Market
9.5.1 Key Market Trends, Growth Factors and Opportunities
9.5.2 Top Key Companies
9.5.3 Historic and Forecasted Market Size by Segments
9.5.4 Historic and Forecasted Market Size by Technology
9.5.4.1 Active-matrix OLED (AMOLED)
9.5.4.2 Passive-matrix OLED (PAMOLED)
9.5.4.3 Foldable OLED
9.5.4.4 Others (Transparent OLED
9.5.4.5 White OLED)
9.5.5 Historic and Forecasted Market Size by Product Type
9.5.5.1 Display
9.5.5.2 Lighting
9.5.6 Historic and Forecasted Market Size by Display Panel Type
9.5.6.1 Rigid
9.5.6.2 Flexible
9.5.6.3 Others
9.5.7 Historic and Forecasted Market Size by Application
9.5.7.1 Smartphone & Tablet
9.5.7.2 Smartwatches & Wearables
9.5.7.3 Television
9.5.7.4 Digital Signage Systems
9.5.7.5 Others
9.5.8 Historic and Forecast Market Size by Country
9.5.8.1 China
9.5.8.2 India
9.5.8.3 Japan
9.5.8.4 South Korea
9.5.8.5 Malaysia
9.5.8.6 Thailand
9.5.8.7 Vietnam
9.5.8.8 The Philippines
9.5.8.9 Australia
9.5.8.10 New Zealand
9.5.8.11 Rest of APAC
9.6. Middle East & Africa OLED TV Market
9.6.1 Key Market Trends, Growth Factors and Opportunities
9.6.2 Top Key Companies
9.6.3 Historic and Forecasted Market Size by Segments
9.6.4 Historic and Forecasted Market Size by Technology
9.6.4.1 Active-matrix OLED (AMOLED)
9.6.4.2 Passive-matrix OLED (PAMOLED)
9.6.4.3 Foldable OLED
9.6.4.4 Others (Transparent OLED
9.6.4.5 White OLED)
9.6.5 Historic and Forecasted Market Size by Product Type
9.6.5.1 Display
9.6.5.2 Lighting
9.6.6 Historic and Forecasted Market Size by Display Panel Type
9.6.6.1 Rigid
9.6.6.2 Flexible
9.6.6.3 Others
9.6.7 Historic and Forecasted Market Size by Application
9.6.7.1 Smartphone & Tablet
9.6.7.2 Smartwatches & Wearables
9.6.7.3 Television
9.6.7.4 Digital Signage Systems
9.6.7.5 Others
9.6.8 Historic and Forecast Market Size by Country
9.6.8.1 Turkiye
9.6.8.2 Bahrain
9.6.8.3 Kuwait
9.6.8.4 Saudi Arabia
9.6.8.5 Qatar
9.6.8.6 UAE
9.6.8.7 Israel
9.6.8.8 South Africa
9.7. South America OLED TV Market
9.7.1 Key Market Trends, Growth Factors and Opportunities
9.7.2 Top Key Companies
9.7.3 Historic and Forecasted Market Size by Segments
9.7.4 Historic and Forecasted Market Size by Technology
9.7.4.1 Active-matrix OLED (AMOLED)
9.7.4.2 Passive-matrix OLED (PAMOLED)
9.7.4.3 Foldable OLED
9.7.4.4 Others (Transparent OLED
9.7.4.5 White OLED)
9.7.5 Historic and Forecasted Market Size by Product Type
9.7.5.1 Display
9.7.5.2 Lighting
9.7.6 Historic and Forecasted Market Size by Display Panel Type
9.7.6.1 Rigid
9.7.6.2 Flexible
9.7.6.3 Others
9.7.7 Historic and Forecasted Market Size by Application
9.7.7.1 Smartphone & Tablet
9.7.7.2 Smartwatches & Wearables
9.7.7.3 Television
9.7.7.4 Digital Signage Systems
9.7.7.5 Others
9.7.8 Historic and Forecast Market Size by Country
9.7.8.1 Brazil
9.7.8.2 Argentina
9.7.8.3 Rest of SA
Chapter 10 Analyst Viewpoint and Conclusion
10.1 Recommendations and Concluding Analysis
10.2 Potential Market Strategies
Chapter 11 Research Methodology
11.1 Research Process
11.2 Primary Research
11.3 Secondary Research
|
OLED TV Market |
|||
|
Base Year: |
2023 |
Forecast Period: |
2024-2032 |
|
Historical Data: |
2017 to 2023 |
Market Size in 2023: |
USD 10.28 Bn. |
|
Forecast Period 2024-32 CAGR: |
17.84% |
Market Size in 2032: |
USD 45.04 Bn. |
|
Segments Covered: |
By Technology |
|
|
|
By Product Type |
|
||
|
By Display Panel Type |
|
||
|
By Application |
|
||
|
By Region |
|
||
|
Key Market Drivers: |
|
||
|
Key Market Restraints: |
|
||
|
Key Opportunities: |
|
||
|
Companies Covered in the Report: |
|
||


