


Global Machine Vision Market Overview
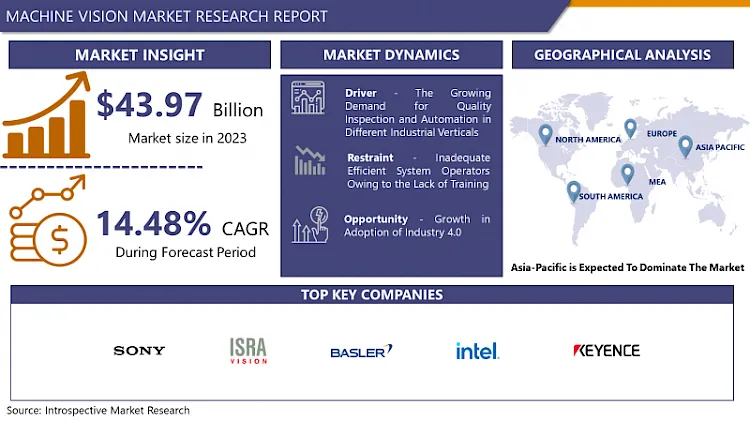
The Global Machine Vision Market size is expected to grow from USD 43.97 billion in 2023 to USD 148.5 billion by 2032, at a CAGR of 14.48% during the forecast period (2024-2032).
Machine vision is referred to as vision system or industrial vision, is a technology used for monitoring all types of machinery processes. It usually consists of different cameras which are installed over the machines depending upon the need so that the entire process can undergo proper vigilance. These cameras are fixed to perform the task of capturing and interpreting along with providing a signal as per the requirements. In addition, machine vision technology works by the precise coordination of software, hardware, and services. Machine vision is currently offering numerous benefits to organizations such as improving quality, rising productivity, decreasing floor space, declining production costs, increasing production flexibility, lowering capital equipment costs, and others. Moreover, as per the Automated Imaging Association (AIA), machine vision bounded all industrial and non-industrial applications in which a combination of hardware and software provide operational guidance to devices in the implementation of their functions based on the capture and processing of images.
Though industrial computer vision uses several of the same algorithms and approaches as academic/educational and governmental/military applications of computer vision, constraints are different. Furthermore, a machine vision system for part identification and identification reads barcodes (1-D), data matrix codes (2-D), direct part marks (DPM), and characters printed on parts, labels, and packages. An optical character recognition (OCR) system reads alphanumeric characters without earlier knowledge, whereas an optical character verification (OCV) system authenticates the presence of a character string. Additionally, machine vision systems can determine parts by locating a unique pattern or identifying items based on shape, or size color. An increase in demand for industrial applications and growth in demand for vision-guided robotics systems are the key factors that enhance the global machine vision system market growth during the forecast period.

Market Dynamics And Factors For The Machine Vision Market
Drivers:
The growing demand for quality inspection and automation in different industrial verticals is probably to turn the market for machine vision. In addition, the requirement for vision-guided robotic systems over the automotive, food and beverage, pharmaceutical and chemical, and packaging segments is anticipated to accelerate the machine vision market growth. The surge in demand for application-oriented machine vision (MV) systems is also anticipated to improve the adoption of the technology over the forecast period. MV systems involve the ability of a computer to observe, inspect, and scrutinize the work performance by utilizing one or more video cameras, digital signal processing, and analog to digital conversion. The captured data is then transferred to the computer to analyze and offer the desired output. Resolution and sensitivity are two important aspects of any MV system. Resolution is responsible for differentiating between objects whereas sensitivity is the machine's ability to detect objects or weak impulses despite dim lights or invisible wavelengths. The intensifying requirement for superior inspection and rising automation are the major impacting factors paving the way for the notable adoption of machine vision technology. Moreover, the need for increased quality control among consumers and manufacturers, coupled with the government regulations to abide by the prescribed specifications, is anticipated to propel the adoption of machine vision technology. The technology is reaching significant traction over food and packaging, automotive, pharmaceutical, and other industrial verticals due to abilities such as advanced detection of objects, improved analysis, monitoring tolerance, and accurate component measuring. All these factors are anticipated to boost the machine vision market growth over the forecast period.
Restraints:
Inadequate efficient system operators owing to the lack of training is probably to occlude the smooth growth of the machine vision market. Furthermore, aiding the risk of cyber-attacks on industrial machine robots and devices. Usernames and passwords unchanged from the factory defaults can also work as threats or glitches in the software, which can be identified through reverse engineering. The rising reliance on connectivity and IoT devices such as AI implanted devices increases vulnerability to cyberattacks.
Opportunities:
An increase in demand for AI and growth in adoption of industry 4.0 is anticipated to create lucrative machine vision system market opportunities globally in the upcoming years.
Market Segmentation
Segmentation Analysis of Machine Vision Market:
Based on the Offering, the hardware segment is anticipated to dominate the machine vision market over the forecast period. Hardware components comprise many objects such as cameras, optics/lenses, LED lightings, frame grabbers, and processors. Cameras captured the maximum share in 2020, which is attributed to the rising demand for CMOS imaging sensors. This, in turn, is expected to result in the growth of the hardware sub-segment.
Based on the Product, PC based segment is expected to capture maximum machine vision market share over the forecast period. PC-based systems dominate the market as PC-based machine vision systems have higher processing power than smart camera-based systems and can handle complex operations relatively quickly. Also, unlike smart camera-based systems, PC-based machine vision systems are highly scalable, and one can swap the components easily.
Based on the Application, the market has been classified into quality assurance and inspection, positioning and guidance, measurement, and identification. The systems are highly utilized for scanning and identifying labels, texts, and barcodes, especially in the packaging sector. This automates packaging activities, thereby saving time, avoiding human errors, and rising efficiency. The technology is frequently used in the consumer goods, pharmaceutical, and packaging sectors. The adoption of technology in these sectors has resulted in reduced counterfeit products to a large extent, eventually driving the overall machine vision market.
Based on the End-Use Industry, the automotive segment is expected to register the largest machine vision market share during the forecast period. The automotive industry is the higher adopter of machine vision systems globally and is expected to expand at a steady growth rate over the forecast period. Machine vision in the automotive industry is highly used for inspection purposes, which include presence-absence checking, error proofing, assembly verification, and final inspection.
Regional Analysis of Machine Vision Market:
The Asia Pacific region is expected to observe considerable growth over the forecasted period. This can be approved to the lucrative opportunities in pharmaceutical, automotive, packaging, and other industrial applications in the Asia Pacific region. Economies such as China, Japan, and South Korea are anticipated to be the major contributors to the market in APAC. Increased manufacturing operations contribute mainly to the economic development in China, while the growing demand to incorporate Industry 4.0 and developed production techniques for rising automation across different applications in India is contributing to the extreme growth of machine vision in APAC. Additionally, vigorous competition among consumer electronics companies in APAC is probably to improve the adoption of machine vision systems in the region.
Players Covered in Machine Vision market are :
- Cognex Corporation (US)
- Basler AG (Germany)
- Omron Corporation (Japan)
- National Instrument Corporation (US)
- Keyence Corporation (Japan)
- Teledyne Technologies (US)
- Sick AG (Germany)
- TKH Group (Netherlands)
- Sony Corporation (Japan)
- Texas Instruments Incorporated (US)
- Intel Corporation (US)
- Atlas Copco (Sweden)
- Microsoft (US)
Key Industry Developments In The Machine Vision Market
- In November 2023, Oxford Metrics acquired Industrial Vision Systems Ltd. (IVS), a developer of machine vision software and systems, for $9.9 million. IVS's noncontact vision systems, powered by AI deep learning, are used for automated production processes for high-precision quality control, inspection, guidance, identification, measurement, tracking, and counting. This acquisition will expand Oxford Metrics' smart sensing capabilities into the manufacturing industry.
- In October 2023, Smart Vision Lights launched the JWL150-DO Lightgistics Series light with Hidden Strobe technology, which delivers strobe-like lighting without the disorientation caused by traditional LED strobe lights. This technology helps high-speed machine vision systems capture clear images without affecting workers. Additionally, Lightgistics lights feature Dual OverDriveTM technology for accurate barcode reading and OCR in challenging applications.
|
Global Machine Vision Market |
|||
|
Base Year: |
2023 |
Forecast Period: |
2024-2032 |
|
Historical Data: |
2017 to 2023 |
Market Size in 2023: |
USD 43.97 Bn. |
|
Forecast Period 2024-32 CAGR: |
14.48% |
Market Size in 2032: |
USD 148.5 Bn. |
|
Segments Covered: |
By Offering |
|
|
|
By Product |
|
||
|
By Application |
|
||
|
By End-Use Industry |
|
||
|
By Region |
|
||
|
Key Market Drivers: |
|
||
|
Key Market Restraints: |
|
||
|
Key Opportunities: |
|
||
|
Companies Covered in the report: |
|
||
1.1 Scope and Coverage
Chapter 2:Executive Summary
Chapter 3: Market Landscape
3.1 Market Dynamics
3.1.1 Drivers
3.1.2 Restraints
3.1.3 Opportunities
3.1.4 Challenges
3.2 Market Trend Analysis
3.3 PESTLE Analysis
3.4 Porter's Five Forces Analysis
3.5 Industry Value Chain Analysis
3.6 Ecosystem
3.7 Regulatory Landscape
3.8 Price Trend Analysis
3.9 Patent Analysis
3.10 Technology Evolution
3.11 Investment Pockets
3.12 Import-Export Analysis
Chapter 4: Machine Vision Market by Offering (2018-2032)
4.1 Machine Vision Market Snapshot and Growth Engine
4.2 Market Overview
4.3 Hardware
4.3.1 Introduction and Market Overview
4.3.2 Historic and Forecasted Market Size in Value USD and Volume Units
4.3.3 Key Market Trends, Growth Factors, and Opportunities
4.3.4 Geographic Segmentation Analysis
4.4 Software
4.5 Services
Chapter 5: Machine Vision Market by Product (2018-2032)
5.1 Machine Vision Market Snapshot and Growth Engine
5.2 Market Overview
5.3 PC Based
5.3.1 Introduction and Market Overview
5.3.2 Historic and Forecasted Market Size in Value USD and Volume Units
5.3.3 Key Market Trends, Growth Factors, and Opportunities
5.3.4 Geographic Segmentation Analysis
5.4 Smart Camera Based
Chapter 6: Machine Vision Market by Application (2018-2032)
6.1 Machine Vision Market Snapshot and Growth Engine
6.2 Market Overview
6.3 Positioning & Guidance
6.3.1 Introduction and Market Overview
6.3.2 Historic and Forecasted Market Size in Value USD and Volume Units
6.3.3 Key Market Trends, Growth Factors, and Opportunities
6.3.4 Geographic Segmentation Analysis
6.4 Predictive Maintenance
6.5 Quality Assurance & Inspection
6.6 Measurement
6.7 Identification
Chapter 7: Machine Vision Market by End-Use Industry (2018-2032)
7.1 Machine Vision Market Snapshot and Growth Engine
7.2 Market Overview
7.3 Automotive
7.3.1 Introduction and Market Overview
7.3.2 Historic and Forecasted Market Size in Value USD and Volume Units
7.3.3 Key Market Trends, Growth Factors, and Opportunities
7.3.4 Geographic Segmentation Analysis
7.4 Food & Beverage
7.5 Packaging & Bottling
7.6 Pharmaceuticals & Chemicals
7.7 Others
Chapter 8: Company Profiles and Competitive Analysis
8.1 Competitive Landscape
8.1.1 Competitive Benchmarking
8.1.2 Machine Vision Market Share by Manufacturer (2024)
8.1.3 Industry BCG Matrix
8.1.4 Heat Map Analysis
8.1.5 Mergers and Acquisitions
8.2 ABB LTD. (SWITZERLAND)
8.2.1 Company Overview
8.2.2 Key Executives
8.2.3 Company Snapshot
8.2.4 Role of the Company in the Market
8.2.5 Sustainability and Social Responsibility
8.2.6 Operating Business Segments
8.2.7 Product Portfolio
8.2.8 Business Performance
8.2.9 Key Strategic Moves and Recent Developments
8.2.10 SWOT Analysis
8.3 KUKA AG (GERMANY)
8.4 KION GROUP AG (GERMANY)
8.5 DAIFUKU (JAPAN)
8.6 FANUC CORPORATION (JAPAN)
8.7 GEEKPLUS TECHNOLOGY (CHINA)
8.8 GREYORANGE PTE. LTD. (US)
8.9 MURATA MACHINERY LTD. (JAPAN)
8.10 OMRON CORPORATION (JAPAN)
8.11 TOYOTA INDUSTRIES CORPORATION (JAPAN)
8.12 SHOPIFY INC. (CANADA)
8.13 HIKROBOT (CHINA)
8.14 IAM ROBOTICS (US)
8.15 INVIA ROBOTICS INC. (US)
8.16 JBT (US)
8.17 KNAPP AG (AUSTRIA)
8.18 LOCUS ROBOTICS (US)
8.19 MAGAZINO GMBH (GERMANY)
8.20 SCALLOG (FRANCE)
8.21 SHANGHAI QUICKTRON INTELLIGENT TECHNOLOGY CO. LTD. (CHINA)
8.22 SSI SCHAEFER AG (GERMANY)
8.23 TERADYNE INC. (US)
8.24 VECNA ROBOTICS (US)
8.25 YASKAWA ELECTRIC CORPORATION (JAPAN)
8.26 AND ZEBRA TECHNOLOGIES CORP. (US)
Chapter 9: Global Machine Vision Market By Region
9.1 Overview
9.2. North America Machine Vision Market
9.2.1 Key Market Trends, Growth Factors and Opportunities
9.2.2 Top Key Companies
9.2.3 Historic and Forecasted Market Size by Segments
9.2.4 Historic and Forecasted Market Size by Offering
9.2.4.1 Hardware
9.2.4.2 Software
9.2.4.3 Services
9.2.5 Historic and Forecasted Market Size by Product
9.2.5.1 PC Based
9.2.5.2 Smart Camera Based
9.2.6 Historic and Forecasted Market Size by Application
9.2.6.1 Positioning & Guidance
9.2.6.2 Predictive Maintenance
9.2.6.3 Quality Assurance & Inspection
9.2.6.4 Measurement
9.2.6.5 Identification
9.2.7 Historic and Forecasted Market Size by End-Use Industry
9.2.7.1 Automotive
9.2.7.2 Food & Beverage
9.2.7.3 Packaging & Bottling
9.2.7.4 Pharmaceuticals & Chemicals
9.2.7.5 Others
9.2.8 Historic and Forecast Market Size by Country
9.2.8.1 US
9.2.8.2 Canada
9.2.8.3 Mexico
9.3. Eastern Europe Machine Vision Market
9.3.1 Key Market Trends, Growth Factors and Opportunities
9.3.2 Top Key Companies
9.3.3 Historic and Forecasted Market Size by Segments
9.3.4 Historic and Forecasted Market Size by Offering
9.3.4.1 Hardware
9.3.4.2 Software
9.3.4.3 Services
9.3.5 Historic and Forecasted Market Size by Product
9.3.5.1 PC Based
9.3.5.2 Smart Camera Based
9.3.6 Historic and Forecasted Market Size by Application
9.3.6.1 Positioning & Guidance
9.3.6.2 Predictive Maintenance
9.3.6.3 Quality Assurance & Inspection
9.3.6.4 Measurement
9.3.6.5 Identification
9.3.7 Historic and Forecasted Market Size by End-Use Industry
9.3.7.1 Automotive
9.3.7.2 Food & Beverage
9.3.7.3 Packaging & Bottling
9.3.7.4 Pharmaceuticals & Chemicals
9.3.7.5 Others
9.3.8 Historic and Forecast Market Size by Country
9.3.8.1 Russia
9.3.8.2 Bulgaria
9.3.8.3 The Czech Republic
9.3.8.4 Hungary
9.3.8.5 Poland
9.3.8.6 Romania
9.3.8.7 Rest of Eastern Europe
9.4. Western Europe Machine Vision Market
9.4.1 Key Market Trends, Growth Factors and Opportunities
9.4.2 Top Key Companies
9.4.3 Historic and Forecasted Market Size by Segments
9.4.4 Historic and Forecasted Market Size by Offering
9.4.4.1 Hardware
9.4.4.2 Software
9.4.4.3 Services
9.4.5 Historic and Forecasted Market Size by Product
9.4.5.1 PC Based
9.4.5.2 Smart Camera Based
9.4.6 Historic and Forecasted Market Size by Application
9.4.6.1 Positioning & Guidance
9.4.6.2 Predictive Maintenance
9.4.6.3 Quality Assurance & Inspection
9.4.6.4 Measurement
9.4.6.5 Identification
9.4.7 Historic and Forecasted Market Size by End-Use Industry
9.4.7.1 Automotive
9.4.7.2 Food & Beverage
9.4.7.3 Packaging & Bottling
9.4.7.4 Pharmaceuticals & Chemicals
9.4.7.5 Others
9.4.8 Historic and Forecast Market Size by Country
9.4.8.1 Germany
9.4.8.2 UK
9.4.8.3 France
9.4.8.4 The Netherlands
9.4.8.5 Italy
9.4.8.6 Spain
9.4.8.7 Rest of Western Europe
9.5. Asia Pacific Machine Vision Market
9.5.1 Key Market Trends, Growth Factors and Opportunities
9.5.2 Top Key Companies
9.5.3 Historic and Forecasted Market Size by Segments
9.5.4 Historic and Forecasted Market Size by Offering
9.5.4.1 Hardware
9.5.4.2 Software
9.5.4.3 Services
9.5.5 Historic and Forecasted Market Size by Product
9.5.5.1 PC Based
9.5.5.2 Smart Camera Based
9.5.6 Historic and Forecasted Market Size by Application
9.5.6.1 Positioning & Guidance
9.5.6.2 Predictive Maintenance
9.5.6.3 Quality Assurance & Inspection
9.5.6.4 Measurement
9.5.6.5 Identification
9.5.7 Historic and Forecasted Market Size by End-Use Industry
9.5.7.1 Automotive
9.5.7.2 Food & Beverage
9.5.7.3 Packaging & Bottling
9.5.7.4 Pharmaceuticals & Chemicals
9.5.7.5 Others
9.5.8 Historic and Forecast Market Size by Country
9.5.8.1 China
9.5.8.2 India
9.5.8.3 Japan
9.5.8.4 South Korea
9.5.8.5 Malaysia
9.5.8.6 Thailand
9.5.8.7 Vietnam
9.5.8.8 The Philippines
9.5.8.9 Australia
9.5.8.10 New Zealand
9.5.8.11 Rest of APAC
9.6. Middle East & Africa Machine Vision Market
9.6.1 Key Market Trends, Growth Factors and Opportunities
9.6.2 Top Key Companies
9.6.3 Historic and Forecasted Market Size by Segments
9.6.4 Historic and Forecasted Market Size by Offering
9.6.4.1 Hardware
9.6.4.2 Software
9.6.4.3 Services
9.6.5 Historic and Forecasted Market Size by Product
9.6.5.1 PC Based
9.6.5.2 Smart Camera Based
9.6.6 Historic and Forecasted Market Size by Application
9.6.6.1 Positioning & Guidance
9.6.6.2 Predictive Maintenance
9.6.6.3 Quality Assurance & Inspection
9.6.6.4 Measurement
9.6.6.5 Identification
9.6.7 Historic and Forecasted Market Size by End-Use Industry
9.6.7.1 Automotive
9.6.7.2 Food & Beverage
9.6.7.3 Packaging & Bottling
9.6.7.4 Pharmaceuticals & Chemicals
9.6.7.5 Others
9.6.8 Historic and Forecast Market Size by Country
9.6.8.1 Turkiye
9.6.8.2 Bahrain
9.6.8.3 Kuwait
9.6.8.4 Saudi Arabia
9.6.8.5 Qatar
9.6.8.6 UAE
9.6.8.7 Israel
9.6.8.8 South Africa
9.7. South America Machine Vision Market
9.7.1 Key Market Trends, Growth Factors and Opportunities
9.7.2 Top Key Companies
9.7.3 Historic and Forecasted Market Size by Segments
9.7.4 Historic and Forecasted Market Size by Offering
9.7.4.1 Hardware
9.7.4.2 Software
9.7.4.3 Services
9.7.5 Historic and Forecasted Market Size by Product
9.7.5.1 PC Based
9.7.5.2 Smart Camera Based
9.7.6 Historic and Forecasted Market Size by Application
9.7.6.1 Positioning & Guidance
9.7.6.2 Predictive Maintenance
9.7.6.3 Quality Assurance & Inspection
9.7.6.4 Measurement
9.7.6.5 Identification
9.7.7 Historic and Forecasted Market Size by End-Use Industry
9.7.7.1 Automotive
9.7.7.2 Food & Beverage
9.7.7.3 Packaging & Bottling
9.7.7.4 Pharmaceuticals & Chemicals
9.7.7.5 Others
9.7.8 Historic and Forecast Market Size by Country
9.7.8.1 Brazil
9.7.8.2 Argentina
9.7.8.3 Rest of SA
Chapter 10 Analyst Viewpoint and Conclusion
10.1 Recommendations and Concluding Analysis
10.2 Potential Market Strategies
Chapter 11 Research Methodology
11.1 Research Process
11.2 Primary Research
11.3 Secondary Research
|
Global Machine Vision Market |
|||
|
Base Year: |
2023 |
Forecast Period: |
2024-2032 |
|
Historical Data: |
2017 to 2023 |
Market Size in 2023: |
USD 43.97 Bn. |
|
Forecast Period 2024-32 CAGR: |
14.48% |
Market Size in 2032: |
USD 148.5 Bn. |
|
Segments Covered: |
By Offering |
|
|
|
By Product |
|
||
|
By Application |
|
||
|
By End-Use Industry |
|
||
|
By Region |
|
||
|
Key Market Drivers: |
|
||
|
Key Market Restraints: |
|
||
|
Key Opportunities: |
|
||
|
Companies Covered in the report: |
|
||
Frequently Asked Questions :
The forecast period in the Machine Vision Market research report is 2024-2032.
Sony Corporation (Japan), ISRA Vision (Germany), Basler AG (Germany), Intel Corporation (US), Omron Corporation (Japan), Keyence (Japan), National Instruments (US), Teledyne Technologies (US), Cognex Corporation (US), Texas Instruments (US), Sick AG (Germany), FLIR Systems (US), and other major players.
The Machine Vision Market is segmented into offering, product, application, end-use industry, and region. By Offering, the market is categorized into Hardware, Software, and Services. By Product, the market is categorized into PC Based and Smart Camera Based. By Application, the market is categorized into Positioning & Guidance, Predictive Maintenance, Quality Assurance & Inspection, Measurement, and Identification. By End-Use Industry, the market is categorized into Automotive, Food & Beverage, Packaging & Bottling, Pharmaceuticals & Chemicals, and Others. By region, it is analyzed across North America (U.S.; Canada; Mexico), Europe (Germany; U.K.; France; Italy; Russia; Spain, etc.), Asia-Pacific (China; India; Japan; Southeast Asia, etc.), South America (Brazil; Argentina, etc.), Middle East & Africa (Saudi Arabia; South Africa, etc.).
Machine vision is referred to as vision system or industrial vision, is a technology used for monitoring all types of machinery processes. It usually consists of different cameras which are installed over the machines depending upon the need so that the entire process can undergo proper vigilance
The Global Machine Vision Market size is expected to grow from USD 43.97 billion in 2023 to USD 148.5 billion by 2032, at a CAGR of 14.48% during the forecast period (2024-2032).


