


Live Chat Software Market Synopsis
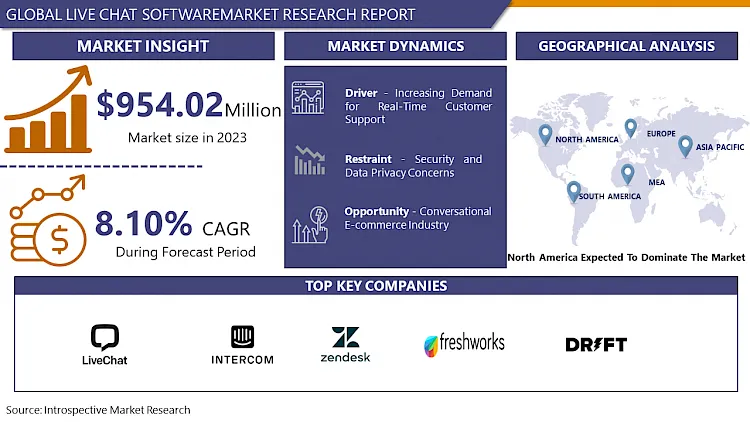
Live Chat Software Market Size Was Valued at USD 1031.3 million in 2024 and is Projected to Reach USD 1923.05 million by 2032, Growing at a CAGR of 8.10 % from 2025-2032.
Live chat software is a type of service that allows immediate and quick customer support along with information. It acts as an instant messenger where the customers can communicate in real time. Live chat support can promptly and conveniently answer customer inquiries that can bump up the company’s website. In this fast-paced digital era, customers look for convenience and rapid results. Hence, adapting to this dynamic environment and trend and providing swift and speedy solutions set End users apart from their competitors. Most research in the industry shows customers appreciate the timely and available support.
Integrating live chat into websites is becoming increasingly common across industries. It aims to provide quick responses to customers and thereby improve sales and also promote customer loyalty towards the organization. In addition to shopping platforms such as tourism and hospitality, education, medical professionals, the automotive industry, the real estate industry, IT solution providers, airlines, and web hosting companies are also actively using it as an integral part of their daily operations.
Live chat software is a valuable tool for businesses, enhancing customer engagement and communication. With an average response time of 23 seconds, it reduces wait times and boosts sales. It's cost-effective, 17-30% cheaper than phone calls, and Live chat addresses customer pain points with personalized resolutions and quick access to promotions or product inquiries. It prevents 42% of US consumers from abandoning online transactions due to delayed responses. It also boosts customer satisfaction by 90% and expands market reach by facilitating easy contact for international customers.
Live chat receives 73% satisfaction levels for any customer service channel. It gets the highest rating compared to email at 61% and phone at 44%. Moreover, the American Marketing Association found an average increase of 20% in conversions for B2B companies using live chat. In a separate research by Forbes, 92% of customers feel satisfied when using the live chat feature compared to other communication channels including voice (88%), email (85%), and web form (85%). Meanwhile, social media platforms such as Facebook and Twitter got 84% and 77%, respectively.
.webp)
Live Chat Software Market Trend Analysis
Increasing Demand for Real-Time Customer Support
- Online customers are increasingly seeking social interaction, and the Internet has become a crucial medium for businesses to communicate with customers. Advancements in technology and high internet speeds enable businesses to provide live communication channels with sales representatives. The increased use of online sales representatives on websites demonstrates the importance of quality customer support. Businesses are now recognizing the need for immediate assistance, with live chat software enabling companies to promptly resolve customer queries, leading to increased satisfaction and retention.
- Live chat software is revolutionizing customer engagement by allowing companies to interact with customers in real-time through messaging on their websites. Platforms like Timelines.ai are leading the live chat revolution with innovative features tailored to modern support needs.
- This technology reshapes customer service, leading to happier customers and more efficient operations. Live chat software offers real-time interaction capabilities that significantly enhance customer experience. It also allows for effective email communication, with 79% of customers preferring it for its immediacy.
- Companies using live chat see a 48% increase in revenue per chat hour and a 40% increase in conversion rates. Agents can personalize their services, enhancing customer experience and accessibility. Live chat also provides valuable data for product and service improvements, shaping business strategies to meet customer needs more effectively.
Conversational E-commerce Industry
- The e-commerce industry is rapidly expanding, leading to the rise of live chat software for instant customer support. This technology enhances the shopping experience by resolving product inquiries, assisting with orders, and real-time troubleshooting.
- With the rise of messaging apps and social commerce, businesses are using chatbots to facilitate transactions, offer personalized product recommendations, and provide efficient customer support. Integrating live chat software into e-commerce platforms streamlines communication and fosters engagement, trust, and satisfaction, driving sales and long-term customer relationships.
- Live chat is a powerful tool for eCommerce businesses to generate leads, retain customers, and improve customer satisfaction. With personalized messages, agents can pair human interaction with a customer's search history, resulting in tailored suggestions. 42% of customers prefer chatting with brands via live chat, and 77% of online shoppers won't purchase if they don't.

Live Chat Software Market Segment Analysis:
Live Chat Software Market is Segmented Based on By Product, Type, End-user, Device Type.
By Type, Customer Service Live Chat Systems segment is expected to dominate the market during the forecast period
- Live chat software is further classified into Customer Service Live Chat Systems, and Informational Service Live Chat Systems to reflect its diverse functions and applications. These systems offer a wide range of services, from initial planning and installation to ongoing training, troubleshooting, maintenance, upgrading, and disposal of products. They guide customers through setup processes, address technical issues, provide product training, and assist with environmentally responsible disposal of obsolete equipment.
- Customer service Live chat software extends beyond problem-solving to proactive engagement and personalized assistance. Businesses can enhance the overall customer experience by offering timely and tailored guidance. This includes delivering maintenance reminders, recommending product upgrades based on usage patterns, and providing real-time troubleshooting assistance. Live chat software helps businesses build stronger customer relationships, foster loyalty, and drive long-term satisfaction and retention. In essence, live chat systems are a cornerstone of modern customer support strategies, enabling businesses to deliver exceptional service and support throughout the customer journey.
By End User, the E-Commerce segment held the largest share
- In the e-commerce industry, the use of live chat software appears to be the main strategy for getting immediate customer support. With the rapid expansion of e-commerce, the integration of live chat technology has become crucial to enrich the shopping journey. This innovative tool greatly progresses the customer experience by rapidly responding to product questions, supporting order processing, and quickly resolving potential issues in real time.
- The spread of messaging apps and the emergence of social commerce has accelerated the use of chatbots on e-commerce platforms. These intelligent assistants play a significant role in facilitating seamless transactions, providing personalized product recommendations, and providing effective customer support services. By flawlessly integrating live chat software into their e-commerce infrastructure, businesses can streamline communication channels, resulting in greater engagement, trust, and customer satisfaction. This promotes sales growth and nurtures sustainable and fruitful customer relationships.
Live Chat Software Market Regional Insights:
North America is Expected to Dominate the Market Over the Forecast Period
- The market for live chat software is dominated by the United States because of numerous factors such as high technology penetration, growing demand for live chat software for real-time communication, strong economic growth, a large enterprise base, increasing demand for improved customer experience, and helpful government policies. Artificial intelligence (AI) enabled tools and software are being created and developed by North America’s top start-up accelerators to support businesses with customer service, sales, and marketing.
- The adoption of live chat software in the United States is driven by factors such as the need for real-time customer support, the rise in popularity of digital communication channels, and the desire to improve customer engagement and satisfaction. This market is expected to benefit greatly from the combination of artificial intelligence and live chat software.
Active Key Players in the Live Chat Software Market
- LiveChat, Inc. (U.S.)
- Intercom (U.S.)
- Zendesk (U.S.)
- Freshworks Inc. (U.S.)
- Drift (U.S.)
- HelpCrunch (U.S.)
- LivePerson, Inc. (U.S.)
- Olark (U.S.)
- HappyFox Inc. (U.S.)
- Chatra (U.S.)
- Tawk.to (U.S.)
- SnapEngage (U.S.)
- Pure Chat (U.S.)
- Comm100 Network Corporation (U.S.)
- Userlike (U.S.)
- REVE Chat (U.S.)
- JivoSite Inc. (U.S.)
- Kayako Ltd. (U.K.)
- Chat.io (Poland)
- HubSpot, Inc. (U.S.)
- Acquire (U.S.)
- LiveAgent (Slovakia)
- ChatGrape (Austria)
- LiveZilla GmbH (Germany)
- Smartsupp (Czech Republic)
- And Other Active Players
Key Industry Developments in the Live Chat Software Market:
- In March 2024, Zendesk acquires Ultimate. Zendesk announced the acquisition of Ultimate, an industry-leading service automation provider, to deliver the market's most complete artificial intelligence for customer experience (CX)1. As unprecedented demand for AI accelerates and deepens customer engagement, AI agents are moving beyond traditional robotic capabilities to help brands turn CX into a competitive advantage.
- In January 2024, Freshworks Announces Strategic Partnership Agreement with AWS to Expand Coverage of AI-Enhanced Software as a Service. Freshworks Inc. announced today that it has entered into a multi-year strategic collaboration agreement (SCA) with Amazon Web Services (AWS) to develop and expand Freshworks' AWS capabilities.
|
Global Live Chat Software Market |
|||
|
Base Year: |
2024 |
Forecast Period: |
2025-2032 |
|
Historical Data: |
2018 to 2023 |
Market Size in 2024: |
USD 1031.3 Mn. |
|
Forecast Period 2025-30 CAGR: |
8.10 % |
Market Size in 2032: |
USD 1923.05 Mn. |
|
Segments Covered: |
By Product |
|
|
|
By Type |
|
||
|
By End Users |
|
||
|
By Device type |
|
||
|
By Region |
|
||
|
Key Market Drivers: |
|
||
|
Key Market Restraints: |
|
||
|
Key Opportunities: |
|
||
|
Companies Covered in the report: |
|
||
Chapter 1: Introduction
1.1 Scope and Coverage
Chapter 2:Executive Summary
Chapter 3: Market Landscape
3.1 Market Dynamics
3.1.1 Drivers
3.1.2 Restraints
3.1.3 Opportunities
3.1.4 Challenges
3.2 Market Trend Analysis
3.3 PESTLE Analysis
3.4 Porter's Five Forces Analysis
3.5 Industry Value Chain Analysis
3.6 Ecosystem
3.7 Regulatory Landscape
3.8 Price Trend Analysis
3.9 Patent Analysis
3.10 Technology Evolution
3.11 Investment Pockets
3.12 Import-Export Analysis
Chapter 4: Live Chat Software Market by Product (2018-2032)
4.1 Live Chat Software Market Snapshot and Growth Engine
4.2 Market Overview
4.3 Cloud
4.3.1 Introduction and Market Overview
4.3.2 Historic and Forecasted Market Size in Value USD and Volume Units
4.3.3 Key Market Trends, Growth Factors, and Opportunities
4.3.4 Geographic Segmentation Analysis
4.4 On-premises
Chapter 5: Live Chat Software Market by Type (2018-2032)
5.1 Live Chat Software Market Snapshot and Growth Engine
5.2 Market Overview
5.3 Customer Service Live Chat System
5.3.1 Introduction and Market Overview
5.3.2 Historic and Forecasted Market Size in Value USD and Volume Units
5.3.3 Key Market Trends, Growth Factors, and Opportunities
5.3.4 Geographic Segmentation Analysis
5.4 Informational Live Chat Systems
Chapter 6: Live Chat Software Market by End Users (2018-2032)
6.1 Live Chat Software Market Snapshot and Growth Engine
6.2 Market Overview
6.3 Business organization
6.3.1 Introduction and Market Overview
6.3.2 Historic and Forecasted Market Size in Value USD and Volume Units
6.3.3 Key Market Trends, Growth Factors, and Opportunities
6.3.4 Geographic Segmentation Analysis
6.4 Retail
6.5 E-commerce
6.6 Travel
6.7 Healthcare and Hospitality
6.8 Education
Chapter 7: Live Chat Software Market by Device type (2018-2032)
7.1 Live Chat Software Market Snapshot and Growth Engine
7.2 Market Overview
7.3 Mobile
7.3.1 Introduction and Market Overview
7.3.2 Historic and Forecasted Market Size in Value USD and Volume Units
7.3.3 Key Market Trends, Growth Factors, and Opportunities
7.3.4 Geographic Segmentation Analysis
7.4 Desktop
Chapter 8: Company Profiles and Competitive Analysis
8.1 Competitive Landscape
8.1.1 Competitive Benchmarking
8.1.2 Live Chat Software Market Share by Manufacturer (2024)
8.1.3 Industry BCG Matrix
8.1.4 Heat Map Analysis
8.1.5 Mergers and Acquisitions
8.2 ZOLA SUITE (USA)
8.2.1 Company Overview
8.2.2 Key Executives
8.2.3 Company Snapshot
8.2.4 Role of the Company in the Market
8.2.5 Sustainability and Social Responsibility
8.2.6 Operating Business Segments
8.2.7 Product Portfolio
8.2.8 Business Performance
8.2.9 Key Strategic Moves and Recent Developments
8.2.10 SWOT Analysis
8.3 MYCASE (USA)
8.4 PRACTICEPANTHER (USA)
8.5 TIMESOLV (USA)
8.6 ROCKET MATTER (USA)
8.7 JURIS (USA)
8.8 ACUITY ELM (USA)
8.9 ADERANT (USA)
8.10 INTAPP TIME (USA)
8.11 COSMOLEX (USA)
8.12 APPCOLL (USA)
8.13 LEXZUR (USA)
8.14 QUICKBOOKS ONLINE (USA)
8.15 TIME TRACKER (USA)
8.16 NETSUITE (USA)
8.17 MYCASE (USA)
8.18 BIGTIME (USA)
8.19 ABACUSLAW (USA)
8.20 CLIO (CANADA)
8.21 FRESHBOOKS (CANADA)
8.22 SAGE (UNITED KINGDOM)
8.23 BILLIT (BELGIUM)
8.24 SMOKEBALL (AUSTRALIA)
8.25 AVAZA (AUSTRALIA)
8.26 LEAP (AUSTRALIA)
Chapter 9: Global Live Chat Software Market By Region
9.1 Overview
9.2. North America Live Chat Software Market
9.2.1 Key Market Trends, Growth Factors and Opportunities
9.2.2 Top Key Companies
9.2.3 Historic and Forecasted Market Size by Segments
9.2.4 Historic and Forecasted Market Size by Product
9.2.4.1 Cloud
9.2.4.2 On-premises
9.2.5 Historic and Forecasted Market Size by Type
9.2.5.1 Customer Service Live Chat System
9.2.5.2 Informational Live Chat Systems
9.2.6 Historic and Forecasted Market Size by End Users
9.2.6.1 Business organization
9.2.6.2 Retail
9.2.6.3 E-commerce
9.2.6.4 Travel
9.2.6.5 Healthcare and Hospitality
9.2.6.6 Education
9.2.7 Historic and Forecasted Market Size by Device type
9.2.7.1 Mobile
9.2.7.2 Desktop
9.2.8 Historic and Forecast Market Size by Country
9.2.8.1 US
9.2.8.2 Canada
9.2.8.3 Mexico
9.3. Eastern Europe Live Chat Software Market
9.3.1 Key Market Trends, Growth Factors and Opportunities
9.3.2 Top Key Companies
9.3.3 Historic and Forecasted Market Size by Segments
9.3.4 Historic and Forecasted Market Size by Product
9.3.4.1 Cloud
9.3.4.2 On-premises
9.3.5 Historic and Forecasted Market Size by Type
9.3.5.1 Customer Service Live Chat System
9.3.5.2 Informational Live Chat Systems
9.3.6 Historic and Forecasted Market Size by End Users
9.3.6.1 Business organization
9.3.6.2 Retail
9.3.6.3 E-commerce
9.3.6.4 Travel
9.3.6.5 Healthcare and Hospitality
9.3.6.6 Education
9.3.7 Historic and Forecasted Market Size by Device type
9.3.7.1 Mobile
9.3.7.2 Desktop
9.3.8 Historic and Forecast Market Size by Country
9.3.8.1 Russia
9.3.8.2 Bulgaria
9.3.8.3 The Czech Republic
9.3.8.4 Hungary
9.3.8.5 Poland
9.3.8.6 Romania
9.3.8.7 Rest of Eastern Europe
9.4. Western Europe Live Chat Software Market
9.4.1 Key Market Trends, Growth Factors and Opportunities
9.4.2 Top Key Companies
9.4.3 Historic and Forecasted Market Size by Segments
9.4.4 Historic and Forecasted Market Size by Product
9.4.4.1 Cloud
9.4.4.2 On-premises
9.4.5 Historic and Forecasted Market Size by Type
9.4.5.1 Customer Service Live Chat System
9.4.5.2 Informational Live Chat Systems
9.4.6 Historic and Forecasted Market Size by End Users
9.4.6.1 Business organization
9.4.6.2 Retail
9.4.6.3 E-commerce
9.4.6.4 Travel
9.4.6.5 Healthcare and Hospitality
9.4.6.6 Education
9.4.7 Historic and Forecasted Market Size by Device type
9.4.7.1 Mobile
9.4.7.2 Desktop
9.4.8 Historic and Forecast Market Size by Country
9.4.8.1 Germany
9.4.8.2 UK
9.4.8.3 France
9.4.8.4 The Netherlands
9.4.8.5 Italy
9.4.8.6 Spain
9.4.8.7 Rest of Western Europe
9.5. Asia Pacific Live Chat Software Market
9.5.1 Key Market Trends, Growth Factors and Opportunities
9.5.2 Top Key Companies
9.5.3 Historic and Forecasted Market Size by Segments
9.5.4 Historic and Forecasted Market Size by Product
9.5.4.1 Cloud
9.5.4.2 On-premises
9.5.5 Historic and Forecasted Market Size by Type
9.5.5.1 Customer Service Live Chat System
9.5.5.2 Informational Live Chat Systems
9.5.6 Historic and Forecasted Market Size by End Users
9.5.6.1 Business organization
9.5.6.2 Retail
9.5.6.3 E-commerce
9.5.6.4 Travel
9.5.6.5 Healthcare and Hospitality
9.5.6.6 Education
9.5.7 Historic and Forecasted Market Size by Device type
9.5.7.1 Mobile
9.5.7.2 Desktop
9.5.8 Historic and Forecast Market Size by Country
9.5.8.1 China
9.5.8.2 India
9.5.8.3 Japan
9.5.8.4 South Korea
9.5.8.5 Malaysia
9.5.8.6 Thailand
9.5.8.7 Vietnam
9.5.8.8 The Philippines
9.5.8.9 Australia
9.5.8.10 New Zealand
9.5.8.11 Rest of APAC
9.6. Middle East & Africa Live Chat Software Market
9.6.1 Key Market Trends, Growth Factors and Opportunities
9.6.2 Top Key Companies
9.6.3 Historic and Forecasted Market Size by Segments
9.6.4 Historic and Forecasted Market Size by Product
9.6.4.1 Cloud
9.6.4.2 On-premises
9.6.5 Historic and Forecasted Market Size by Type
9.6.5.1 Customer Service Live Chat System
9.6.5.2 Informational Live Chat Systems
9.6.6 Historic and Forecasted Market Size by End Users
9.6.6.1 Business organization
9.6.6.2 Retail
9.6.6.3 E-commerce
9.6.6.4 Travel
9.6.6.5 Healthcare and Hospitality
9.6.6.6 Education
9.6.7 Historic and Forecasted Market Size by Device type
9.6.7.1 Mobile
9.6.7.2 Desktop
9.6.8 Historic and Forecast Market Size by Country
9.6.8.1 Turkiye
9.6.8.2 Bahrain
9.6.8.3 Kuwait
9.6.8.4 Saudi Arabia
9.6.8.5 Qatar
9.6.8.6 UAE
9.6.8.7 Israel
9.6.8.8 South Africa
9.7. South America Live Chat Software Market
9.7.1 Key Market Trends, Growth Factors and Opportunities
9.7.2 Top Key Companies
9.7.3 Historic and Forecasted Market Size by Segments
9.7.4 Historic and Forecasted Market Size by Product
9.7.4.1 Cloud
9.7.4.2 On-premises
9.7.5 Historic and Forecasted Market Size by Type
9.7.5.1 Customer Service Live Chat System
9.7.5.2 Informational Live Chat Systems
9.7.6 Historic and Forecasted Market Size by End Users
9.7.6.1 Business organization
9.7.6.2 Retail
9.7.6.3 E-commerce
9.7.6.4 Travel
9.7.6.5 Healthcare and Hospitality
9.7.6.6 Education
9.7.7 Historic and Forecasted Market Size by Device type
9.7.7.1 Mobile
9.7.7.2 Desktop
9.7.8 Historic and Forecast Market Size by Country
9.7.8.1 Brazil
9.7.8.2 Argentina
9.7.8.3 Rest of SA
Chapter 10 Analyst Viewpoint and Conclusion
10.1 Recommendations and Concluding Analysis
10.2 Potential Market Strategies
Chapter 11 Research Methodology
11.1 Research Process
11.2 Primary Research
11.3 Secondary Research
|
Global Live Chat Software Market |
|||
|
Base Year: |
2024 |
Forecast Period: |
2025-2032 |
|
Historical Data: |
2018 to 2023 |
Market Size in 2024: |
USD 1031.3 Mn. |
|
Forecast Period 2025-30 CAGR: |
8.10 % |
Market Size in 2032: |
USD 1923.05 Mn. |
|
Segments Covered: |
By Product |
|
|
|
By Type |
|
||
|
By End Users |
|
||
|
By Device type |
|
||
|
By Region |
|
||
|
Key Market Drivers: |
|
||
|
Key Market Restraints: |
|
||
|
Key Opportunities: |
|
||
|
Companies Covered in the report: |
|
||


