


Inulin Market Synopsis
The global Inulin Market was valued at USD 1.72 Billion in 2023 and is expected to reach USD 2.91 Billion by the year 2032, at a CAGR of 6.8%
Inulin is a type of soluble fiber found in certain plants, particularly in the roots or rhizomes of vegetables like chicory, Jerusalem artichokes, and onions. It's a polysaccharide, meaning it's made up of multiple sugar molecules. Despite being a carbohydrate, inulin is not digested or absorbed in the small intestine like most sugars. Instead, it travels to the colon, where it serves as a prebiotic, nourishing beneficial bacteria in the gut. This fermentation process produces short-chain fatty acids, which offer various health benefits, including improved digestion, enhanced immune function, and potentially even lowering the risk of certain diseases like colon cancer.
- Inulin, a type of dietary fiber derived from chicory roots, offers numerous health benefits, including improving digestive health, promoting weight loss, and aiding in blood sugar control. As consumers become increasingly health-conscious, there's a growing interest in natural, functional ingredients like inulin.
- Moreover, inulin's versatility makes it a desirable ingredient for food manufacturers. It can be used as a fat or sugar replacer, a prebiotic additive, or a texturizer in a wide range of products such as dairy, bakery, beverages, and supplements. This adaptability has led to its incorporation into an expanding array of food and beverage formulations.
- Additionally, the rise of functional foods and beverages, which offer health benefits beyond basic nutrition, has propelled the demand for inulin. With consumers seeking products that support their overall well-being, there's a significant market opportunity for inulin-enhanced offerings.
The Inulin Market Trend Analysis
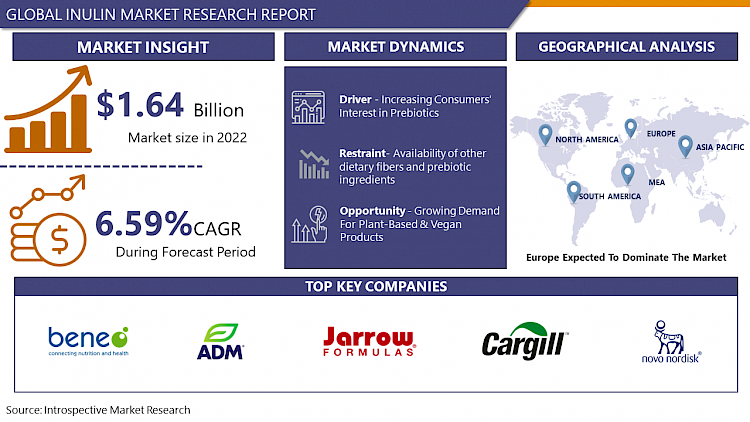
Increasing Consumers’ Interest in Prebiotics
- Prebiotic inulin is becoming more well-liked among consumers all over the world as people realize how crucial gut health is. Prebiotics like inulin are becoming more popular because consumers want better digestion, a reduced stress response, better hormonal balance, and a decrease in cardiovascular diseases. As a result, producers are showing interest in using functional ingredients like inulin to create functional food, beverage, and health supplement products.
- Inulin is widely used in adult products, and it is being added to infant formula or milk more frequently to help babies' and young children's intestinal microflora. Inulin is a perfect ingredient for the nutrition of infants and young children because of its neutral flavor, which guarantees that it does not alter the product's original flavor. Manufacturers are taking advantage of this rising interest by releasing cutting-edge products like Beneo Orafti Synergy1 inulin, an infant formula fortified with oligofructose that has beneficial prebiotic effects on newborns and may address neonatal nutrition.
Growing Demand for Plant-Based & Vegan Products
- Demand for products that support ethical choices has increased dramatically as a result of the global trend toward vegan and plant-based diets. Inulin, a completely plant-based and vegan product, is at the forefront of this transformative trend and has quickly gained popularity among vegans and those looking for plant-based food alternatives. The inulin market now has a compelling opportunity as a result of the rising demand for plant-based diets because it can take advantage of this trend.
- Notably, the growth in the use of organic and plant-based ingredients in pharmaceutical and nutraceutical formulations is fueling the market for inulin. In addition to satisfying the growing demand for ingredients derived from plants, this gradual incorporation of inulin into these formulations offers a special chance for the inulin market to grow. The compatibility of inulin with these industries highlights its adaptability and versatility as a functional ingredient that appeals to consumers who are concerned about their health.
Inulin Market Segmentation Analysis
Inulin market segments cover the Nature, Source, Form, and Application. By Application, the Food & Beverage, segment is anticipated to dominate the Market Over the Forecast period.
- The inulin market is dominated by the food and beverage segment, demonstrating this sector's significant influence and importance within the food industry. The widespread use of inulin is facilitated by the segment's further diversification into a number of categories, including dairy products, bakery and confectionery, meat products, and beverages. The versatility of inulin is one of the main factors influencing its use in the food and beverage industry. Due to its many uses in the food industry, inulin is a very sought-after ingredient. It is used in a variety of food products as a texture enhancer, prebiotic, or functional ingredient in place of sugar.
- The market for baked goods and sweets is seeing an increase in inulin demand. Inulin perfectly complements the trend among consumers toward healthier bakery and confectionery options. In order to satisfy the changing preferences of today's consumers, manufacturers are able to produce confectionery and bakery goods that are not only delicious but also healthy. The fact that inulin is present naturally in a variety of plant-based foods, including chicory, artichokes, asparagus, leeks, onions, and garlic, emphasizes how well-suited it is to the human diet. Since prehistoric times, it has been a staple of the human diet, with some early humans consuming quantities that are noticeably higher than those found in modern diets.
The Inulin Market Regional Analysis
Europe is Expected to Dominate the Market Over the Forecast Period.
- The rising demand for fortified food items that include prebiotic ingredients like inulin is one of the main forces behind Europe's dominance. The demand for healthier dietary options among consumers has significantly increased the momentum of this trend.
- The abundance of raw materials available to Europe is especially advantageous because chicory roots are the main source of inulin. The region's inulin market is anticipated to grow significantly as a result of the rising production of chicory roots in Europe. This supply of raw materials fuels Europe's booming inulin production sector. Additionally, consumers in Europe are becoming more aware of the numerous advantages of inulin for promoting gut health.
- This heightened awareness, coupled with favorable regulatory policies regarding the use of functional ingredients in food and beverage formulation, is expected to drive the demand for inulin-based products in the European market. The widespread use of inulin as a healthy alternative to fat and sugar in the food and beverage industry is one of the main factors driving the market for inulin in Europe. Notably, there has been an increase in demand for food products that have prebiotic ingredients like inulin added to them in the United Kingdom.
- Sales of bakery, dairy, and meat products have increased throughout the nation over time, in line with consumer preferences for healthier options. With significant imports worth USD 2.9 billion, the United Kingdom became the second-largest global market for baked goods in 2020, according to data from Agriculture and Agri-Food Canada. The United Kingdom also saw the introduction of a sizable number of new bakery products, highlighting the market expansion potential of the nation.
COVID-19 Impact Analysis on Inulin Market
- The COVID-19 outbreak has disrupted the supply chain for inulin across the globe. The surging demand has led to a shortage of products in stores as well as online platforms. The scarcity of raw materials, decreased deliveries, lockdown, and reduced workforce have severely hampered the industry. However, the outbreak of COVID-19 has increased, diabetes, and cholesterol. Consumers are purchasing immunity-boosting and nutritious supplements in an attempt to fight against the virus.
- The pandemic has created health awareness among consumers regarding the purchase of sustainable and organic food products. With the importance of a robust immune system in the spotlight, there was a surge in demand for products that could support immune health. Inulin, as a prebiotic, plays a role in promoting gut health, which is closely linked to immune function. This led to increased interest in inulin-based products.
Top Key Players Covered in The Inulin Market
- Sensus NV (US)
- Ciranda Inc. (US)
- The Green Labs LLC (US)
- The Ingredient House (TIH) (US)
- Archer Daniels Midland Company (US)
- Jarrow Formulas Inc. (US)
- NOW Foods(US)
- The Tierra Group (US)
- Nutriagaves Group (US)
- Steviva Brands Inc (US)
- Cargill Incorporated (US)
- IntrinsicOrganics (US)
- Nova Green Inc. (Canada)
- Novo Nordisk (Denmark)
- BENEO GmbH (Germany)
- Cosucra Groupe Warcoing SA (Belgium)
- Sensus BV (Netherlands)
- Naturel West Corp EU B.V. (Netherlands)
- Nexira (France)
- Adept Impex Private Limited (India)
- Bioven Ingredients (India)
- PMV Nutrient Products Pvt Ltd (India)
- Shandong Baolingbao Biotechnology Co. Ltd (China)
- Bioway (Xi'An) Organic Ingredients Co., Ltd (China)
- Dingxi Longhai Dairy Co. Ltd. (China), and Other Major Players
Key Industry Developments in the Inulin Market
- In March 2022, Sensus, a Dutch co-op member, announced its plans to expand the production of chicory root fiber (inulin) to meet the growing demand for natural prebiotics in plant-based foods and supplements.
- In December 2021, Beneo, a functional ingredient manufacturer, invested EUR 30 million (USD 33.9 million) in expanding its capacity for producing prebiotic chicory fiber roots in Chile and Belgium. The expansion would increase the production of chicory root fiber inulin by over 40% to meet customer demand and promote the growth of the inulin market.
|
Global Inulin Market |
|||
|
Base Year: |
2023 |
Forecast Period: |
2024-2032 |
|
Historical Data: |
2017 to 2023 |
Market Size in 2023: |
USD 1.72 Bn. |
|
Forecast Period 2022-30 CAGR: |
6.8% |
Market Size in 2032: |
USD 2.91 Bn. |
|
Segments Covered: |
By Type |
|
|
|
By Source |
|
||
|
By Form |
|
||
|
By Application |
|
||
|
By Region |
|
||
|
Key Market Drivers: |
|
||
|
Key Market Restraints: |
|
||
|
Key Opportunities: |
|
||
|
Companies Covered in the report: |
|
||
- INTRODUCTION
- RESEARCH OBJECTIVES
- RESEARCH METHODOLOGY
- RESEARCH PROCESS
- SCOPE AND COVERAGE
- Market Definition
- Key Questions Answered
- MARKET SEGMENTATION
- EXECUTIVE SUMMARY
- MARKET OVERVIEW
- GROWTH OPPORTUNITIES BY SEGMENT
- MARKET LANDSCAPE
- PORTER’S FIVE FORCES ANALYSIS
- Bargaining Power Of Supplier
- Threat Of New Entrants
- Threat Of Substitutes
- Competitive Rivalry
- Bargaining Power Among Buyers
- INDUSTRY VALUE CHAIN ANALYSIS
- MARKET DYNAMICS
- Drivers
- Restraints
- Opportunities
- Challenges
- MARKET TREND ANALYSIS
- REGULATORY LANDSCAPE
- PESTLE ANALYSIS
- PRICE TREND ANALYSIS
- PATENT ANALYSIS
- TECHNOLOGY EVALUATION
- ANALYSIS OF THE IMPACT OF COVID-19
- Impact On The Overall Market
- Impact On The Supply Chain
- Impact On The Key Manufacturers
- Impact On The Pricing
- Post COVID Situation
- MARKET IMPACT OF THE RUSSIA-UKRAINE WAR
- Geopolitical Market Disruptions
- Supply Chain Disruptions
- Instability in Emerging Markets
- ECOSYSTEM
- PORTER’S FIVE FORCES ANALYSIS
- INULIN MARKET BY NATURE (2016-2030)
- INULIN MARKET SNAPSHOT AND GROWTH ENGINE
- MARKET OVERVIEW
- ORGANIC
- Introduction And Market Overview
- Historic And Forecasted Market Size in Value (2016 – 2030F)
- Historic And Forecasted Market Size in Volume (2016 – 2030F)
- Key Market Trends, Growth Factors And Opportunities
- Geographic Segmentation Analysis
- CONVENTIONAL
- INULIN MARKET BY SOURCE (2016-2030)
- INULIN MARKET SNAPSHOT AND GROWTH ENGINE
- MARKET OVERVIEW
- AGAVEINULIN
- Introduction And Market Overview
- Historic And Forecasted Market Size in Value (2016 – 2030F)
- Historic And Forecasted Market Size in Volume (2016 – 2030F)
- Key Market Trends, Growth Factors And Opportunities
- Geographic Segmentation Analysis
- CHICORYINULIN
- JERUSALEM ARTICHOKE
- INULIN MARKET BY FORM (2016-2030)
- INULIN MARKET SNAPSHOT AND GROWTH ENGINE
- MARKET OVERVIEW
- POWDER
- Introduction And Market Overview
- Historic And Forecasted Market Size in Value (2016 – 2030F)
- Historic And Forecasted Market Size in Volume (2016 – 2030F)
- Key Market Trends, Growth Factors And Opportunities
- Geographic Segmentation Analysis
- LIQUID
- INULIN MARKET BY APPLICATION (2016-2030)
- INULIN MARKET SNAPSHOT AND GROWTH ENGINE
- MARKET OVERVIEW
- FOOD AND BEVERAGE
- Introduction And Market Overview
- Historic And Forecasted Market Size in Value (2016 – 2030F)
- Historic And Forecasted Market Size in Volume (2016 – 2030F)
- Key Market Trends, Growth Factors And Opportunities
- Geographic Segmentation Analysis
- DIETARY SUPPLEMENTS
- PHARMACEUTICALS
- ANIMAL FEED
- COMPANY PROFILES AND COMPETITIVE ANALYSIS
- COMPETITIVE LANDSCAPE
- Competitive Positioning
- INULIN Market Share By Manufacturer (2022)
- Industry BCG Matrix
- Heat Map Analysis
- Mergers & Acquisitions
- SENSUS NV (US)
- Company Overview
- Key Executives
- Company Snapshot
- Role of the Company in the Market
- Sustainability and Social Responsibility
- Operating Business Segments
- Product Portfolio
- Business Performance (Production Volume, Sales Volume, Sales Margin, Production Capacity, Capacity Utilization Rate)
- Key Strategic Moves And Recent Developments
- SWOT Analysis
- CIRANDA INC. (US)
- THE GREEN LABS LLC (US)
- THE INGREDIENT HOUSE (TIH) (US)
- ARCHER DANIELS MIDLAND COMPANY (US)
- JARROW FORMULAS INC. (US)
- NOW FOODS (US)
- THE TIERRA GROUP (US)
- NUTRIAGAVES GROUP (US)
- STEVIVA BRANDS INC (US)
- CARGILL INCORPORATED (US)
- INTRINSICORGANICS (US)
- NOVA GREEN INC. (CANADA)
- NOVO NORDISK (DENMARK)
- BENEO GMBH (GERMANY)
- COSUCRA GROUPE WARCOING SA (BELGIUM)
- SENSUS BV (NETHERLANDS)
- NATUREL WEST CORP EU B.V. (NETHERLANDS)
- NEXIRA (FRANCE)
- ADEPT IMPEX PRIVATE LIMITED (INDIA)
- COMPETITIVE LANDSCAPE
- GLOBAL INULIN MARKET BY REGION
- OVERVIEW
- NORTH AMERICA
- Key Market Trends, Growth Factors And Opportunities
- Impact Of Covid-19
- Key Manufacturers
- Historic And Forecasted Market Size By Segment1
- Historic And Forecasted Market Size By Segment2
- Historic And Forecasted Market Size By Segment3
- Historic And Forecasted Market Size By Segment4
- Historic And Forecasted Market Size By Segment5
- Historic And Forecasted Market Size By Segment6
- Historic And Forecasted Market Size By Country
- USA
- Canada
- Mexico
- EASTERN EUROPE
- Key Market Trends, Growth Factors And Opportunities
- Impact Of Covid-19
- Key Manufacturers
- Historic And Forecasted Market Size By Segments
- Historic And Forecasted Market Size By Country
- Russia
- Bulgaria
- The Czech Republic
- Hungary
- Poland
- Romania
- Rest Of Eastern Europe
- WESTERN EUROPE
- Key Market Trends, Growth Factors And Opportunities
- Impact Of Covid-19
- Key Manufacturers
- Historic And Forecasted Market Size By Segments
- Historic And Forecasted Market Size By Country
- Germany
- United Kingdom
- France
- The Netherlands
- Italy
- Spain
- Rest Of Western Europe
- ASIA PACIFIC
- Key Market Trends, Growth Factors And Opportunities
- Impact Of Covid-19
- Key Manufacturers
- Historic And Forecasted Market Size By Segments
- Historic And Forecasted Market Size By Country
- China
- India
- Japan
- South Korea
- Malaysia
- Thailand
- Vietnam
- The Philippines
- Australia
- New-Zealand
- Rest Of APAC
- MIDDLE EAST & AFRICA
- Key Market Trends, Growth Factors And Opportunities
- Impact Of Covid-19
- Key Manufacturers
- Historic And Forecasted Market Size By Segments
- Historic And Forecasted Market Size By Country
- Turkey
- Bahrain
- Kuwait
- Saudi Arabia
- Qatar
- UAE
- Israel
- South Africa
- SOUTH AMERICA
- Key Market Trends, Growth Factors And Opportunities
- Impact Of Covid-19
- Key Manufacturers
- Historic And Forecasted Market Size By Segments
- Historic And Forecasted Market Size By Country
- Brazil
- Argentina
- Rest of South America
- INVESTMENT ANALYSIS
- ANALYST VIEWPOINT AND CONCLUSION
- Recommendations and Concluding Analysis
- Potential Market Strategies
|
Global Inulin Market |
|||
|
Base Year: |
2023 |
Forecast Period: |
2024-2032 |
|
Historical Data: |
2017 to 2023 |
Market Size in 2023: |
USD 1.72 Bn. |
|
Forecast Period 2022-30 CAGR: |
6.8% |
Market Size in 2032: |
USD 2.91 Bn. |
|
Segments Covered: |
By Type |
|
|
|
By Source |
|
||
|
By Form |
|
||
|
By Application |
|
||
|
By Region |
|
||
|
Key Market Drivers: |
|
||
|
Key Market Restraints: |
|
||
|
Key Opportunities: |
|
||
|
Companies Covered in the report: |
|
||
LIST OF TABLES
TABLE 001. EXECUTIVE SUMMARY
TABLE 002. INULIN MARKET BARGAINING POWER OF SUPPLIERS
TABLE 003. INULIN MARKET BARGAINING POWER OF CUSTOMERS
TABLE 004. INULIN MARKET COMPETITIVE RIVALRY
TABLE 005. INULIN MARKET THREAT OF NEW ENTRANTS
TABLE 006. INULIN MARKET THREAT OF SUBSTITUTES
TABLE 007. INULIN MARKET BY NATURE
TABLE 008. ORGANIC MARKET OVERVIEW (2016-2030)
TABLE 009. CONVENTIONAL MARKET OVERVIEW (2016-2030)
TABLE 010. INULIN MARKET BY SOURCE
TABLE 011. AGAVEINULIN MARKET OVERVIEW (2016-2030)
TABLE 012. CHICORYINULIN MARKET OVERVIEW (2016-2030)
TABLE 013. JERUSALEM ARTICHOKE MARKET OVERVIEW (2016-2030)
TABLE 014. INULIN MARKET BY FORM
TABLE 015. POWDER MARKET OVERVIEW (2016-2030)
TABLE 016. LIQUID MARKET OVERVIEW (2016-2030)
TABLE 017. INULIN MARKET BY APPLICATION
TABLE 018. FOOD & BEVERAGE MARKET OVERVIEW (2016-2030)
TABLE 019. DIETARY SUPPLEMENTS MARKET OVERVIEW (2016-2030)
TABLE 020. PHARMACEUTICALS MARKET OVERVIEW (2016-2030)
TABLE 021. ANIMAL FEED MARKET OVERVIEW (2016-2030)
TABLE 022. NORTH AMERICA INULIN MARKET, BY NATURE (2016-2030)
TABLE 023. NORTH AMERICA INULIN MARKET, BY SOURCE (2016-2030)
TABLE 024. NORTH AMERICA INULIN MARKET, BY FORM (2016-2030)
TABLE 025. NORTH AMERICA INULIN MARKET, BY APPLICATION (2016-2030)
TABLE 026. N INULIN MARKET, BY COUNTRY (2016-2030)
TABLE 027. EASTERN EUROPE INULIN MARKET, BY NATURE (2016-2030)
TABLE 028. EASTERN EUROPE INULIN MARKET, BY SOURCE (2016-2030)
TABLE 029. EASTERN EUROPE INULIN MARKET, BY FORM (2016-2030)
TABLE 030. EASTERN EUROPE INULIN MARKET, BY APPLICATION (2016-2030)
TABLE 031. INULIN MARKET, BY COUNTRY (2016-2030)
TABLE 032. WESTERN EUROPE INULIN MARKET, BY NATURE (2016-2030)
TABLE 033. WESTERN EUROPE INULIN MARKET, BY SOURCE (2016-2030)
TABLE 034. WESTERN EUROPE INULIN MARKET, BY FORM (2016-2030)
TABLE 035. WESTERN EUROPE INULIN MARKET, BY APPLICATION (2016-2030)
TABLE 036. INULIN MARKET, BY COUNTRY (2016-2030)
TABLE 037. ASIA PACIFIC INULIN MARKET, BY NATURE (2016-2030)
TABLE 038. ASIA PACIFIC INULIN MARKET, BY SOURCE (2016-2030)
TABLE 039. ASIA PACIFIC INULIN MARKET, BY FORM (2016-2030)
TABLE 040. ASIA PACIFIC INULIN MARKET, BY APPLICATION (2016-2030)
TABLE 041. INULIN MARKET, BY COUNTRY (2016-2030)
TABLE 042. MIDDLE EAST & AFRICA INULIN MARKET, BY NATURE (2016-2030)
TABLE 043. MIDDLE EAST & AFRICA INULIN MARKET, BY SOURCE (2016-2030)
TABLE 044. MIDDLE EAST & AFRICA INULIN MARKET, BY FORM (2016-2030)
TABLE 045. MIDDLE EAST & AFRICA INULIN MARKET, BY APPLICATION (2016-2030)
TABLE 046. INULIN MARKET, BY COUNTRY (2016-2030)
TABLE 047. SOUTH AMERICA INULIN MARKET, BY NATURE (2016-2030)
TABLE 048. SOUTH AMERICA INULIN MARKET, BY SOURCE (2016-2030)
TABLE 049. SOUTH AMERICA INULIN MARKET, BY FORM (2016-2030)
TABLE 050. SOUTH AMERICA INULIN MARKET, BY APPLICATION (2016-2030)
TABLE 051. INULIN MARKET, BY COUNTRY (2016-2030)
TABLE 052. SENSUS NV (US): SNAPSHOT
TABLE 053. SENSUS NV (US): BUSINESS PERFORMANCE
TABLE 054. SENSUS NV (US): PRODUCT PORTFOLIO
TABLE 055. SENSUS NV (US): KEY STRATEGIC MOVES AND DEVELOPMENTS
TABLE 055. CIRANDA INC. (US): SNAPSHOT
TABLE 056. CIRANDA INC. (US): BUSINESS PERFORMANCE
TABLE 057. CIRANDA INC. (US): PRODUCT PORTFOLIO
TABLE 058. CIRANDA INC. (US): KEY STRATEGIC MOVES AND DEVELOPMENTS
TABLE 058. THE GREEN LABS LLC (US): SNAPSHOT
TABLE 059. THE GREEN LABS LLC (US): BUSINESS PERFORMANCE
TABLE 060. THE GREEN LABS LLC (US): PRODUCT PORTFOLIO
TABLE 061. THE GREEN LABS LLC (US): KEY STRATEGIC MOVES AND DEVELOPMENTS
TABLE 061. THE INGREDIENT HOUSE (TIH) (US): SNAPSHOT
TABLE 062. THE INGREDIENT HOUSE (TIH) (US): BUSINESS PERFORMANCE
TABLE 063. THE INGREDIENT HOUSE (TIH) (US): PRODUCT PORTFOLIO
TABLE 064. THE INGREDIENT HOUSE (TIH) (US): KEY STRATEGIC MOVES AND DEVELOPMENTS
TABLE 064. ARCHER DANIELS MIDLAND COMPANY (US): SNAPSHOT
TABLE 065. ARCHER DANIELS MIDLAND COMPANY (US): BUSINESS PERFORMANCE
TABLE 066. ARCHER DANIELS MIDLAND COMPANY (US): PRODUCT PORTFOLIO
TABLE 067. ARCHER DANIELS MIDLAND COMPANY (US): KEY STRATEGIC MOVES AND DEVELOPMENTS
TABLE 067. JARROW FORMULAS INC. (US): SNAPSHOT
TABLE 068. JARROW FORMULAS INC. (US): BUSINESS PERFORMANCE
TABLE 069. JARROW FORMULAS INC. (US): PRODUCT PORTFOLIO
TABLE 070. JARROW FORMULAS INC. (US): KEY STRATEGIC MOVES AND DEVELOPMENTS
TABLE 070. NOW FOODS (US): SNAPSHOT
TABLE 071. NOW FOODS (US): BUSINESS PERFORMANCE
TABLE 072. NOW FOODS (US): PRODUCT PORTFOLIO
TABLE 073. NOW FOODS (US): KEY STRATEGIC MOVES AND DEVELOPMENTS
TABLE 073. THE TIERRA GROUP (US): SNAPSHOT
TABLE 074. THE TIERRA GROUP (US): BUSINESS PERFORMANCE
TABLE 075. THE TIERRA GROUP (US): PRODUCT PORTFOLIO
TABLE 076. THE TIERRA GROUP (US): KEY STRATEGIC MOVES AND DEVELOPMENTS
TABLE 076. NUTRIAGAVES GROUP (US): SNAPSHOT
TABLE 077. NUTRIAGAVES GROUP (US): BUSINESS PERFORMANCE
TABLE 078. NUTRIAGAVES GROUP (US): PRODUCT PORTFOLIO
TABLE 079. NUTRIAGAVES GROUP (US): KEY STRATEGIC MOVES AND DEVELOPMENTS
TABLE 079. STEVIVA BRANDS INC (US): SNAPSHOT
TABLE 080. STEVIVA BRANDS INC (US): BUSINESS PERFORMANCE
TABLE 081. STEVIVA BRANDS INC (US): PRODUCT PORTFOLIO
TABLE 082. STEVIVA BRANDS INC (US): KEY STRATEGIC MOVES AND DEVELOPMENTS
TABLE 082. CARGILL INCORPORATED (US): SNAPSHOT
TABLE 083. CARGILL INCORPORATED (US): BUSINESS PERFORMANCE
TABLE 084. CARGILL INCORPORATED (US): PRODUCT PORTFOLIO
TABLE 085. CARGILL INCORPORATED (US): KEY STRATEGIC MOVES AND DEVELOPMENTS
TABLE 085. INTRINSICORGANICS (US): SNAPSHOT
TABLE 086. INTRINSICORGANICS (US): BUSINESS PERFORMANCE
TABLE 087. INTRINSICORGANICS (US): PRODUCT PORTFOLIO
TABLE 088. INTRINSICORGANICS (US): KEY STRATEGIC MOVES AND DEVELOPMENTS
TABLE 088. NOVA GREEN INC. (CANADA): SNAPSHOT
TABLE 089. NOVA GREEN INC. (CANADA): BUSINESS PERFORMANCE
TABLE 090. NOVA GREEN INC. (CANADA): PRODUCT PORTFOLIO
TABLE 091. NOVA GREEN INC. (CANADA): KEY STRATEGIC MOVES AND DEVELOPMENTS
TABLE 091. NOVO NORDISK (DENMARK): SNAPSHOT
TABLE 092. NOVO NORDISK (DENMARK): BUSINESS PERFORMANCE
TABLE 093. NOVO NORDISK (DENMARK): PRODUCT PORTFOLIO
TABLE 094. NOVO NORDISK (DENMARK): KEY STRATEGIC MOVES AND DEVELOPMENTS
TABLE 094. BENEO GMBH (GERMANY): SNAPSHOT
TABLE 095. BENEO GMBH (GERMANY): BUSINESS PERFORMANCE
TABLE 096. BENEO GMBH (GERMANY): PRODUCT PORTFOLIO
TABLE 097. BENEO GMBH (GERMANY): KEY STRATEGIC MOVES AND DEVELOPMENTS
TABLE 097. COSUCRA GROUPE WARCOING SA (BELGIUM): SNAPSHOT
TABLE 098. COSUCRA GROUPE WARCOING SA (BELGIUM): BUSINESS PERFORMANCE
TABLE 099. COSUCRA GROUPE WARCOING SA (BELGIUM): PRODUCT PORTFOLIO
TABLE 100. COSUCRA GROUPE WARCOING SA (BELGIUM): KEY STRATEGIC MOVES AND DEVELOPMENTS
TABLE 100. SENSUS BV (NETHERLANDS): SNAPSHOT
TABLE 101. SENSUS BV (NETHERLANDS): BUSINESS PERFORMANCE
TABLE 102. SENSUS BV (NETHERLANDS): PRODUCT PORTFOLIO
TABLE 103. SENSUS BV (NETHERLANDS): KEY STRATEGIC MOVES AND DEVELOPMENTS
TABLE 103. NATUREL WEST CORP EU B.V. (NETHERLANDS): SNAPSHOT
TABLE 104. NATUREL WEST CORP EU B.V. (NETHERLANDS): BUSINESS PERFORMANCE
TABLE 105. NATUREL WEST CORP EU B.V. (NETHERLANDS): PRODUCT PORTFOLIO
TABLE 106. NATUREL WEST CORP EU B.V. (NETHERLANDS): KEY STRATEGIC MOVES AND DEVELOPMENTS
TABLE 106. NEXIRA (FRANCE): SNAPSHOT
TABLE 107. NEXIRA (FRANCE): BUSINESS PERFORMANCE
TABLE 108. NEXIRA (FRANCE): PRODUCT PORTFOLIO
TABLE 109. NEXIRA (FRANCE): KEY STRATEGIC MOVES AND DEVELOPMENTS
TABLE 109. ADEPT IMPEX PRIVATE LIMITED (INDIA): SNAPSHOT
TABLE 110. ADEPT IMPEX PRIVATE LIMITED (INDIA): BUSINESS PERFORMANCE
TABLE 111. ADEPT IMPEX PRIVATE LIMITED (INDIA): PRODUCT PORTFOLIO
TABLE 112. ADEPT IMPEX PRIVATE LIMITED (INDIA): KEY STRATEGIC MOVES AND DEVELOPMENTS
TABLE 112. BIOVEN INGREDIENTS (INDIA): SNAPSHOT
TABLE 113. BIOVEN INGREDIENTS (INDIA): BUSINESS PERFORMANCE
TABLE 114. BIOVEN INGREDIENTS (INDIA): PRODUCT PORTFOLIO
TABLE 115. BIOVEN INGREDIENTS (INDIA): KEY STRATEGIC MOVES AND DEVELOPMENTS
TABLE 115. PMV NUTRIENT PRODUCTS PVT LTD (INDIA): SNAPSHOT
TABLE 116. PMV NUTRIENT PRODUCTS PVT LTD (INDIA): BUSINESS PERFORMANCE
TABLE 117. PMV NUTRIENT PRODUCTS PVT LTD (INDIA): PRODUCT PORTFOLIO
TABLE 118. PMV NUTRIENT PRODUCTS PVT LTD (INDIA): KEY STRATEGIC MOVES AND DEVELOPMENTS
TABLE 118. SHANDONG BAOLINGBAO BIOTECHNOLOGY CO. LTD (CHINA): SNAPSHOT
TABLE 119. SHANDONG BAOLINGBAO BIOTECHNOLOGY CO. LTD (CHINA): BUSINESS PERFORMANCE
TABLE 120. SHANDONG BAOLINGBAO BIOTECHNOLOGY CO. LTD (CHINA): PRODUCT PORTFOLIO
TABLE 121. SHANDONG BAOLINGBAO BIOTECHNOLOGY CO. LTD (CHINA): KEY STRATEGIC MOVES AND DEVELOPMENTS
TABLE 121. BIOWAY (XI'AN) ORGANIC INGREDIENTS CO.: SNAPSHOT
TABLE 122. BIOWAY (XI'AN) ORGANIC INGREDIENTS CO.: BUSINESS PERFORMANCE
TABLE 123. BIOWAY (XI'AN) ORGANIC INGREDIENTS CO.: PRODUCT PORTFOLIO
TABLE 124. BIOWAY (XI'AN) ORGANIC INGREDIENTS CO.: KEY STRATEGIC MOVES AND DEVELOPMENTS
TABLE 124. LTD (CHINA): SNAPSHOT
TABLE 125. LTD (CHINA): BUSINESS PERFORMANCE
TABLE 126. LTD (CHINA): PRODUCT PORTFOLIO
TABLE 127. LTD (CHINA): KEY STRATEGIC MOVES AND DEVELOPMENTS
TABLE 127. DINGXI LONGHAI DAIRY CO. LTD. (CHINA): SNAPSHOT
TABLE 128. DINGXI LONGHAI DAIRY CO. LTD. (CHINA): BUSINESS PERFORMANCE
TABLE 129. DINGXI LONGHAI DAIRY CO. LTD. (CHINA): PRODUCT PORTFOLIO
TABLE 130. DINGXI LONGHAI DAIRY CO. LTD. (CHINA): KEY STRATEGIC MOVES AND DEVELOPMENTS
TABLE 130. OTHER MAJOR PLAYERS: SNAPSHOT
TABLE 131. OTHER MAJOR PLAYERS: BUSINESS PERFORMANCE
TABLE 132. OTHER MAJOR PLAYERS: PRODUCT PORTFOLIO
TABLE 133. OTHER MAJOR PLAYERS: KEY STRATEGIC MOVES AND DEVELOPMENTS
LIST OF FIGURES
FIGURE 001. YEARS CONSIDERED FOR ANALYSIS
FIGURE 002. SCOPE OF THE STUDY
FIGURE 003. INULIN MARKET OVERVIEW BY REGIONS
FIGURE 004. PORTER'S FIVE FORCES ANALYSIS
FIGURE 005. BARGAINING POWER OF SUPPLIERS
FIGURE 006. COMPETITIVE RIVALRYFIGURE 007. THREAT OF NEW ENTRANTS
FIGURE 008. THREAT OF SUBSTITUTES
FIGURE 009. VALUE CHAIN ANALYSIS
FIGURE 010. PESTLE ANALYSIS
FIGURE 011. INULIN MARKET OVERVIEW BY NATURE
FIGURE 012. ORGANIC MARKET OVERVIEW (2016-2030)
FIGURE 013. CONVENTIONAL MARKET OVERVIEW (2016-2030)
FIGURE 014. INULIN MARKET OVERVIEW BY SOURCE
FIGURE 015. AGAVEINULIN MARKET OVERVIEW (2016-2030)
FIGURE 016. CHICORYINULIN MARKET OVERVIEW (2016-2030)
FIGURE 017. JERUSALEM ARTICHOKE MARKET OVERVIEW (2016-2030)
FIGURE 018. INULIN MARKET OVERVIEW BY FORM
FIGURE 019. POWDER MARKET OVERVIEW (2016-2030)
FIGURE 020. LIQUID MARKET OVERVIEW (2016-2030)
FIGURE 021. INULIN MARKET OVERVIEW BY APPLICATION
FIGURE 022. FOOD & BEVERAGE MARKET OVERVIEW (2016-2030)
FIGURE 023. DIETARY SUPPLEMENTS MARKET OVERVIEW (2016-2030)
FIGURE 024. PHARMACEUTICALS MARKET OVERVIEW (2016-2030)
FIGURE 025. ANIMAL FEED MARKET OVERVIEW (2016-2030)
FIGURE 026. NORTH AMERICA INULIN MARKET OVERVIEW BY COUNTRY (2016-2030)
FIGURE 027. EASTERN EUROPE INULIN MARKET OVERVIEW BY COUNTRY (2016-2030)
FIGURE 028. WESTERN EUROPE INULIN MARKET OVERVIEW BY COUNTRY (2016-2030)
FIGURE 029. ASIA PACIFIC INULIN MARKET OVERVIEW BY COUNTRY (2016-2030)
FIGURE 030. MIDDLE EAST & AFRICA INULIN MARKET OVERVIEW BY COUNTRY (2016-2030)
FIGURE 031. SOUTH AMERICA INULIN MARKET OVERVIEW BY COUNTRY (2016-2030)
Frequently Asked Questions :
The forecast period in the Inulin Market research report is 2024-2032.
Beneo (Belgium), Cosucra (Belgium), Sensus (Netherlands), Ingredion (USA), Cargill (USA), The Tierra Group (Mexico), Qinghai Weiyi Biotechnology Co., Ltd. (China), Jiangxi Inulin Powder Co., Ltd. (China), Jarrow Formulas (USA), NutriScience Innovations LLC (USA), AM Nutrition (Spain), Now Foods (USA), Goya Foods (USA), The Green Labs LLC (USA), Shaanxi Jintai Biological Engineering Co., Ltd. (China), JF Naturals (USA), Ciranda (USA), Raftiline (France), Taiyo International (Japan), Frutalose (Belgium), Jiaxing Renze Import & Export Co., Ltd. (China), AHD International LLC (USA), Organic Technologies (USA), Pure Circle (Malaysia), Hebei Huaxu Pharmaceutical Co., Ltd. (China), and Other Major Players.
The Inulin Market is segmented into Nature, Source, Form, Application, and region. By Nature, the market is categorized into Organic and conventional. By Source, the market is categorized into Agaveinulin, Chicoryinulin, and Jerusalem Artichoke. By Source, the market is categorized into Powder and liquid. By Application, the market is categorized into Food and beverage, Dietary Supplements, Pharmaceuticals, and Animal Feed. By region, it is analyzed across North America (U.S.; Canada; Mexico), Europe (Germany; U.K.; France; Italy; Russia; Spain, etc.), Asia-Pacific (China; India; Japan; Southeast Asia, etc.), South America (Brazil; Argentina, etc.), Middle East & Africa (Saudi Arabia; South Africa, etc.).
Inulin is a type of soluble fiber found in certain plants, particularly in the roots or rhizomes of vegetables like chicory, Jerusalem artichokes, and onions. It's a polysaccharide, meaning it's made up of multiple sugar molecules. Despite being a carbohydrate, inulin is not digested or absorbed in the small intestine like most sugars. Instead, it travels to the colon, where it serves as a prebiotic, nourishing beneficial bacteria in the gut. This fermentation process produces short-chain fatty acids, which offer various health benefits, including improved digestion, enhanced immune function, and potentially even lowering the risk of certain diseases like colon cancer.
Inulin Market Size Was Valued at USD 1.72 Billion in 2023, and is Projected to Reach USD 2.91 Billion by 2032, Growing at a CAGR of 6.8% From 2024-2032.


