


Insight as a Service Market Synopsis
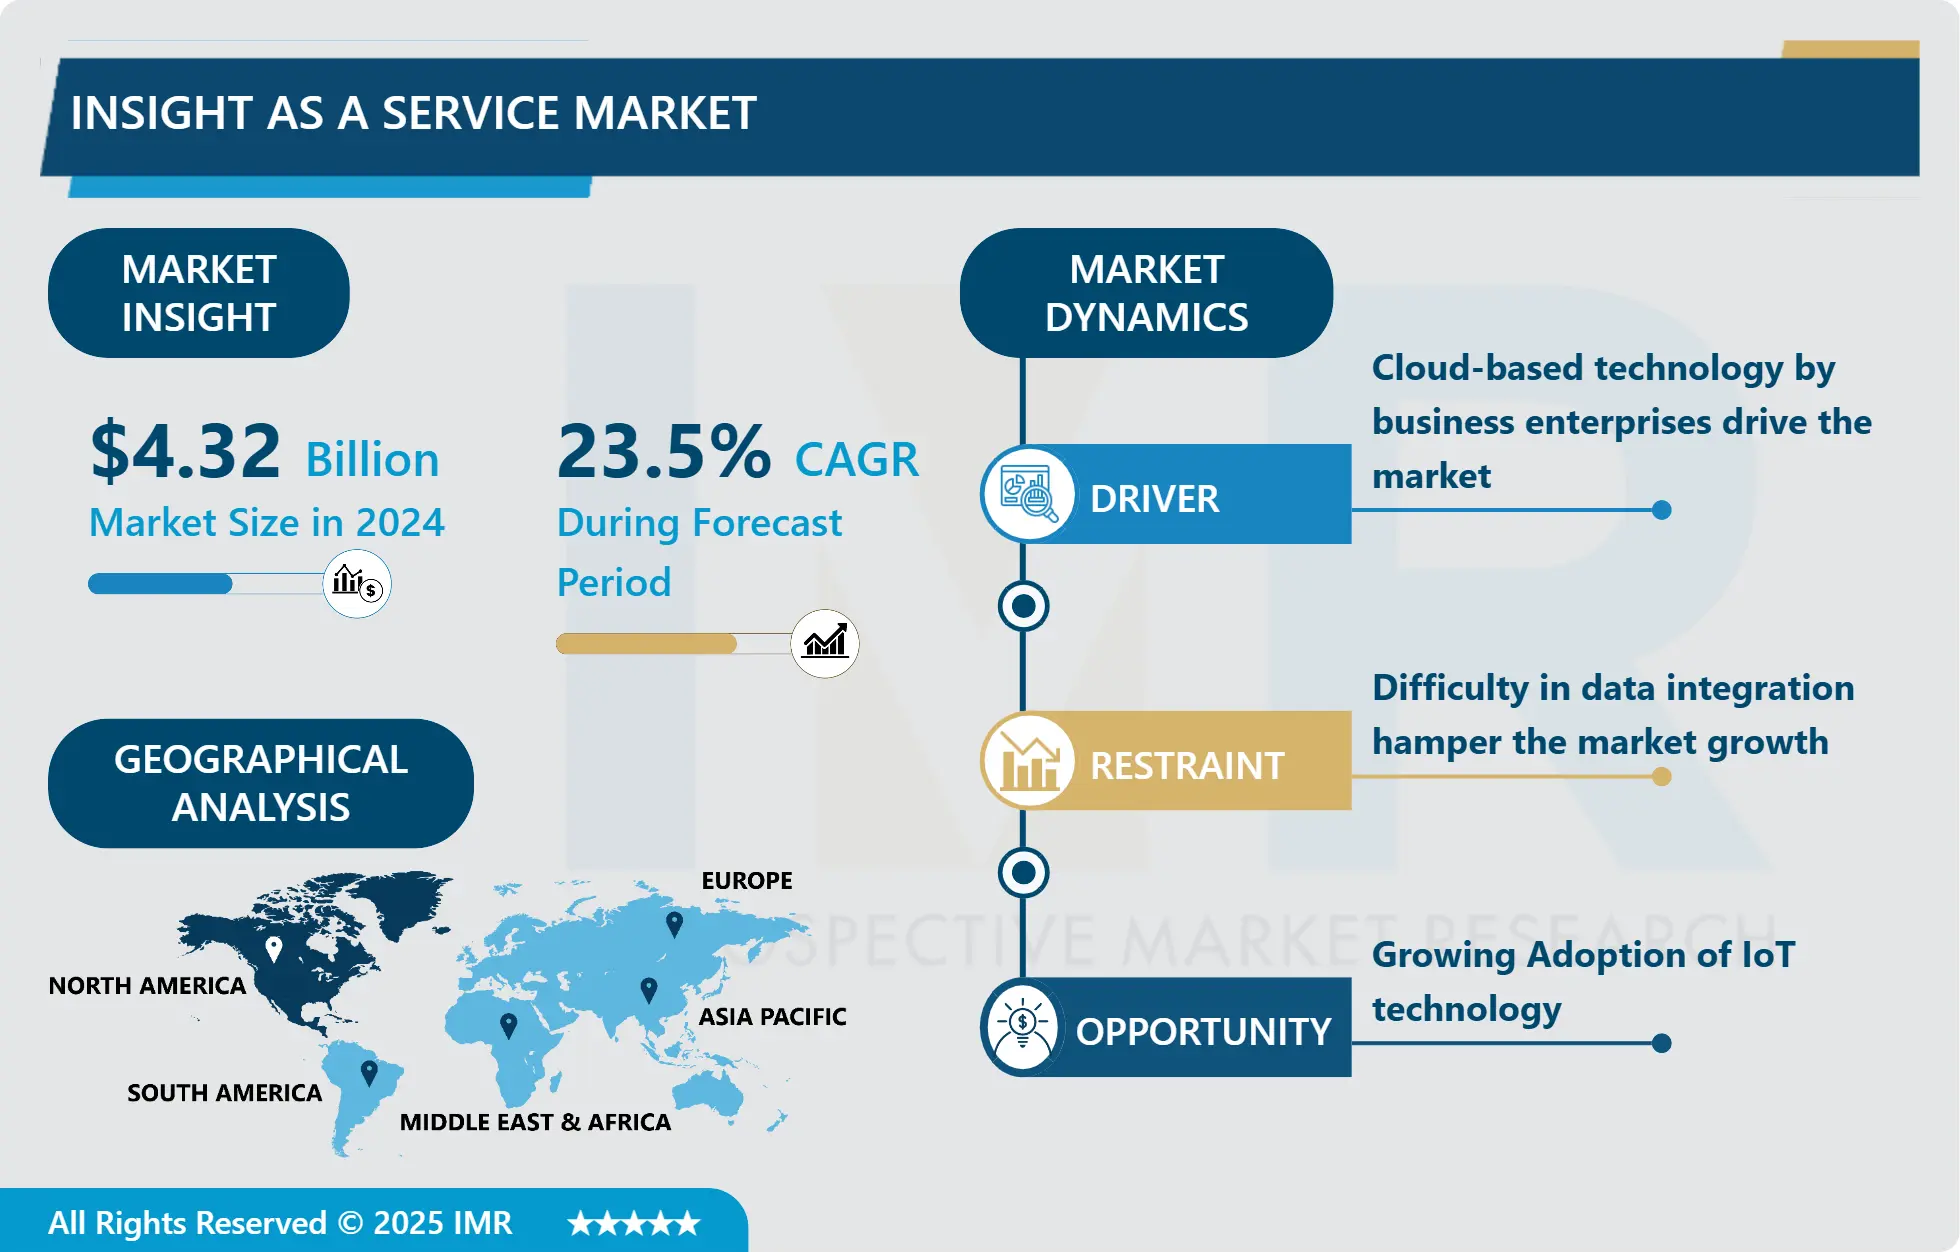
Insight as a Service Market Size Was Valued at USD 4.32 Billion in 2024, and is Projected to Reach USD 23.38 Billion by 2032, Growing at a CAGR of 23.5% From 2025-2032.
Insight as a Service has been defined as a cloud-based service offering that allows business organizations to have access to sophisticated analytical models and business intelligence while they do not have to worry about the underlying physical infrastructure or expertise. It encompasses aggregation, manipulation, and storage of data across various channels to provide valuable information to organizations to help them in their decision-making processes, efficient achievement of organizational objectives, and alignment of strategic plans. Through the use of advanced analysis tools and methods, intelligently integrated into the infrastructure services, the IaaS empowers organizations to gain fuller insight into and utilization of their data, promoting efficiency, creativity, and market advantage.
Over the past few years, the prominence of big data analysis has become increasingly notable. Insights-as-a-Service solutions offer insights to organizations in an attempt to generate incomparable value propositions. Some of the functionalities that it offers to companies include prediction, business insight, company data like stocks and financial resources, keyword performance, employee and business process details, and results.
Such insights ensure that the company can be able to have an increase in the sale of the products and services. It also employs different datatypes including company datatypes, usage datatypes, and syndicated datatypes and offers information on the return on investment and key decisions which should be taken in future. Thus, the Insights-as-a-Service solutions enable companies/sme to level up to achieve the business objectives in the later years, which in turn driving the demand for the insights-as-a-service platform.
This growth is expected because insights-as-a-service could witness an increased adoption due to the higher levels of IoT technology integration across different industries. It is a cloud-based model, which is known as insight-as-a-service and is designed for businesses that need help in getting a higher return of their investments. Enterprise are likely to fuel more insights-asa-service outcomes following the adoption of integrated technology such as 5G and 4G Internet.
Embracing cutting edge technologies for knowledge creation, innovation implementation, and management in the private, public and social domains including; Artificial Intelligence, Machine Learning and other digital technologies that are redefining the frontiers of application.

Insight as a Service Market Trend Analysis
Rise in Customer management in different companies drive the market
- The various customer management initiatives across different companies are expected to fuel growth in the Insight as a Service market, and thus increase market demand for Insight as a Service in the following year by identifying the significance of enhancing the understanding and individual esteem for customers. With managing customer satisfaction, loyalty and retention being crucial objectives of the modern Enterprise, there is strong focus on using data to influence products, services, and marketing. Also referred to as IAAS, Insight as a Service is a business-oriented service that equips enterprises with sophisticated analytics solutions to come up with appropriate conclusions related to their customers. This shifting in business priority towards customer satisfaction makes Insight as a Service effective and valuable solution which helps the companies to act as more competitive customer-driven organizations.
Rise in the adoption of IoT technology across diverse industries
- The progress made in the integration of smart devices across different sectors is expected to further boost the Insight as a Service market and create higher demand in the next year as these devices generate a large volume of data that requires monitoring and comprehension. Smart devices are always collecting data on the various parameters in tactical areas, from manufacturing operations to retail customer trends. This growing generation of data requires powerful analytical tools to generate useful information for decision making and to improve operational efficiency. The need for Insight as a Service increases as businesses try to utilize this data for better cost optimization, top-line growth and new business models rendering assistance to organizations in achieving these goals without the need of having existing domain expertise and infrastructure.
Insight as a Service Market Segment Analysis:
Insight as a Service Market is segmented based on Solution, Application, Enterprise Size, and Industry.
By Application, Customer Analytics segment is expected to dominate the market during the forecast period
- The customer analytics segment occupied the share of the market about 27.1% in 2022 due to the new entrants offering insights-as-a-service and due to the recent years’ developments by the key market players towards cloud based solutions.
- Over the years, the complexity and popularity of insights-as-a-service solutions in businesses, finances, retail, media, and telecommunications has risen. According to the above study, the investment in other cloud-based and insights-as-a-service solutions are projected to rise because of the strict regulatory measures initiated by governments across the developed and development nations to encourage start-ups.
- Hence, the growth of new vendors and rising investment by major players in cloud-based solutions for operations are projected to stoke the adoption of insights-as-service solutions.
By Enterprise Size, Large Enterprises segment held the largest share in 2024
- Among these segments, the large enterprises’ segment holds the potential to generate the highest revenue of 71%. 6 % global demand in insight-as-s-Service by the year 2022.
- The insights derived makes IaaS the most effective path for the company because it increases the returns on all investments. Furthermore, it is evident that initial investment in IaaS is cheaper compared to conventional approaches to data analysis.
- As a result, due to lower up-front cost and high ROI of insights-as-a-service solutions there is increased adoption of insights-as-s-service in the large enterprise’s segment.
Insight as a Service Market Regional Insights:
North America is Expected to Dominate the Market Over the Forecast period
- The global Insight as a Service market is likely to remain dominated by North America in the next year because of a number of factors. This area has a large number of key tech titans and strong underlying IT support, which helps the implementation of innovative data analysis and AI systems. Further, there is an increasing emphasis on IT innovation in numerous sectors to enhance competitive advantage and operational effectiveness. The large number of enterprises and high demand for reliable information and BI for decision-making also contribute to dominating position of North America. However, new government policies and policies and increased investment in R & D are the factors that support the market for the region.
Active Key Players in the Insight as a Service Market
- Capgemini
- GoodData
- GAVS Technologies
- Oracle Corporation
- IBM Corporation
- Accenture
- Crediwatch
- Civica
- Analytics Wise
- Deloitte
- thinkbridge Software
- Totango
- 9Lenses
- JBara
- ACTICO GmbH, and Other Active Players
|
Global Insight as a Service Market |
|||
|
Base Year: |
2024 |
Forecast Period: |
2024-2032 |
|
Historical Data: |
2018 to 2023 |
Market Size in 2025: |
USD 4.32 Bn. |
|
Forecast Period 2025-32 CAGR: |
23.5% |
Market Size in 2032: |
USD 23.38 Bn. |
|
Segments Covered: |
By Solution |
|
|
|
By Application |
|
||
|
By Enterprise Size |
|
||
|
By End-User |
|
||
|
By Region |
|
||
|
Key Market Drivers: |
|
||
|
Key Market Restraints: |
|
||
|
Key Opportunities: |
|
||
|
Companies Covered in the report: |
|
||
Chapter 1: Introduction
1.1 Scope and Coverage
Chapter 2:Executive Summary
Chapter 3: Market Landscape
3.1 Market Dynamics
3.1.1 Drivers
3.1.2 Restraints
3.1.3 Opportunities
3.1.4 Challenges
3.2 Market Trend Analysis
3.3 PESTLE Analysis
3.4 Porter's Five Forces Analysis
3.5 Industry Value Chain Analysis
3.6 Ecosystem
3.7 Regulatory Landscape
3.8 Price Trend Analysis
3.9 Patent Analysis
3.10 Technology Evolution
3.11 Investment Pockets
3.12 Import-Export Analysis
Chapter 4: Insight as a Service Market by Solution (2018-2032)
4.1 Insight as a Service Market Snapshot and Growth Engine
4.2 Market Overview
4.3 Insights-as-a-Service Platform (SaaS-based)
4.3.1 Introduction and Market Overview
4.3.2 Historic and Forecasted Market Size in Value USD and Volume Units
4.3.3 Key Market Trends, Growth Factors, and Opportunities
4.3.4 Geographic Segmentation Analysis
4.4 Services
Chapter 5: Insight as a Service Market by Application (2018-2032)
5.1 Insight as a Service Market Snapshot and Growth Engine
5.2 Market Overview
5.3 Branding & Marketing Management
5.3.1 Introduction and Market Overview
5.3.2 Historic and Forecasted Market Size in Value USD and Volume Units
5.3.3 Key Market Trends, Growth Factors, and Opportunities
5.3.4 Geographic Segmentation Analysis
5.4 Supply Chain Analytics
5.5 Competition Benchmarking
5.6 Governance
5.7 Risk & Compliance
5.8 Customer Analytics
5.9 Others
Chapter 6: Insight as a Service Market by Enterprise Size (2018-2032)
6.1 Insight as a Service Market Snapshot and Growth Engine
6.2 Market Overview
6.3 Small & Medium Enterprises (SMEs)
6.3.1 Introduction and Market Overview
6.3.2 Historic and Forecasted Market Size in Value USD and Volume Units
6.3.3 Key Market Trends, Growth Factors, and Opportunities
6.3.4 Geographic Segmentation Analysis
6.4 Large Enterprises
Chapter 7: Insight as a Service Market by End-User (2018-2032)
7.1 Insight as a Service Market Snapshot and Growth Engine
7.2 Market Overview
7.3 BFSI
7.3.1 Introduction and Market Overview
7.3.2 Historic and Forecasted Market Size in Value USD and Volume Units
7.3.3 Key Market Trends, Growth Factors, and Opportunities
7.3.4 Geographic Segmentation Analysis
7.4 Retail & CPG
7.5 IT & Telecom
7.6 Media & Entertainment
7.7 Education
7.8 Healthcare and Life Sciences
7.9 Government
7.10 Manufacturing
7.11 Others
Chapter 8: Company Profiles and Competitive Analysis
8.1 Competitive Landscape
8.1.1 Competitive Benchmarking
8.1.2 Insight as a Service Market Share by Manufacturer (2024)
8.1.3 Industry BCG Matrix
8.1.4 Heat Map Analysis
8.1.5 Mergers and Acquisitions
8.2 ALCATEL LUCENT ENTERPRISE (FRANCE)
8.2.1 Company Overview
8.2.2 Key Executives
8.2.3 Company Snapshot
8.2.4 Role of the Company in the Market
8.2.5 Sustainability and Social Responsibility
8.2.6 Operating Business Segments
8.2.7 Product Portfolio
8.2.8 Business Performance
8.2.9 Key Strategic Moves and Recent Developments
8.2.10 SWOT Analysis
8.3 AVAYA INC. (UNITED STATES)
8.4 CISCO SYSTEMS INC. (UNITED STATES)
8.5 ENGHOUSE INTERACTIVE INC. (CANADA)
8.6 FIVE9 INC. (UNITED STATES)
8.7 GENESYS (UNITED STATES)
8.8 MICROSOFT CORPORATION (UNITED STATES)
8.9 NICE INCONTACT (UNITED STATES)
8.10 SAP SE (GERMANY)
8.11 UNIFY INC (GERMANY)
8.12 AND OTHERS MAJOR PLAYERS.
Chapter 9: Global Insight as a Service Market By Region
9.1 Overview
9.2. North America Insight as a Service Market
9.2.1 Key Market Trends, Growth Factors and Opportunities
9.2.2 Top Key Companies
9.2.3 Historic and Forecasted Market Size by Segments
9.2.4 Historic and Forecasted Market Size by Solution
9.2.4.1 Insights-as-a-Service Platform (SaaS-based)
9.2.4.2 Services
9.2.5 Historic and Forecasted Market Size by Application
9.2.5.1 Branding & Marketing Management
9.2.5.2 Supply Chain Analytics
9.2.5.3 Competition Benchmarking
9.2.5.4 Governance
9.2.5.5 Risk & Compliance
9.2.5.6 Customer Analytics
9.2.5.7 Others
9.2.6 Historic and Forecasted Market Size by Enterprise Size
9.2.6.1 Small & Medium Enterprises (SMEs)
9.2.6.2 Large Enterprises
9.2.7 Historic and Forecasted Market Size by End-User
9.2.7.1 BFSI
9.2.7.2 Retail & CPG
9.2.7.3 IT & Telecom
9.2.7.4 Media & Entertainment
9.2.7.5 Education
9.2.7.6 Healthcare and Life Sciences
9.2.7.7 Government
9.2.7.8 Manufacturing
9.2.7.9 Others
9.2.8 Historic and Forecast Market Size by Country
9.2.8.1 US
9.2.8.2 Canada
9.2.8.3 Mexico
9.3. Eastern Europe Insight as a Service Market
9.3.1 Key Market Trends, Growth Factors and Opportunities
9.3.2 Top Key Companies
9.3.3 Historic and Forecasted Market Size by Segments
9.3.4 Historic and Forecasted Market Size by Solution
9.3.4.1 Insights-as-a-Service Platform (SaaS-based)
9.3.4.2 Services
9.3.5 Historic and Forecasted Market Size by Application
9.3.5.1 Branding & Marketing Management
9.3.5.2 Supply Chain Analytics
9.3.5.3 Competition Benchmarking
9.3.5.4 Governance
9.3.5.5 Risk & Compliance
9.3.5.6 Customer Analytics
9.3.5.7 Others
9.3.6 Historic and Forecasted Market Size by Enterprise Size
9.3.6.1 Small & Medium Enterprises (SMEs)
9.3.6.2 Large Enterprises
9.3.7 Historic and Forecasted Market Size by End-User
9.3.7.1 BFSI
9.3.7.2 Retail & CPG
9.3.7.3 IT & Telecom
9.3.7.4 Media & Entertainment
9.3.7.5 Education
9.3.7.6 Healthcare and Life Sciences
9.3.7.7 Government
9.3.7.8 Manufacturing
9.3.7.9 Others
9.3.8 Historic and Forecast Market Size by Country
9.3.8.1 Russia
9.3.8.2 Bulgaria
9.3.8.3 The Czech Republic
9.3.8.4 Hungary
9.3.8.5 Poland
9.3.8.6 Romania
9.3.8.7 Rest of Eastern Europe
9.4. Western Europe Insight as a Service Market
9.4.1 Key Market Trends, Growth Factors and Opportunities
9.4.2 Top Key Companies
9.4.3 Historic and Forecasted Market Size by Segments
9.4.4 Historic and Forecasted Market Size by Solution
9.4.4.1 Insights-as-a-Service Platform (SaaS-based)
9.4.4.2 Services
9.4.5 Historic and Forecasted Market Size by Application
9.4.5.1 Branding & Marketing Management
9.4.5.2 Supply Chain Analytics
9.4.5.3 Competition Benchmarking
9.4.5.4 Governance
9.4.5.5 Risk & Compliance
9.4.5.6 Customer Analytics
9.4.5.7 Others
9.4.6 Historic and Forecasted Market Size by Enterprise Size
9.4.6.1 Small & Medium Enterprises (SMEs)
9.4.6.2 Large Enterprises
9.4.7 Historic and Forecasted Market Size by End-User
9.4.7.1 BFSI
9.4.7.2 Retail & CPG
9.4.7.3 IT & Telecom
9.4.7.4 Media & Entertainment
9.4.7.5 Education
9.4.7.6 Healthcare and Life Sciences
9.4.7.7 Government
9.4.7.8 Manufacturing
9.4.7.9 Others
9.4.8 Historic and Forecast Market Size by Country
9.4.8.1 Germany
9.4.8.2 UK
9.4.8.3 France
9.4.8.4 The Netherlands
9.4.8.5 Italy
9.4.8.6 Spain
9.4.8.7 Rest of Western Europe
9.5. Asia Pacific Insight as a Service Market
9.5.1 Key Market Trends, Growth Factors and Opportunities
9.5.2 Top Key Companies
9.5.3 Historic and Forecasted Market Size by Segments
9.5.4 Historic and Forecasted Market Size by Solution
9.5.4.1 Insights-as-a-Service Platform (SaaS-based)
9.5.4.2 Services
9.5.5 Historic and Forecasted Market Size by Application
9.5.5.1 Branding & Marketing Management
9.5.5.2 Supply Chain Analytics
9.5.5.3 Competition Benchmarking
9.5.5.4 Governance
9.5.5.5 Risk & Compliance
9.5.5.6 Customer Analytics
9.5.5.7 Others
9.5.6 Historic and Forecasted Market Size by Enterprise Size
9.5.6.1 Small & Medium Enterprises (SMEs)
9.5.6.2 Large Enterprises
9.5.7 Historic and Forecasted Market Size by End-User
9.5.7.1 BFSI
9.5.7.2 Retail & CPG
9.5.7.3 IT & Telecom
9.5.7.4 Media & Entertainment
9.5.7.5 Education
9.5.7.6 Healthcare and Life Sciences
9.5.7.7 Government
9.5.7.8 Manufacturing
9.5.7.9 Others
9.5.8 Historic and Forecast Market Size by Country
9.5.8.1 China
9.5.8.2 India
9.5.8.3 Japan
9.5.8.4 South Korea
9.5.8.5 Malaysia
9.5.8.6 Thailand
9.5.8.7 Vietnam
9.5.8.8 The Philippines
9.5.8.9 Australia
9.5.8.10 New Zealand
9.5.8.11 Rest of APAC
9.6. Middle East & Africa Insight as a Service Market
9.6.1 Key Market Trends, Growth Factors and Opportunities
9.6.2 Top Key Companies
9.6.3 Historic and Forecasted Market Size by Segments
9.6.4 Historic and Forecasted Market Size by Solution
9.6.4.1 Insights-as-a-Service Platform (SaaS-based)
9.6.4.2 Services
9.6.5 Historic and Forecasted Market Size by Application
9.6.5.1 Branding & Marketing Management
9.6.5.2 Supply Chain Analytics
9.6.5.3 Competition Benchmarking
9.6.5.4 Governance
9.6.5.5 Risk & Compliance
9.6.5.6 Customer Analytics
9.6.5.7 Others
9.6.6 Historic and Forecasted Market Size by Enterprise Size
9.6.6.1 Small & Medium Enterprises (SMEs)
9.6.6.2 Large Enterprises
9.6.7 Historic and Forecasted Market Size by End-User
9.6.7.1 BFSI
9.6.7.2 Retail & CPG
9.6.7.3 IT & Telecom
9.6.7.4 Media & Entertainment
9.6.7.5 Education
9.6.7.6 Healthcare and Life Sciences
9.6.7.7 Government
9.6.7.8 Manufacturing
9.6.7.9 Others
9.6.8 Historic and Forecast Market Size by Country
9.6.8.1 Turkiye
9.6.8.2 Bahrain
9.6.8.3 Kuwait
9.6.8.4 Saudi Arabia
9.6.8.5 Qatar
9.6.8.6 UAE
9.6.8.7 Israel
9.6.8.8 South Africa
9.7. South America Insight as a Service Market
9.7.1 Key Market Trends, Growth Factors and Opportunities
9.7.2 Top Key Companies
9.7.3 Historic and Forecasted Market Size by Segments
9.7.4 Historic and Forecasted Market Size by Solution
9.7.4.1 Insights-as-a-Service Platform (SaaS-based)
9.7.4.2 Services
9.7.5 Historic and Forecasted Market Size by Application
9.7.5.1 Branding & Marketing Management
9.7.5.2 Supply Chain Analytics
9.7.5.3 Competition Benchmarking
9.7.5.4 Governance
9.7.5.5 Risk & Compliance
9.7.5.6 Customer Analytics
9.7.5.7 Others
9.7.6 Historic and Forecasted Market Size by Enterprise Size
9.7.6.1 Small & Medium Enterprises (SMEs)
9.7.6.2 Large Enterprises
9.7.7 Historic and Forecasted Market Size by End-User
9.7.7.1 BFSI
9.7.7.2 Retail & CPG
9.7.7.3 IT & Telecom
9.7.7.4 Media & Entertainment
9.7.7.5 Education
9.7.7.6 Healthcare and Life Sciences
9.7.7.7 Government
9.7.7.8 Manufacturing
9.7.7.9 Others
9.7.8 Historic and Forecast Market Size by Country
9.7.8.1 Brazil
9.7.8.2 Argentina
9.7.8.3 Rest of SA
Chapter 10 Analyst Viewpoint and Conclusion
10.1 Recommendations and Concluding Analysis
10.2 Potential Market Strategies
Chapter 11 Research Methodology
11.1 Research Process
11.2 Primary Research
11.3 Secondary Research
|
Global Insight as a Service Market |
|||
|
Base Year: |
2024 |
Forecast Period: |
2024-2032 |
|
Historical Data: |
2018 to 2023 |
Market Size in 2025: |
USD 4.32 Bn. |
|
Forecast Period 2025-32 CAGR: |
23.5% |
Market Size in 2032: |
USD 23.38 Bn. |
|
Segments Covered: |
By Solution |
|
|
|
By Application |
|
||
|
By Enterprise Size |
|
||
|
By End-User |
|
||
|
By Region |
|
||
|
Key Market Drivers: |
|
||
|
Key Market Restraints: |
|
||
|
Key Opportunities: |
|
||
|
Companies Covered in the report: |
|
||


