


Income Protection Insurance Market Synopsis
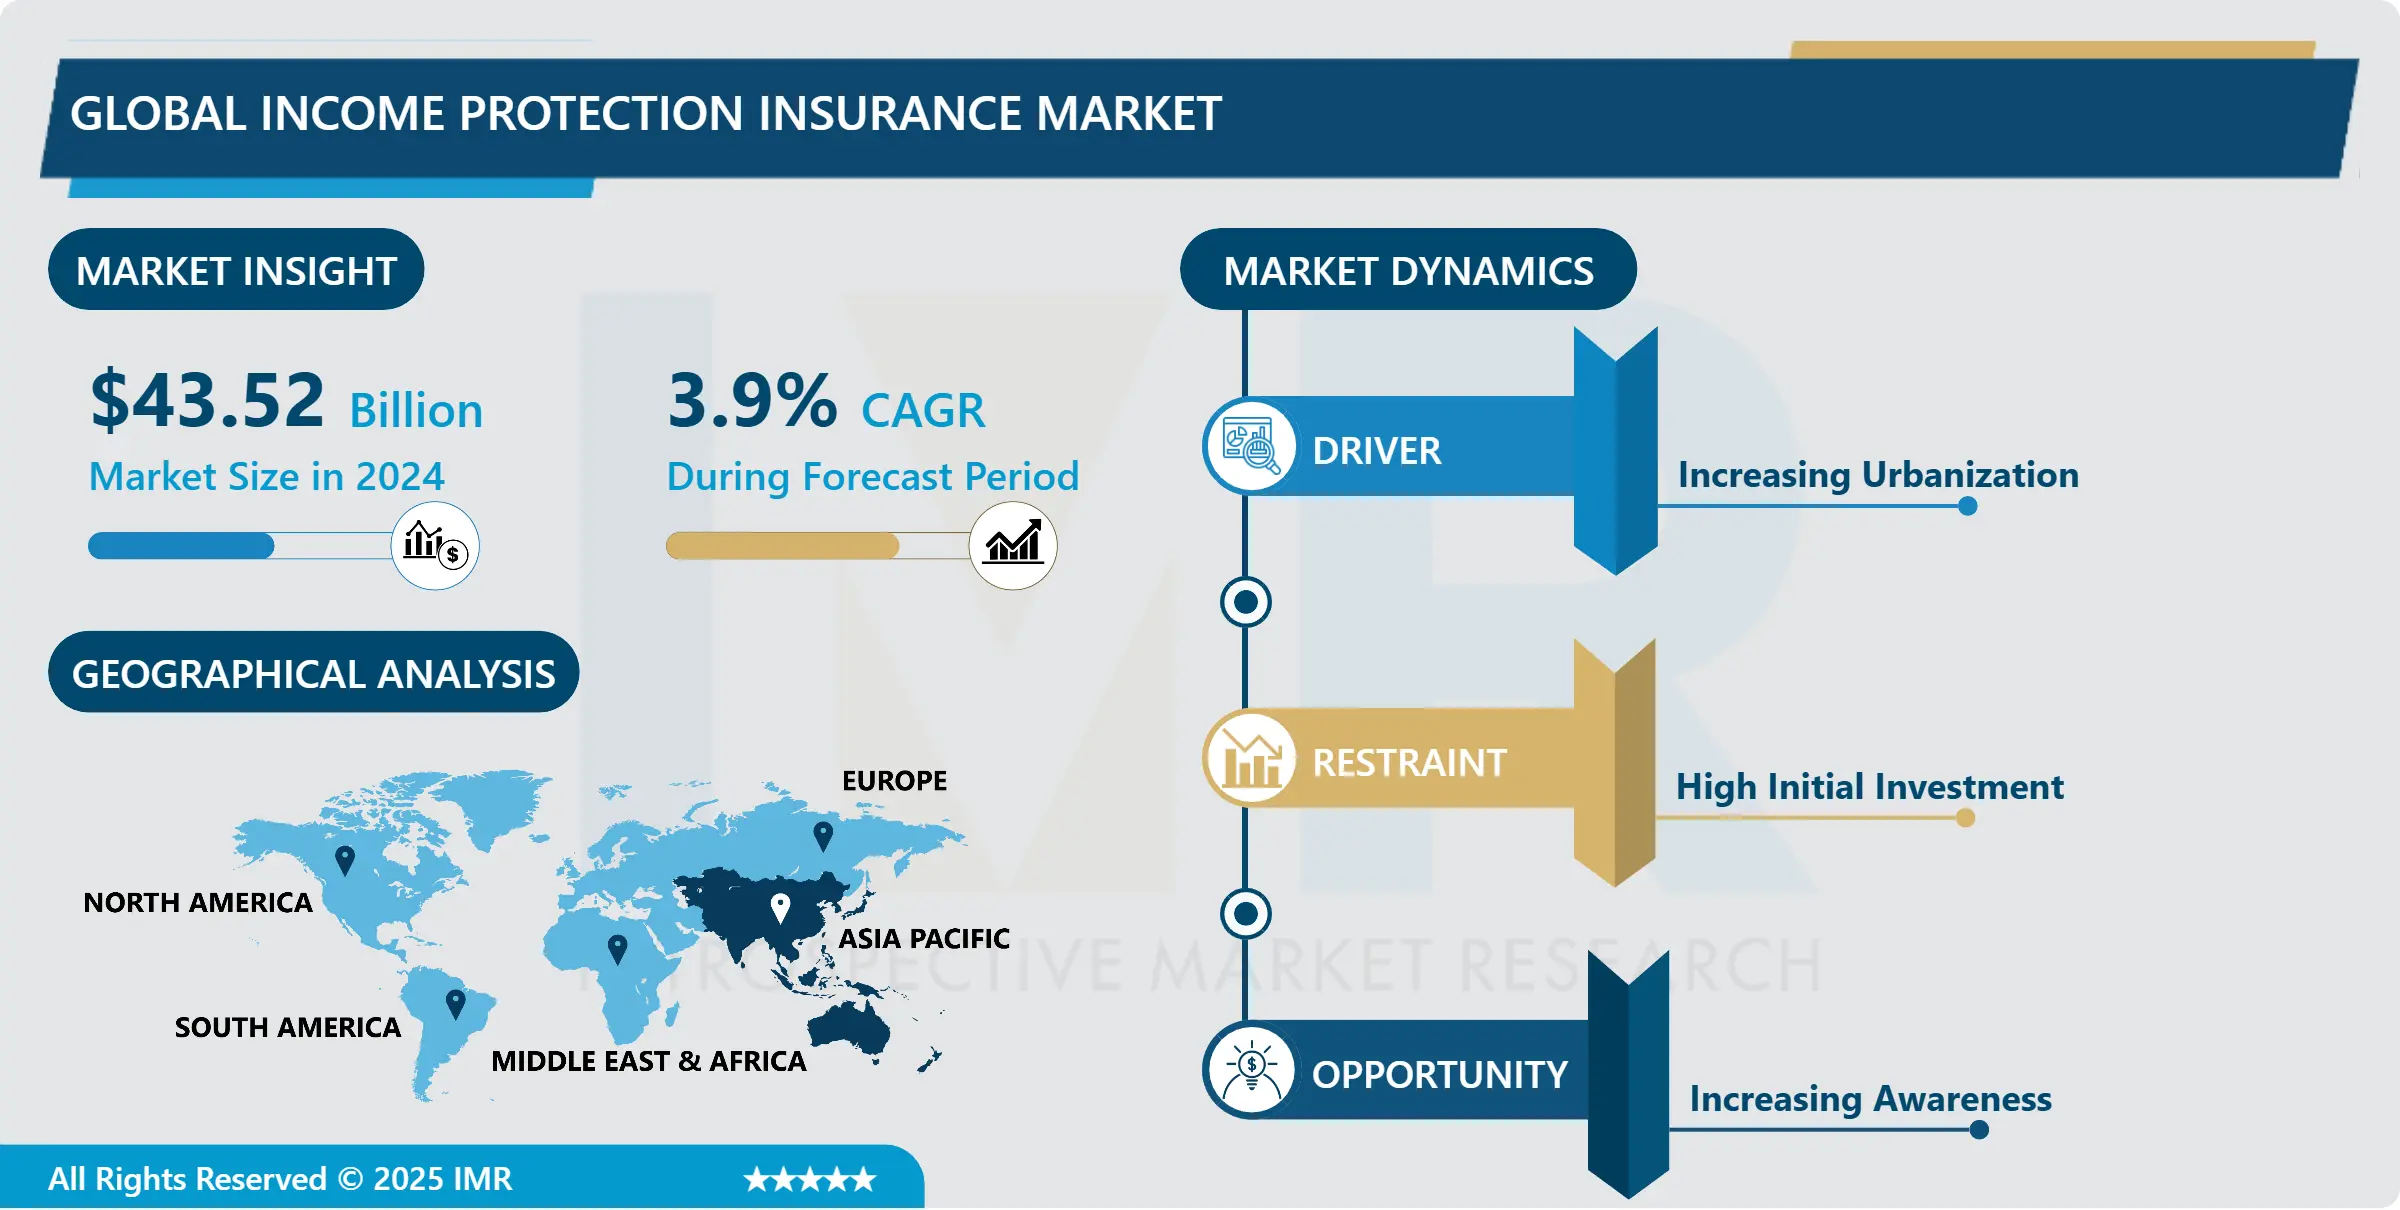
Income Protection Insurance Market Size Was Valued at USD 43.52 Billion in 2024 and is Projected to Reach USD 59.10 Billion by 2032, Growing at a CAGR of 3.9% From 2025-2032.
Income Protection Insurance is a policy which has been developed that aims at providing policy holders with a financial cushion against any kind of loss of income from any form of disability, sickness or injury. This form of insurance usually entitles the policyholder to benefit in the form of a fixed proportion of their pre-occupational earnings with respect to the degree of disability to and for the time that the policyholder cannot be employed. It is unlike other insurance products that are targeted at different risks such as life or property and that has the role of preserving the client’s financial position because of providing the replacement of the policy holder’s income and thus allowing the policy holder to meet his/her several obligations including paying for mortgage, bills or for living costs. The market of Income Protection Insurance is on the constant shift in its dynamics, by various factors such as socioeconomic ones, demographics, and consumer habits. As consumers become more conscious of their finances coupled with the emerging emphasis on self-protection there has been a constant rise in the need for income protection products in the market. This position is further supported by increasing tendencies of illnesses, injuries, and disabilities, thereby raising concerns for good insurance to counteract cases of income loss.
Furthermore, there are processes concerning the structure of the global workforce, particularly when it comes to the broaden population of people who are employed under special conditions, like freelancers or those who are having a gig economy job. The changing nature of employment means that the need for income protection that can address the existing and emerging paradigms of earning has become more crucial. Moreover, with technological enhancements and the continuous growth of the healthcare industry, the chances of survival of critical lit ailments have also raised the need for insurance solutions linked to periods of disability and??? which offer not only the financial complement but also the recovery care packages. In these trends, insurers are aligning breakout data, analytics, and intelligence, and digital systems to improve underwriting, clienteles, and experiences. Still, some factors, including regulatory factors, pricing constraint, and awareness among the customers still play crucial roles in determining the future of the income protection insurance. In conclusion, it may be asserted that the markets of income protection insurances remain favorable for development and transformation for several reasons – the shift in consumer demands, new technologies, and increasingly focused attention on financial security and prosperity.

Income Protection Insurance Market Trend Analysis
Meeting Individual Needs Through Data-Driven Solutions
- In response to consumers' increasing desire for tailored coverage, insurers are leveraging data analytics to gain deeper insights into individual risk profiles and preferences. By analyzing vast amounts of data, including demographic information, lifestyle factors, and past claims history, insurers can better understand the unique needs of each policyholder. This data-driven approach allows insurers to develop more personalized products and services, offering flexibility in benefit structures, coverage periods, and add-ons such as redundancy protection. For example, insurers may use predictive modeling to assess the likelihood of certain events, such as job loss or disability, and adjust coverage options accordingly. This not only enhances the overall customer experience but also helps insurers mitigate risk by aligning coverage more closely with individual circumstances.
- Moreover, advancements in technology are enabling insurers to deliver these customizable products more efficiently and effectively. Digital platforms and online tools provide consumers with intuitive interfaces to explore different coverage options, adjust parameters, and receive instant quotes. Additionally, automation and machine learning algorithms streamline the underwriting process, allowing insurers to assess risk and customize policies in real-time. By harnessing the power of technology, insurers can offer greater choice and flexibility to consumers while also improving operational efficiency and reducing administrative overhead. Overall, the combination of data analytics and technology is driving a fundamental shift in the income protection insurance market, empowering consumers with tailored solutions that meet their evolving needs and preferences.
The Impact of Insurtech Innovations on Underwriting, Management, and Claims Processing
- The integration of technology into the insurance process has revolutionized the way policies are underwritten, managed, and claimed. Insurtech innovations, ranging from digital platforms to artificial intelligence (AI), have enabled insurers to streamline operations and enhance customer experiences. For instance, digital platforms provide policyholders with convenient access to their insurance information, allowing them to manage policies, submit claims, and track the status of their applications online. This shift towards digitalization not only improves efficiency but also fosters greater transparency and accessibility for consumers, empowering them to engage with their insurance providers more effectively.
- Furthermore, AI algorithms are playing a pivotal role in transforming key aspects of the insurance lifecycle. By leveraging machine learning techniques, insurers can automate manual processes, such as underwriting and claims assessment, leading to faster turnaround times and reduced administrative burdens. For example, AI-powered algorithms can analyze vast datasets to assess risk more accurately, enabling insurers to make data-driven decisions with greater precision. This not only expedites the application process but also enhances the accuracy of claims adjudication, resulting in faster payouts and improved customer satisfaction. Overall, the integration of technology, particularly AI, is reshaping the insurance landscape, driving operational efficiencies and delivering superior experiences for both insurers and policyholders alike.
Income Protection Insurance Market Segment Analysis:
Income Protection Insurance Market is Segmented based on Type and Application.
By Type, Long Term Income Protection Insurance segment is expected to dominate the market during the forecast period
- Long-term income protection insurance stands out as the dominant share within the income protection insurance market due to its comprehensive coverage and the invaluable peace of mind it offers individuals. Unlike short-term policies that provide only temporary relief, long-term protection ensures a sustained income stream over an extended period, often until retirement age. This extended coverage period resonates deeply with consumers, who seek stability and security in the face of life's uncertainties. By safeguarding against the prolonged loss of income resulting from illness, injury, or disability, long-term income protection empowers individuals to navigate challenges with confidence, knowing that their financial well-being remains intact. As such, the allure of long-term solutions that provide lasting security positions this segment as the cornerstone of the income protection insurance market.
- Furthermore, the dominance of long-term income protection insurance is underscored by the evolving landscape of health and wellness, where the prevalence of chronic illnesses and disabilities is on the rise. With longer life expectancies and shifting demographics, there's a heightened awareness among consumers regarding the potential risks associated with long-term incapacity to work. This growing understanding fuels the demand for comprehensive coverage that extends beyond short-term setbacks, driving more individuals to opt for long-term income protection solutions. As a result, insurance providers prioritize the development of robust long-term policies that cater to the evolving needs of consumers, further solidifying the dominant share of this segment within the income protection insurance market.
By Application, Men segment held the largest share in 2024
- While men traditionally held the largest share in the income protection insurance market, there's been a noticeable shift in recent years due to the increasing influence of women in the workforce. As more women actively participate in various industries and occupations, they've become a significant demographic for income protection products. This trend is further fueled by the narrowing gender pay gap and the rising recognition of women's financial independence and responsibility. With greater earning potential and career advancement opportunities, women are increasingly recognizing the importance of safeguarding their income against unforeseen circumstances such as illness, injury, or unemployment. Consequently, insurance providers are adapting their offerings and marketing strategies to resonate with the unique needs and preferences of female consumers, thereby tapping into this expanding market segment.
- Moreover, the growing awareness among women about the necessity of income protection insurance contributes to a more balanced distribution of market share between genders. As women become more informed about financial planning and risk management, they're actively seeking out insurance solutions that align with their long-term goals and aspirations. This shift signifies a broader societal change where women are taking proactive steps to secure their financial futures and assert their autonomy in matters of personal finance. Consequently, while men may still hold the largest share overall, the increasing influence of women in the income protection insurance market suggests a more equitable distribution of market share in the foreseeable future, reflecting the evolving dynamics of gender roles and financial decision-making.
Income Protection Insurance Regional Insights:
Asia-Pacific is Expected to Dominate the Market Over the Forecast period
- In the Asia-Pacific region, income protection insurance is poised to claim a dominant share of the insurance market landscape, driven by several compelling factors. The region's rapid economic growth, fueled by dynamic emerging markets such as China and India, has created a burgeoning middle class with increasing disposable income. As individuals in these countries aspire for financial security, there's a heightened interest in income protection products to safeguard against unforeseen risks such as illness, disability, or loss of employment. Moreover, the growing awareness of the importance of financial planning and risk management further accentuates the demand for income protection insurance. Market players are capitalizing on these opportunities by offering innovative products tailored to the diverse needs of consumers across the region.
- However, while the potential for income protection insurance in the Asia-Pacific region is immense, market players face significant challenges in navigating the diverse regulatory landscapes and cultural attitudes towards insurance. Varying levels of insurance penetration across countries present both opportunities and hurdles, requiring insurers to adapt their strategies accordingly. Moreover, regulatory complexities, including licensing requirements and compliance standards, add another layer of complexity to market entry and expansion efforts. To succeed in this competitive landscape, insurers must demonstrate agility, localize their offerings to resonate with cultural preferences, and forge strategic partnerships to overcome regulatory barriers. Despite these challenges, the Asia-Pacific region remains a fertile ground for income protection insurance, offering substantial growth prospects for insurers with a keen understanding of the market dynamics and a commitment to meeting the evolving needs of consumers.
Active Key Players in the Income Protection Insurance Market
- Aviva
- TAL
- AMP
- Zurich
- AIA
- OnePath
- AXA
- Suncorp
- Asteron Life
- Generali
- Allianz
- Manulife
- Westpac
- Sovereign
- CommInsure
- LISA Group
- AIG Life
- LV= Liverpool Victoria
- Fidelity Life
- Legal & General
- Royal London
- VitalityLifeX
- Other Active players
|
Global Income Protection Insurance Market |
|||
|
Base Year: |
2024 |
Forecast Period: |
2025-2032 |
|
Historical Data: |
2018 to 2023 |
Market Size in 2024: |
USD 43.52 Bn. |
|
Forecast Period 2024-32 CAGR: |
3.9% |
Market Size in 2032: |
USD 59.10 Bn. |
|
Segments Covered: |
By Type |
|
|
|
By Application |
|
||
|
By Region |
|
||
|
Key Market Drivers: |
|
||
|
Key Market Restraints: |
|
||
|
Key Opportunities: |
|
||
|
Companies Covered in the report: |
|
||
Chapter 1: Introduction
1.1 Scope and Coverage
Chapter 2:Executive Summary
Chapter 3: Market Landscape
3.1 Market Dynamics
3.1.1 Drivers
3.1.2 Restraints
3.1.3 Opportunities
3.1.4 Challenges
3.2 Market Trend Analysis
3.3 PESTLE Analysis
3.4 Porter's Five Forces Analysis
3.5 Industry Value Chain Analysis
3.6 Ecosystem
3.7 Regulatory Landscape
3.8 Price Trend Analysis
3.9 Patent Analysis
3.10 Technology Evolution
3.11 Investment Pockets
3.12 Import-Export Analysis
Chapter 4: Income Protection Insurance Market by Type (2018-2032)
4.1 Income Protection Insurance Market Snapshot and Growth Engine
4.2 Market Overview
4.3 Short Term Income Protection Insurance
4.3.1 Introduction and Market Overview
4.3.2 Historic and Forecasted Market Size in Value USD and Volume Units
4.3.3 Key Market Trends, Growth Factors, and Opportunities
4.3.4 Geographic Segmentation Analysis
4.4 Long Term Income Protection Insurance
Chapter 5: Income Protection Insurance Market by Application (2018-2032)
5.1 Income Protection Insurance Market Snapshot and Growth Engine
5.2 Market Overview
5.3 Men
5.3.1 Introduction and Market Overview
5.3.2 Historic and Forecasted Market Size in Value USD and Volume Units
5.3.3 Key Market Trends, Growth Factors, and Opportunities
5.3.4 Geographic Segmentation Analysis
5.4 Women
Chapter 6: Company Profiles and Competitive Analysis
6.1 Competitive Landscape
6.1.1 Competitive Benchmarking
6.1.2 Income Protection Insurance Market Share by Manufacturer (2024)
6.1.3 Industry BCG Matrix
6.1.4 Heat Map Analysis
6.1.5 Mergers and Acquisitions
6.2 CLARITYSOFT (DUBLIN
6.2.1 Company Overview
6.2.2 Key Executives
6.2.3 Company Snapshot
6.2.4 Role of the Company in the Market
6.2.5 Sustainability and Social Responsibility
6.2.6 Operating Business Segments
6.2.7 Product Portfolio
6.2.8 Business Performance
6.2.9 Key Strategic Moves and Recent Developments
6.2.10 SWOT Analysis
6.3 USA)
6.4 FRESHDESK (SAN MATEO
6.5 USA)
6.6 HATCHBUCK (NOW KNOWN AS BENCHMARKONE) (ST. LOUIS
6.7 USA)
6.8 HUBSPOT CRM (CAMBRIDGE
6.9 USA)
6.10 INFUSIONSOFT (NOW KNOWN AS KEAP) (CHANDLER
6.11 USA)
6.12 KIZEN (AUSTIN
6.13 USA)
6.14 LESS ANNOYING CRM (ST. LOUIS
6.15 USA)
6.16 NETSUITE (AUSTIN
6.17 USA)
6.18 PIPELINER CRM (LOS ANGELES
6.19 USA)
6.20 PROSPERWORKS CRM (NOW KNOWN AS COPPER) (SAN FRANCISCO
6.21 USA)
6.22 REALLY SIMPLE SYSTEMS (HAMPSHIRE
6.23 UK)
6.24 RESULTS CRM (CLIFTON PARK
6.25 USA)
6.26 SALESFORCE.COM (SAN FRANCISCO
6.27 USA)
6.28 SUPPORTBENCH (VANCOUVER
6.29 CANADA)
6.30 ZENDESK SELL (SAN FRANCISCO
6.31 USA)
6.32 OTHER KEY PLAYERS
6.33
Chapter 7: Global Income Protection Insurance Market By Region
7.1 Overview
7.2. North America Income Protection Insurance Market
7.2.1 Key Market Trends, Growth Factors and Opportunities
7.2.2 Top Key Companies
7.2.3 Historic and Forecasted Market Size by Segments
7.2.4 Historic and Forecasted Market Size by Type
7.2.4.1 Short Term Income Protection Insurance
7.2.4.2 Long Term Income Protection Insurance
7.2.5 Historic and Forecasted Market Size by Application
7.2.5.1 Men
7.2.5.2 Women
7.2.6 Historic and Forecast Market Size by Country
7.2.6.1 US
7.2.6.2 Canada
7.2.6.3 Mexico
7.3. Eastern Europe Income Protection Insurance Market
7.3.1 Key Market Trends, Growth Factors and Opportunities
7.3.2 Top Key Companies
7.3.3 Historic and Forecasted Market Size by Segments
7.3.4 Historic and Forecasted Market Size by Type
7.3.4.1 Short Term Income Protection Insurance
7.3.4.2 Long Term Income Protection Insurance
7.3.5 Historic and Forecasted Market Size by Application
7.3.5.1 Men
7.3.5.2 Women
7.3.6 Historic and Forecast Market Size by Country
7.3.6.1 Russia
7.3.6.2 Bulgaria
7.3.6.3 The Czech Republic
7.3.6.4 Hungary
7.3.6.5 Poland
7.3.6.6 Romania
7.3.6.7 Rest of Eastern Europe
7.4. Western Europe Income Protection Insurance Market
7.4.1 Key Market Trends, Growth Factors and Opportunities
7.4.2 Top Key Companies
7.4.3 Historic and Forecasted Market Size by Segments
7.4.4 Historic and Forecasted Market Size by Type
7.4.4.1 Short Term Income Protection Insurance
7.4.4.2 Long Term Income Protection Insurance
7.4.5 Historic and Forecasted Market Size by Application
7.4.5.1 Men
7.4.5.2 Women
7.4.6 Historic and Forecast Market Size by Country
7.4.6.1 Germany
7.4.6.2 UK
7.4.6.3 France
7.4.6.4 The Netherlands
7.4.6.5 Italy
7.4.6.6 Spain
7.4.6.7 Rest of Western Europe
7.5. Asia Pacific Income Protection Insurance Market
7.5.1 Key Market Trends, Growth Factors and Opportunities
7.5.2 Top Key Companies
7.5.3 Historic and Forecasted Market Size by Segments
7.5.4 Historic and Forecasted Market Size by Type
7.5.4.1 Short Term Income Protection Insurance
7.5.4.2 Long Term Income Protection Insurance
7.5.5 Historic and Forecasted Market Size by Application
7.5.5.1 Men
7.5.5.2 Women
7.5.6 Historic and Forecast Market Size by Country
7.5.6.1 China
7.5.6.2 India
7.5.6.3 Japan
7.5.6.4 South Korea
7.5.6.5 Malaysia
7.5.6.6 Thailand
7.5.6.7 Vietnam
7.5.6.8 The Philippines
7.5.6.9 Australia
7.5.6.10 New Zealand
7.5.6.11 Rest of APAC
7.6. Middle East & Africa Income Protection Insurance Market
7.6.1 Key Market Trends, Growth Factors and Opportunities
7.6.2 Top Key Companies
7.6.3 Historic and Forecasted Market Size by Segments
7.6.4 Historic and Forecasted Market Size by Type
7.6.4.1 Short Term Income Protection Insurance
7.6.4.2 Long Term Income Protection Insurance
7.6.5 Historic and Forecasted Market Size by Application
7.6.5.1 Men
7.6.5.2 Women
7.6.6 Historic and Forecast Market Size by Country
7.6.6.1 Turkiye
7.6.6.2 Bahrain
7.6.6.3 Kuwait
7.6.6.4 Saudi Arabia
7.6.6.5 Qatar
7.6.6.6 UAE
7.6.6.7 Israel
7.6.6.8 South Africa
7.7. South America Income Protection Insurance Market
7.7.1 Key Market Trends, Growth Factors and Opportunities
7.7.2 Top Key Companies
7.7.3 Historic and Forecasted Market Size by Segments
7.7.4 Historic and Forecasted Market Size by Type
7.7.4.1 Short Term Income Protection Insurance
7.7.4.2 Long Term Income Protection Insurance
7.7.5 Historic and Forecasted Market Size by Application
7.7.5.1 Men
7.7.5.2 Women
7.7.6 Historic and Forecast Market Size by Country
7.7.6.1 Brazil
7.7.6.2 Argentina
7.7.6.3 Rest of SA
Chapter 8 Analyst Viewpoint and Conclusion
8.1 Recommendations and Concluding Analysis
8.2 Potential Market Strategies
Chapter 9 Research Methodology
9.1 Research Process
9.2 Primary Research
9.3 Secondary Research
|
Global Income Protection Insurance Market |
|||
|
Base Year: |
2024 |
Forecast Period: |
2025-2032 |
|
Historical Data: |
2018 to 2023 |
Market Size in 2024: |
USD 43.52 Bn. |
|
Forecast Period 2024-32 CAGR: |
3.9% |
Market Size in 2032: |
USD 59.10 Bn. |
|
Segments Covered: |
By Type |
|
|
|
By Application |
|
||
|
By Region |
|
||
|
Key Market Drivers: |
|
||
|
Key Market Restraints: |
|
||
|
Key Opportunities: |
|
||
|
Companies Covered in the report: |
|
||


