


Higher Education Tools Market Synopsis
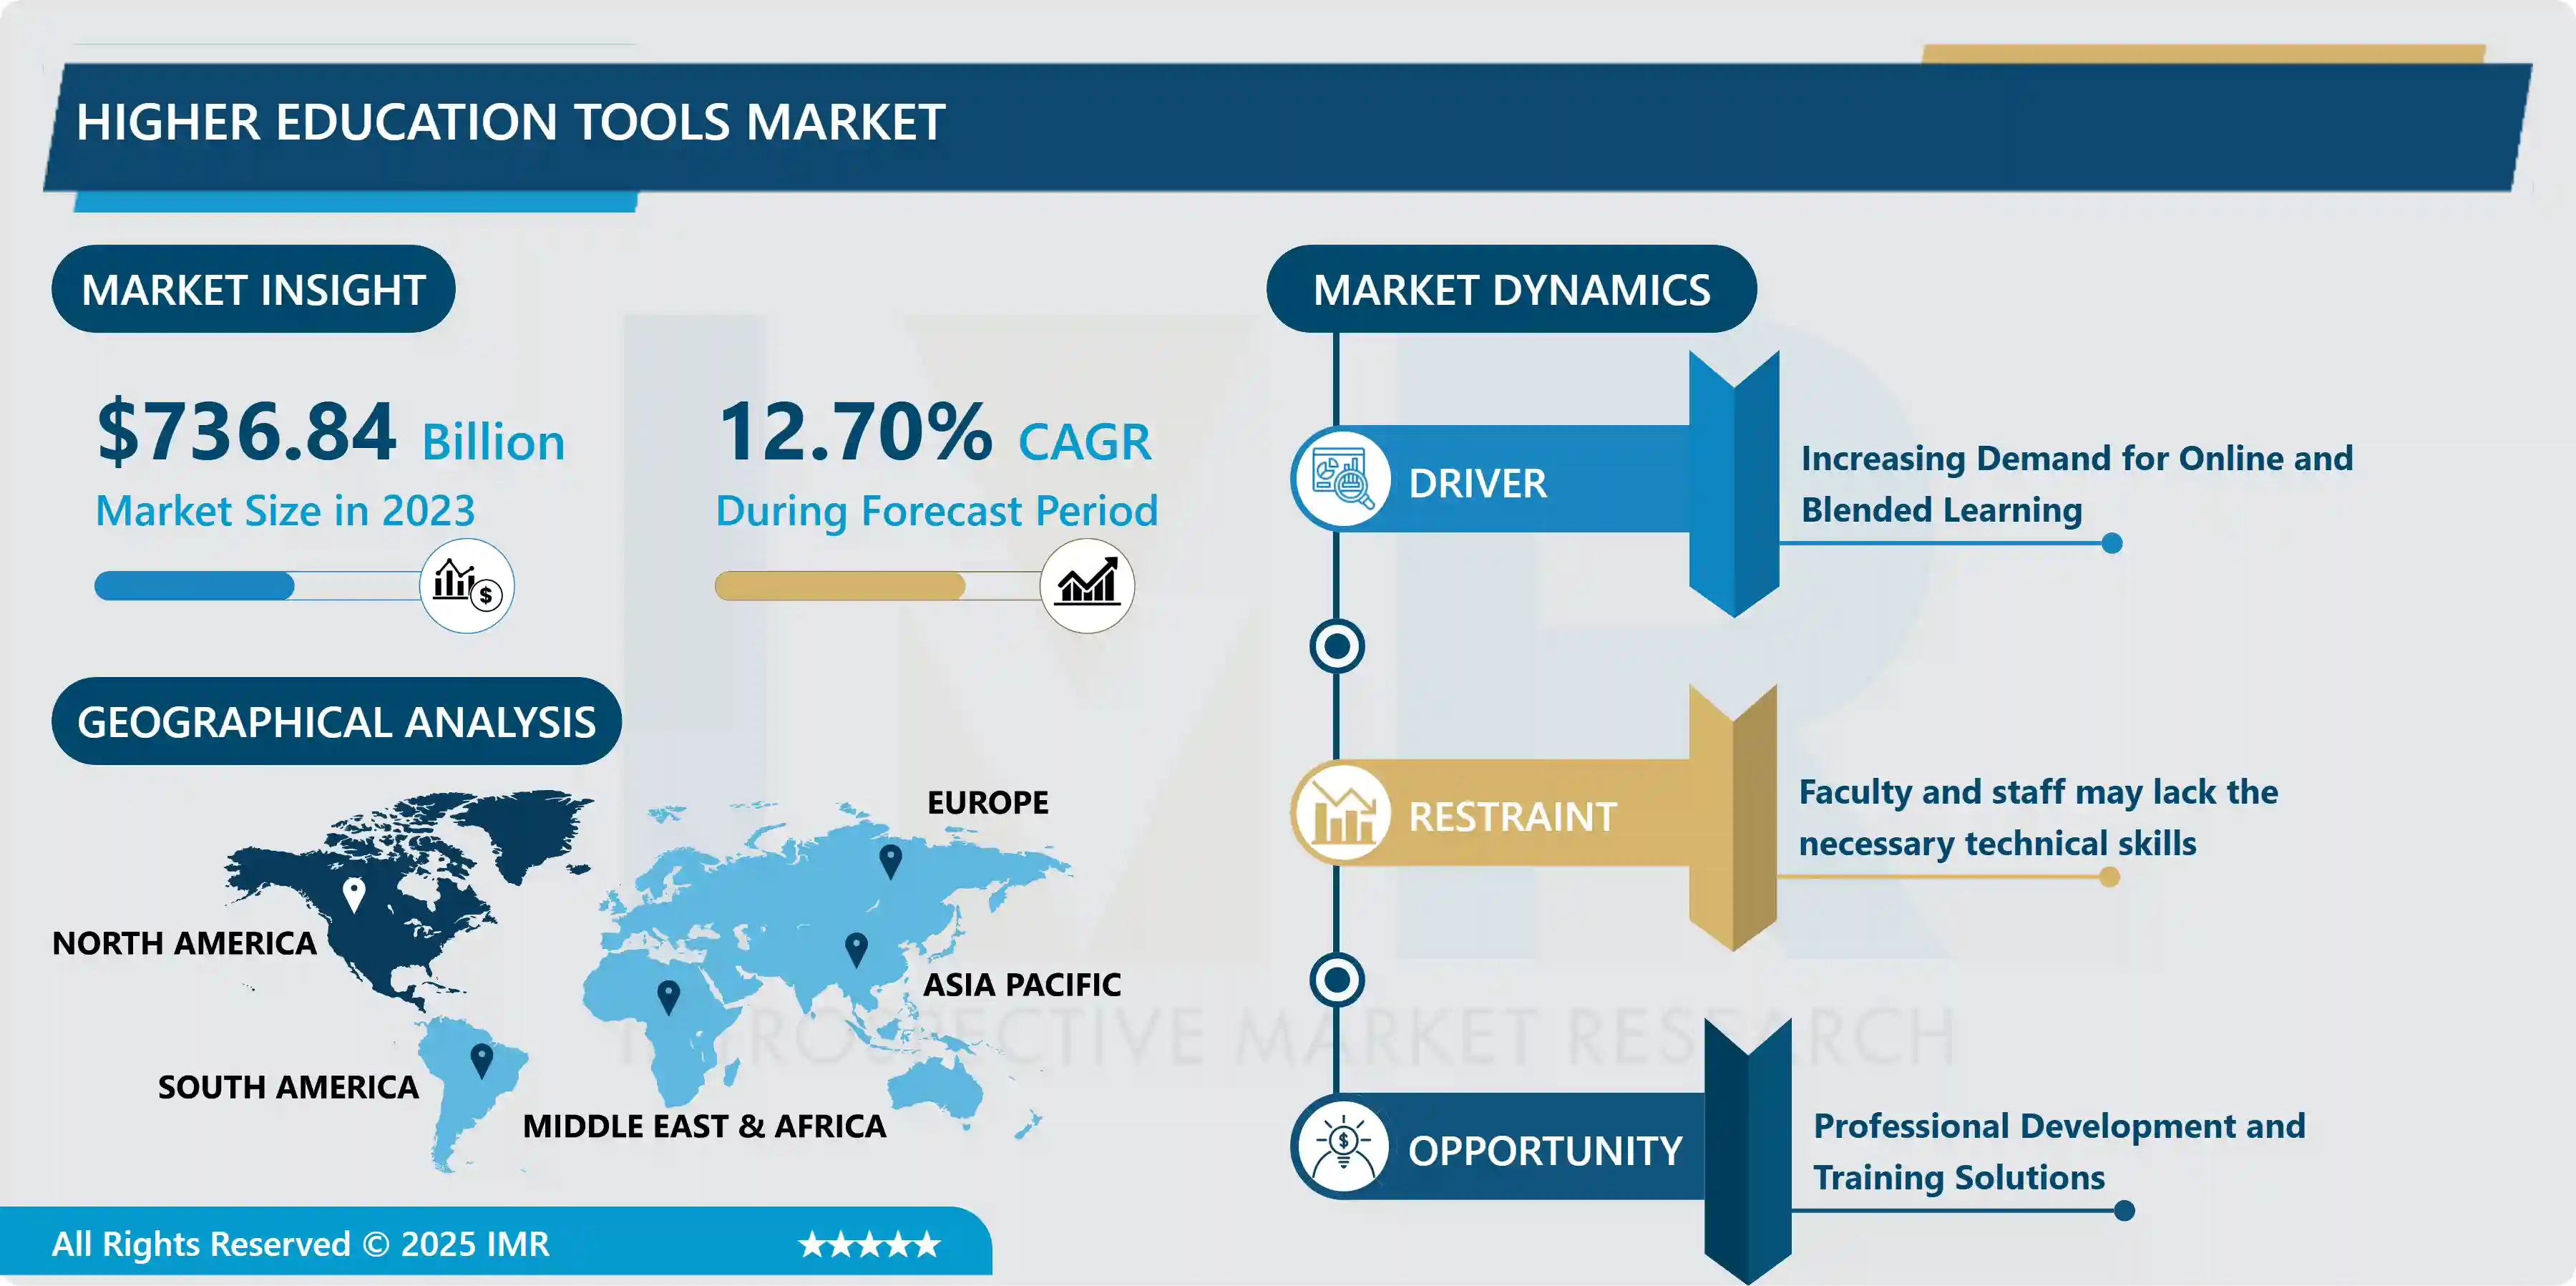
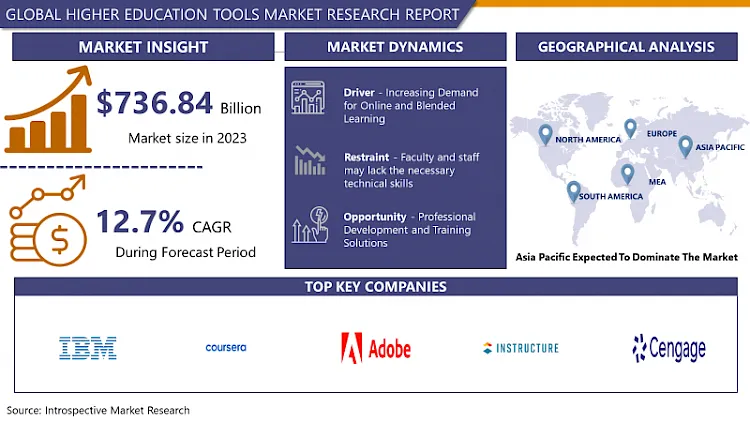
Higher Education Tools Market Size Was Valued at USD 736.84 Billion in 2023, and is Projected to Reach USD 1701.53 Billion by 2032, Growing at a CAGR of 12.70% From 2024-2032.
Higher education tools refer to various resources, platforms, technologies, and methodologies used to support teaching, learning, research, and administrative functions in colleges, universities, and other tertiary institutions. These tools encompass a wide range of digital and physical resources, including learning management systems (LMS), educational software, online libraries, academic databases, multimedia content, laboratory equipment, classroom technology, and administrative software. Higher education tools aim to enhance the quality, accessibility, and effectiveness of education delivery, facilitate collaboration and knowledge sharing, streamline administrative processes, and support academic and institutional objectives.
Higher education tools are essential for various aspects of teaching, learning, administration, and research in colleges, universities, and other institutions. They enable course delivery and management, online learning and distance education, student engagement and interaction, assessment and feedback processes, personalized learning and adaptive education, research and scholarly activities, administrative and institutional management, and professional development and continuing education programs. Learning Management Systems (LMS) facilitate course creation, organization, student enrollment, assignment distribution, grading, and communication.
Online learning and distance education tools provide virtual classrooms, multimedia resources, interactive course materials, discussion forums, and collaboration tools. Student engagement and interaction tools promote active learning, collaboration, peer-to-peer interaction, and community building. Assessment and feedback processes are supported by online testing platforms, assessment authoring tools, grading rubrics, plagiarism detection software, and peer review systems. Personalized learning and adaptive education tools use data analytics and algorithms to support student success and academic achievement. Administrative and institutional management tools support the operational functions of higher education institutions, improving efficiency and institutional effectiveness.
Higher education tools are in high demand due to digital transformation, remote learning, hybrid education, flexible learning environments, personalized learning experiences, enhanced collaboration and communication, data-driven decision-making, competitive advantage, and continuous professional development. The digital transformation is driven by technological advancements and changing student expectations, while remote learning and hybrid education models are accelerated by the COVID-19 pandemic. Tools like online platforms, digital content, collaboration tools, and assessment technologies help institutions deliver quality education and maintain continuity during disruptions.
Flexible learning environments cater to diverse student needs, preferences, and learning styles, while personalized learning experiences are provided by adaptive learning technologies and AI algorithms. Collaboration and communication tools facilitate seamless interaction among students, faculty, and staff, regardless of geographical location or time zone. Data-driven decision-making informs evidence-based decision-making, curriculum design, resource allocation, and student support services. Investment in innovative tools offers a competitive advantage by offering cutting-edge educational experiences, attracting top talent, and enhancing reputation.
Higher Education Tools Market Trend Analysis
Increasing Demand for Online and Blended Learning
- The rise of online education has led to a surge in demand for remote learning tools and technologies. These tools cater to students who prefer flexibility and convenience, offering a wide range of courses, degree programs, and certifications. Online learning offers flexible alternatives to traditional classroom-based education, allowing students to balance academic pursuits with work, family responsibilities, and other commitments.
- Online Learning also makes education more accessible to individuals with diverse needs and schedules, making it more accessible to those living in remote areas, individuals with disabilities, or non-traditional students. Online learning models are cost-effective, as students save on commuting, housing, and other expenses associated with campus-based programs, while institutions reduce overhead costs related to physical infrastructure and facilities.
- Online Learning also enables institutions to scale their online offerings and reach a global audience, providing personalized learning experiences tailored to individual needs. Online learning is increasingly used for professional development and lifelong learning. The COVID-19 pandemic has highlighted the importance of online and blended learning in ensuring continuity of teaching and learning during crises or emergencies.
Restraints
Faculty and Staff May Lack the Necessary Technical Skills
- The Higher Education Tools Market faces challenges due to the increasing reliance on technological tools for teaching, learning, administration, and research. These tools can be complex, requiring a certain level of technical proficiency. Faculty and staff members, particularly those from non-technical backgrounds or traditional teaching methods, may lack the necessary technical skills to effectively utilize these tools. Training programs and professional development initiatives may not always address the diverse needs and skill levels of faculty and staff, and participation may be limited due to time constraints or institutional priorities.
- Some faculty and staff members may exhibit resistance to change due to fear of the unknown, job security concerns, or perceived challenges in integrating technology with established teaching methodologies. This can impede the effectiveness and efficiency of various academic processes, hinder innovation, and put institutions at a competitive disadvantage compared to their peers.
Opportunity
Professional Development and Training Solutions
- Professional Development and Training Solutions are a growing market in higher education, focusing on enhancing the skills, knowledge, and competencies of faculty, staff, administrators, and students. These solutions include faculty development programs, staff training, leadership development initiatives, technology training, student success and career readiness programs, continuing education, and customized training solutions.
- Faculty development programs aim to improve teaching effectiveness, instructional design skills, technology integration, and pedagogical approaches. Staff training programs focus on job-specific competencies, customer service skills, leadership capabilities, and technical proficiencies. Leadership development programs focus on change management, conflict resolution, team building, decision-making, and performance evaluation. Technology training and digital literacy are also growing, focusing on learning management systems, multimedia authoring tools, online collaboration platforms, data analytics software, and cybersecurity awareness.
- Student success and career readiness programs aim to enhance academic skills, study habits, time management, career readiness, and employability. Continuing education programs provide opportunities for lifelong learners to acquire new skills, pursue personal interests, or advance their careers. Customized training solutions are designed in collaboration with institutional leaders to address unique challenges, strategic objectives, and performance improvement goals, ensuring relevance and effectiveness.
Challenges
Rapid technological advancements
- Modern vehicles have advanced electrical and electronic systems, requiring a complex network of cables to transmit power, data, and signals. As vehicle technologies evolve, there is a growing demand for cables with higher performance capabilities, such as increased power handling capacity, reliability, durability, and resistance to environmental factors. Technological advancements in materials science and manufacturing processes have led to the development of innovative materials and technologies for Higher Education Tools, such as high-strength conductors, advanced insulation materials, and improved shielding techniques.
- Integrating these new materials into cable designs while ensuring compatibility with existing systems and manufacturing processes can be challenging. Additionally, Higher Education Tools must comply with emerging standards and protocols, such as Ethernet, CAN FD, FlexRay, and LIN, to facilitate connectivity and interoperability between vehicle components and external systems. Balancing cost considerations with innovation and performance improvement is a significant challenge for cable manufacturers in highly competitive markets.
Higher Education Tools Market Segment Analysis:
Higher Education Tools Market Segmented based on product, and end user.
By Product, LMS segment is expected to dominate the market during the forecast period
- LMS serves as a centralized platform for managing various aspects of the learning process, including course materials, assignments, communication, and assessments. Its comprehensive nature makes it indispensable for institutions seeking to streamline their educational delivery methods. LMS platforms offer versatility and flexibility in delivering education. They can support a wide range of learning modalities, including traditional face-to-face instruction, fully online courses, and blended learning environments. This adaptability makes them attractive to institutions catering to diverse student needs and preferences.
- LMS solutions are scalable, meaning they can accommodate the needs of both small institutions and large universities with thousands of students. They offer features like user management, course enrollment, and content delivery that can scale up or down based on institutional requirements. LMS platforms often integrate with other educational technologies and systems, such as content repositories, video conferencing tools, and student information systems. This integration capability enhances their utility and allows institutions to create cohesive learning ecosystems.
- LMS platforms provide valuable insights into student engagement, performance, and learning outcomes through built-in analytics and reporting functionalities. Institutions can use this data to assess student progress, identify areas for improvement, and make data-driven decisions to enhance teaching and learning. The commitment to innovation ensures that LMS solutions remain relevant and competitive in an evolving educational landscape. LMS vendors typically offer robust customer support services and resources to assist institutions in implementing and maintaining their platforms.
By End User, Administrators segment held the largest share in 2022
- Administrators, including academic and administrative leaders, have significant decision-making authority in the selection and implementation of educational tools. They prioritize investments based on institutional priorities, student needs, and strategic objectives, influencing the adoption of tools across the institution.
- Administrators oversee the institutional-wide integration of educational tools, requiring coordination from various administrative departments. They are accountable for the performance and outcomes of educational initiatives, using educational tools for data collection, analysis, and reporting. They demonstrate accountability to stakeholders like faculty, students, and governing bodies.
- Administrators engage in strategic planning to address long-term institutional priorities and challenges, such as enhancing teaching and learning experiences, improving student success rates, and staying competitive in the higher education landscape. They leverage educational tools as strategic assets to achieve these objectives.
Higher Education Tools Market Regional Insights:
North America is Expected to Dominate the Market Over the Forecast Period
- North America, particularly the US, is a major player in the higher education tools sector due to its large number of institutions. The region's advanced technological infrastructure and widespread internet access enable the adoption of digital tools and platforms in higher education, such as learning management systems and online courseware. The region is also a global hub for innovation, with leading technology companies, research institutions, and startups based in major cities like Silicon Valley, Seattle, and Boston.
- Investments in education technology from venture capital firms, private equity investors, and government agencies support the development of new tools and platforms for higher education institutions. The strong demand for higher education in North America, driven by workforce demands, career advancement opportunities, and a culture that values education, creates a conducive environment for the growth of the higher education tools market.
- The complex regulatory environment in North America encourages innovation and entrepreneurship in the education sector, with policies supporting digital learning initiatives, research funding, and technology adoption. This global influence extends to the adoption of educational tools and technologies developed in the region.
Higher Education Tools Market Top Key Players:
- Blackboard Inc. (US)
- Instructure, Inc. (US)
- McGraw-Hill Education (US)
- Wiley (John Wiley & Sons, Inc.) (US)
- Cengage Learning (US)
- Adobe Inc. (US)
- Coursera Inc. (US)
- Pluralsight LLC (US)
- Chegg, Inc. (US)
- IBM Corporation (US)
- Microsoft Corporation (US)
- Oracle Corporation (US)
- Turnitin LLC (US)
- Knewton, Inc. (US)
- Schoology, Inc. (US)
- Echo360, Inc. (US)
- Panopto (US)
- ExamSoft Worldwide, Inc. (US)
- VitalSource Technologies LLC (US)
- Desire2Learn (D2L) Inc. (Canada)
- SAP SE (Germany)
- Pearson plc (UK)
- Elsevier (Netherlands), and other major players
Key Industry Developments in the Higher Education Tools Market:
- In October 2023, Instructure, the leading learning platform and maker of Canvas LMS, released the results from its annual global 2023 State of Student Success and Engagement, in partnership with Hanover Research. The study encapsulates current trends and movements within higher education and critical drivers of student success and engagement. Key findings include a preference for more certificate and apprenticeship programs, the ongoing need for mental health support for students and educators, and a continued concern over education accessibility.
- In February 2024, McGraw Hill announced the launch of a new English Language Teaching (ELT) course designed to help young learners around the world take their first steps towards learning English. The innovative six-level course called All Sorts, designed to the high standards that schools expect from McGraw Hill, is available to schools in Mexico, Colombia, Asia, and the Middle East.
|
Global Higher Education Tools Market |
|||
|
Base Year: |
2023 |
Forecast Period: |
2024-2032 |
|
Historical Data: |
2017 to 2023 |
Market Size in 2023: |
736.84 Bn. |
|
Forecast Period 2024-32 CAGR: |
12.70% |
Market Size in 2032: |
1701.53 Bn. |
|
Segments Covered: |
By Product |
|
|
|
By End User |
|
||
|
By Region |
|
||
|
Key Market Drivers: |
|
||
|
Key Market Restraints: |
|
||
|
Key Opportunities: |
|
||
|
Companies Covered in the report: |
|
||
Chapter 1: Introduction
1.1 Scope and Coverage
Chapter 2:Executive Summary
Chapter 3: Market Landscape
3.1 Market Dynamics
3.1.1 Drivers
3.1.2 Restraints
3.1.3 Opportunities
3.1.4 Challenges
3.2 Market Trend Analysis
3.3 PESTLE Analysis
3.4 Porter's Five Forces Analysis
3.5 Industry Value Chain Analysis
3.6 Ecosystem
3.7 Regulatory Landscape
3.8 Price Trend Analysis
3.9 Patent Analysis
3.10 Technology Evolution
3.11 Investment Pockets
3.12 Import-Export Analysis
Chapter 4: Higher Education Tools Market by Product (2018-2032)
4.1 Higher Education Tools Market Snapshot and Growth Engine
4.2 Market Overview
4.3 LMS
4.3.1 Introduction and Market Overview
4.3.2 Historic and Forecasted Market Size in Value USD and Volume Units
4.3.3 Key Market Trends, Growth Factors, and Opportunities
4.3.4 Geographic Segmentation Analysis
4.4 Educational Content and Courseware
4.5 Assessment and Evaluation Tools
4.6 Research and Academic Tools
4.7 Adaptive Learning and Personalized Education
4.8 Emerging Technologies
Chapter 5: Higher Education Tools Market by End User (2018-2032)
5.1 Higher Education Tools Market Snapshot and Growth Engine
5.2 Market Overview
5.3 Administrators
5.3.1 Introduction and Market Overview
5.3.2 Historic and Forecasted Market Size in Value USD and Volume Units
5.3.3 Key Market Trends, Growth Factors, and Opportunities
5.3.4 Geographic Segmentation Analysis
5.4 Students
5.5 Faculty
5.6 Librarians
5.7 Educational Technology Specialists
5.8 Institutional Leaders
Chapter 6: Company Profiles and Competitive Analysis
6.1 Competitive Landscape
6.1.1 Competitive Benchmarking
6.1.2 Higher Education Tools Market Share by Manufacturer (2024)
6.1.3 Industry BCG Matrix
6.1.4 Heat Map Analysis
6.1.5 Mergers and Acquisitions
6.2 ALIGNI (US)
6.2.1 Company Overview
6.2.2 Key Executives
6.2.3 Company Snapshot
6.2.4 Role of the Company in the Market
6.2.5 Sustainability and Social Responsibility
6.2.6 Operating Business Segments
6.2.7 Product Portfolio
6.2.8 Business Performance
6.2.9 Key Strategic Moves and Recent Developments
6.2.10 SWOT Analysis
6.3 ARENA SOLUTIONS (US)
6.4 HYLAND SOFTWARE (US)
6.5 MASTERCONTROL (US)
6.6 OMNIFY EMPOWER (US)
6.7 ORACLE AGILE PLM (US)
6.8 PROLIM (US)
6.9 PTC WINDCHILL (US)
6.10 ROOTSTOCK SOFTWARE (US)
6.11 SIEMENS INDUSTRY SOFTWARE (US)
6.12 SYNERGIS TECHNOLOGIES (US)
6.13 CONTACT SOFTWARE (GERMANY)
6.14 SAP ENGINEERING CONTROL CENTER (GERMANY)
6.15 K3 SYSPRO (UNITED KINGDOM)
6.16 REQTEST (SWEDEN)
6.17 DASSAULT SYSTÈMES (FRANCE)
6.18 FANPU SOFTWARE (CHINA)
6.19
Chapter 7: Global Higher Education Tools Market By Region
7.1 Overview
7.2. North America Higher Education Tools Market
7.2.1 Key Market Trends, Growth Factors and Opportunities
7.2.2 Top Key Companies
7.2.3 Historic and Forecasted Market Size by Segments
7.2.4 Historic and Forecasted Market Size by Product
7.2.4.1 LMS
7.2.4.2 Educational Content and Courseware
7.2.4.3 Assessment and Evaluation Tools
7.2.4.4 Research and Academic Tools
7.2.4.5 Adaptive Learning and Personalized Education
7.2.4.6 Emerging Technologies
7.2.5 Historic and Forecasted Market Size by End User
7.2.5.1 Administrators
7.2.5.2 Students
7.2.5.3 Faculty
7.2.5.4 Librarians
7.2.5.5 Educational Technology Specialists
7.2.5.6 Institutional Leaders
7.2.6 Historic and Forecast Market Size by Country
7.2.6.1 US
7.2.6.2 Canada
7.2.6.3 Mexico
7.3. Eastern Europe Higher Education Tools Market
7.3.1 Key Market Trends, Growth Factors and Opportunities
7.3.2 Top Key Companies
7.3.3 Historic and Forecasted Market Size by Segments
7.3.4 Historic and Forecasted Market Size by Product
7.3.4.1 LMS
7.3.4.2 Educational Content and Courseware
7.3.4.3 Assessment and Evaluation Tools
7.3.4.4 Research and Academic Tools
7.3.4.5 Adaptive Learning and Personalized Education
7.3.4.6 Emerging Technologies
7.3.5 Historic and Forecasted Market Size by End User
7.3.5.1 Administrators
7.3.5.2 Students
7.3.5.3 Faculty
7.3.5.4 Librarians
7.3.5.5 Educational Technology Specialists
7.3.5.6 Institutional Leaders
7.3.6 Historic and Forecast Market Size by Country
7.3.6.1 Russia
7.3.6.2 Bulgaria
7.3.6.3 The Czech Republic
7.3.6.4 Hungary
7.3.6.5 Poland
7.3.6.6 Romania
7.3.6.7 Rest of Eastern Europe
7.4. Western Europe Higher Education Tools Market
7.4.1 Key Market Trends, Growth Factors and Opportunities
7.4.2 Top Key Companies
7.4.3 Historic and Forecasted Market Size by Segments
7.4.4 Historic and Forecasted Market Size by Product
7.4.4.1 LMS
7.4.4.2 Educational Content and Courseware
7.4.4.3 Assessment and Evaluation Tools
7.4.4.4 Research and Academic Tools
7.4.4.5 Adaptive Learning and Personalized Education
7.4.4.6 Emerging Technologies
7.4.5 Historic and Forecasted Market Size by End User
7.4.5.1 Administrators
7.4.5.2 Students
7.4.5.3 Faculty
7.4.5.4 Librarians
7.4.5.5 Educational Technology Specialists
7.4.5.6 Institutional Leaders
7.4.6 Historic and Forecast Market Size by Country
7.4.6.1 Germany
7.4.6.2 UK
7.4.6.3 France
7.4.6.4 The Netherlands
7.4.6.5 Italy
7.4.6.6 Spain
7.4.6.7 Rest of Western Europe
7.5. Asia Pacific Higher Education Tools Market
7.5.1 Key Market Trends, Growth Factors and Opportunities
7.5.2 Top Key Companies
7.5.3 Historic and Forecasted Market Size by Segments
7.5.4 Historic and Forecasted Market Size by Product
7.5.4.1 LMS
7.5.4.2 Educational Content and Courseware
7.5.4.3 Assessment and Evaluation Tools
7.5.4.4 Research and Academic Tools
7.5.4.5 Adaptive Learning and Personalized Education
7.5.4.6 Emerging Technologies
7.5.5 Historic and Forecasted Market Size by End User
7.5.5.1 Administrators
7.5.5.2 Students
7.5.5.3 Faculty
7.5.5.4 Librarians
7.5.5.5 Educational Technology Specialists
7.5.5.6 Institutional Leaders
7.5.6 Historic and Forecast Market Size by Country
7.5.6.1 China
7.5.6.2 India
7.5.6.3 Japan
7.5.6.4 South Korea
7.5.6.5 Malaysia
7.5.6.6 Thailand
7.5.6.7 Vietnam
7.5.6.8 The Philippines
7.5.6.9 Australia
7.5.6.10 New Zealand
7.5.6.11 Rest of APAC
7.6. Middle East & Africa Higher Education Tools Market
7.6.1 Key Market Trends, Growth Factors and Opportunities
7.6.2 Top Key Companies
7.6.3 Historic and Forecasted Market Size by Segments
7.6.4 Historic and Forecasted Market Size by Product
7.6.4.1 LMS
7.6.4.2 Educational Content and Courseware
7.6.4.3 Assessment and Evaluation Tools
7.6.4.4 Research and Academic Tools
7.6.4.5 Adaptive Learning and Personalized Education
7.6.4.6 Emerging Technologies
7.6.5 Historic and Forecasted Market Size by End User
7.6.5.1 Administrators
7.6.5.2 Students
7.6.5.3 Faculty
7.6.5.4 Librarians
7.6.5.5 Educational Technology Specialists
7.6.5.6 Institutional Leaders
7.6.6 Historic and Forecast Market Size by Country
7.6.6.1 Turkiye
7.6.6.2 Bahrain
7.6.6.3 Kuwait
7.6.6.4 Saudi Arabia
7.6.6.5 Qatar
7.6.6.6 UAE
7.6.6.7 Israel
7.6.6.8 South Africa
7.7. South America Higher Education Tools Market
7.7.1 Key Market Trends, Growth Factors and Opportunities
7.7.2 Top Key Companies
7.7.3 Historic and Forecasted Market Size by Segments
7.7.4 Historic and Forecasted Market Size by Product
7.7.4.1 LMS
7.7.4.2 Educational Content and Courseware
7.7.4.3 Assessment and Evaluation Tools
7.7.4.4 Research and Academic Tools
7.7.4.5 Adaptive Learning and Personalized Education
7.7.4.6 Emerging Technologies
7.7.5 Historic and Forecasted Market Size by End User
7.7.5.1 Administrators
7.7.5.2 Students
7.7.5.3 Faculty
7.7.5.4 Librarians
7.7.5.5 Educational Technology Specialists
7.7.5.6 Institutional Leaders
7.7.6 Historic and Forecast Market Size by Country
7.7.6.1 Brazil
7.7.6.2 Argentina
7.7.6.3 Rest of SA
Chapter 8 Analyst Viewpoint and Conclusion
8.1 Recommendations and Concluding Analysis
8.2 Potential Market Strategies
Chapter 9 Research Methodology
9.1 Research Process
9.2 Primary Research
9.3 Secondary Research
|
Global Higher Education Tools Market |
|||
|
Base Year: |
2023 |
Forecast Period: |
2024-2032 |
|
Historical Data: |
2017 to 2023 |
Market Size in 2023: |
736.84 Bn. |
|
Forecast Period 2024-32 CAGR: |
12.70% |
Market Size in 2032: |
1701.53 Bn. |
|
Segments Covered: |
By Product |
|
|
|
By End User |
|
||
|
By Region |
|
||
|
Key Market Drivers: |
|
||
|
Key Market Restraints: |
|
||
|
Key Opportunities: |
|
||
|
Companies Covered in the report: |
|
||


