


Global Guar Gum Market Overview
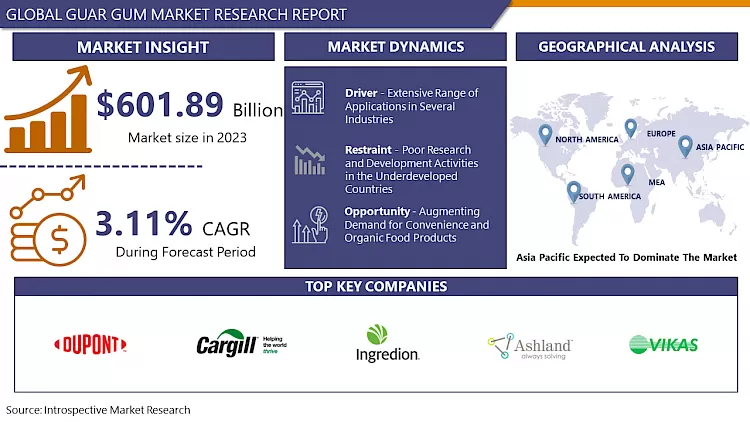
Guar Gum Market size is projected to reach USD 792.92 Million by 2032 from an estimated USD 601.89 Million in 2023, growing at a CAGR of 3.11% globally, during the forecast period (2024-2032).
Guar Gum also called Guaran, is a free-flowing powder made from the legumes known as guar beans. Guar Gum is a large chain of bonded carbohydrate molecules or a kind of galactomannan polysaccharide and is made up of two sugars such as galactose as well as mannose. Guar gum is used primarily in the food manufacturing industry, as they are thick and hold the ability to absorb water, forms a thickening gel, and helps in binding the food products. The Food and Drug Administration (FDA) addresses Guar Gum as a food product that is safe for consumption in required amounts. Owing to its various properties such as high fiber content, low-calorie content, and protein content of 5 to 6%, it is high in demand among consumers all across the world. It is also used widely among the population as it possesses the ability to reduce the amount of cholesterol and glucose in the stomach and large & small intestines. Furthermore, guar gum plays a major role in the gas and oil hydraulic fracturing procedure as a fracking fluid due to its gelling and thickening property, which fuels the market growth of guar gum worldwide. Additionally, due to rising lifestyle and chronic diseases, and the aging population, there has been observed an immense growth of guar gum in the pharmaceutical industry.

Market Dynamics And Factors For Guar Gum Market
Drivers:
Extensive Range of Applications in Several Industries
Guar Gum is a type of powder obtained from cluster beans. It is used widely in many industries such as pharmaceuticals, explosives, cosmetics, paper manufacturing, oil and gas well drilling, and as an additive in the food industry. It is used chiefly as a stabilizer and thickener in the food and beverage sector. Also, the capability of guar gum powder to form hydrogen bonding with water molecules, cushions the growth of guar gum in various industries. Moreover, the rising awareness among the consumers for the consumption of guar gum to treat irritable bowel syndromes, high blood pressure, constipation, high cholesterol levels, diarrhea, and many more is expected to drive the market growth of guar gum in the upcoming years. Guar gum is witnessing huge demand from health-conscious people as it is essential in reducing excessive body fat and easing the process of weight loss. The development of cationic and anionic guar gum derivatives and their wide utilization in oil and gas well stimulation has propelled the growth in recent years. In carpet and textile printing, guar gum is used as a thickening agent in the dye solutions which helps in obtaining sharply printed patterns of design. It is also used in explosives as an additive for water blocking. Furthermore, adding small amounts of guar gum to the pulp for paper production also drives the market growth of guar gum in the forthcoming years.
Restraints:
Poor Research and Development Activities in the Underdeveloped Countries
Although there has been observed an immense growth of guar gum in many countries, the unawareness and lack of poor R&D activities in many parts of the world are expected to hinder the guar gum market. The Asia Pacific holds the largest market share of guar gum, but in some parts of the region such as Pakistan and India, there is a lack of general research and development facilities. Additionally, these countries have not expanded their R&D associations which can focus on the development of industry-specific products, guar seed production, or manufacturing and processing technology, which is anticipated to impede the market growth of guar gum in the forecast period. The agricultural and research institutes in these regions lack in major resources required to develop new varieties and certified seeds, which further restrains the growth of the guar gum market.
Opportunities:
Augmenting Demand for Convenience and Organic Food Products
The rising awareness about lifestyle diseases has brought a drastic change in the eating habits and dietary patterns of consumers all across the world. Additionally, due to the health benefits offered by organic food products, the market for guar gum can witness rapid growth. This growth can be attributed to the substantial use of guar gum as a food additive in almond milk, yogurts, fiber supplements, bottled coconut, soups, and others, which creates a huge demand for convenience foods among the population. Also, the utilization of guar gum as a firming agent and emulsifier in foods such as breakfast cereals, jams, baking mixes, ice creams, jellies, cheese, and sauces to enhance the food quality and taste fabricates a profitable opportunity for market growth over the forecast period. An increase in consumer preference and interest for low-calorie, low-fat and processed convenience food is anticipated to augment the demand for the guar gum market. This rise in interest is also influenced more by the factors such as longer working hours, increasing income levels, and usage of household technologies that can grow rapidly in the forecasted years.
Challenges:
Introduction of New Substitutes for Guar Gum Products
Guar gum has a wide range of applications including in the oil & gas and food & beverage industries. However, major factors such as fluctuating guar prices and unavailability have led to the introduction of new substitutes to guar gum products at a cheaper rate, especially in the oil and shale gas sector. Locust bean gum, Cassia tora, carboxymethylcellulose, carboxymethyl-hydroxyethyl cellulose-based gum, xanthan gum, clear starch, and synthetic polymers are some of the newly introduced products that act as a substitute for guar gum which can create a huge challenge for the guar gum market in the forthcoming years. Additionally, the tamarind kernel powder has crucially replaced guar gum in the textile sector, and meanwhile Cassia Tora in the pet food industry.
Segmentation Analysis Of Guar Gum Market
By Function, the gelling agent segment is expected to dominate the market growth in the upcoming years. The wide application of gelling agent function in the oil and gas industry as a key ingredient for the hydraulic fracking procedure drives the market growth. It is also used extensively in the oil drilling industry to increase the production of oil and gas. The multifunctional properties such as water and fluid loss control, shale inhibitor, and cooling & lubrication of drill bits are estimated to boost the growth of gelling agent segment. Also, its application in various food products such as candies, desserts, and jellies propels the growth of the gelling function.
By Application, the oil and gas segment holds the largest market share and is anticipated to dominate the market over the forecast period. The segment witnessed huge growth owing to the shale gas boom in the North American region. Also, the rise in drilling and exploration activities for the removal of technically recoverable resources in India, China, Algeria, and Argentina is expected to boost the demand for this segment in the upcoming years. The Food & beverage industry is expected to witness a rise in demand owing to the rising trend of consuming convenience, processed and organic foods.
By Grade, the industrial-grade segment is skyrocketing due to its various applications such as oil well drilling, oil recovery, water drilling, well fracturing, oil well stimulation, and geological drilling. Industrial grade also acts as a surfactant, synthetic polymer, and deformer in the oil and gas sector further boosting the growth of this segment. Additionally, the huge growth in oil recovery and drilling activities in the Middle Eastern and North American regions drives the demand for guar gum products for industrial use.
Regional Analysis Of Guar Gum Market:
The Asia Pacific dominates the market growth of Guar gum products in recent years and is estimated to witness huge demand in the forecasted period. The rapid development of the food & beverages and pharmaceutical industry is the major factor that drives the growth of the guar gum market in the Asia Pacific region. India is the major country that produces guar seeds and it accounts for 80% of the total guar produced all across the world. The favorable climatic conditions, availability of soil, land, and fertilizers are the key factors that influence the production of guar seeds in this region. Additionally, the initiatives taken by Government bodies in the country to support the large-scale export of guar gum are anticipated to boost the growth of the guar gum market in the forecasted years. Also, the awareness among consumers regarding the health benefits and the weight loss properties drive the market growth in the Asia Pacific region.
North America is the second-most dominating region of the guar gum market and is expected to be the fastest-growing owing to the adoption of oil well drilling and hydraulic cracking in the oil and gas industry. Furthermore, the initiatives taken by the United States government to strengthen exploration activities are anticipated to influence the market of guar gum positively. The US is the largest importer of guar gum and its products which propels the market growth. Also, the availability of plenty of oil and gas resources in this region drives rapid growth. The demand for natural additives, convenience, and processed foods among the population is fuelling the food-grade guar gum market in the North American region. In addition to this, the presence of major key players such as TIC Gums Inc., Penford Corporation, Ingredion, and Cargill in the region also cushions the rapid growth of the guar gum market.
Covid-19 impact Analysis On Guar Gum Market
The COVID-19 pandemic had a strong impact on numerous industries. Due to the global pandemic, many regions have imposed complete shutdown, social distancing, and lockdown guidelines. This had a direct impact on the market growth of global guar gum. The global guar gum market was in a slump, and there were no investments in guar gum products. Due to this, major key players have implemented different ideas and tactics to propel the reduced demand for guar gum products. In the current scenario, the global guar gum market is estimated to boost market growth during the forecast period. Also, the consistent growth in lifestyle and chronic disorders and increasing demand for medicines will sustain the requirement of guar gum in the pharmaceutical industry, in addition to the consumption from other applications like paper manufacturing, mining, oil and gas, and textile sector.
Top Key Players Covered In Guar Gum Market:
- E. I. DuPont de Nemours and Company (US)
- Cargill (US)
- Shree Ram Industries (India)
- Ingredion Incorporated (US)
- Ashland Inc. (US)
- Vikas WSP Limited (India)
- Hindustan Gums and Chemical Limited (India)
- Dabur India Ltd. (India)
- India Glycols Ltd. (India)
- Neelkanth Polymers (India)
- Lucid Group (India)
- Global Gums and Chemicals Pvt. Limited (Pakistan)
- Guangrao Liuhe Chemical Co. Ltd. (China)
- Jai Bharat Gums and Chemicals Ltd (India)
- Altrafine Gums (India) and other major players.
Key Industry Development In The Guar Gum Market
- In January 2023, Nexira, a leader in natural and botanical ingredients, introduced its latest range of efficient texturizers under the brand ‘Naltive’. Naltive offers three major types of hydrocolloids, including tara gum, locust bean gum, and guar specialties, for plant-based and dairy applications.
- In December 2022, Solvay, a Belgian chemicals company, announced its latest partnership with Procter & Gamble (P&G), one of the biggest beauty companies, in its sustainable guar initiative farming program. With the help of this partnership, Solvay will be capable of increasing its impact by expanding its efforts to educate guar farmers, especially women farmers, regarding the knowledge and tools of good agricultural practices.
|
Global Guar Gum Market |
|||
|
Base Year: |
2023 |
Forecast Period: |
2024-2032 |
|
Historical Data: |
2017 to 2023 |
Market Size in 2023: |
USD 601.89 Mn. |
|
Forecast Period 2024-32 CAGR: |
3.11% |
Market Size in 2032: |
USD 795.92 Mn. |
|
Segments Covered: |
By Function |
|
|
|
By Application |
|
||
|
By Grade |
|
||
|
By Region |
|
||
|
Key Market Drivers: |
|
||
|
Key Market Restraints: |
|
||
|
Key Opportunities: |
|
||
|
Companies Covered in the report: |
|
||
1.1 Scope and Coverage
Chapter 2:Executive Summary
Chapter 3: Market Landscape
3.1 Market Dynamics
3.1.1 Drivers
3.1.2 Restraints
3.1.3 Opportunities
3.1.4 Challenges
3.2 Market Trend Analysis
3.3 PESTLE Analysis
3.4 Porter's Five Forces Analysis
3.5 Industry Value Chain Analysis
3.6 Ecosystem
3.7 Regulatory Landscape
3.8 Price Trend Analysis
3.9 Patent Analysis
3.10 Technology Evolution
3.11 Investment Pockets
3.12 Import-Export Analysis
Chapter 4: Guar Gum Market by Function (2018-2032)
4.1 Guar Gum Market Snapshot and Growth Engine
4.2 Market Overview
4.3 Gelling
4.3.1 Introduction and Market Overview
4.3.2 Historic and Forecasted Market Size in Value USD and Volume Units
4.3.3 Key Market Trends, Growth Factors, and Opportunities
4.3.4 Geographic Segmentation Analysis
4.4 Thickening
4.5 Binding
4.6 Friction Reducing
Chapter 5: Guar Gum Market by Application (2018-2032)
5.1 Guar Gum Market Snapshot and Growth Engine
5.2 Market Overview
5.3 Oil and Gas
5.3.1 Introduction and Market Overview
5.3.2 Historic and Forecasted Market Size in Value USD and Volume Units
5.3.3 Key Market Trends, Growth Factors, and Opportunities
5.3.4 Geographic Segmentation Analysis
5.4 Food and Beverages
5.5 Paper Manufacturing
5.6 Mining and Explosives
5.7 Pharmaceuticals and Cosmetics
Chapter 6: Guar Gum Market by Grade (2018-2032)
6.1 Guar Gum Market Snapshot and Growth Engine
6.2 Market Overview
6.3 Food grade
6.3.1 Introduction and Market Overview
6.3.2 Historic and Forecasted Market Size in Value USD and Volume Units
6.3.3 Key Market Trends, Growth Factors, and Opportunities
6.3.4 Geographic Segmentation Analysis
6.4 Industrial grade
6.5 Pharmaceutical grade
Chapter 7: Company Profiles and Competitive Analysis
7.1 Competitive Landscape
7.1.1 Competitive Benchmarking
7.1.2 Guar Gum Market Share by Manufacturer (2024)
7.1.3 Industry BCG Matrix
7.1.4 Heat Map Analysis
7.1.5 Mergers and Acquisitions
7.2 CONSTELLIUM SE (FRANCE)
7.2.1 Company Overview
7.2.2 Key Executives
7.2.3 Company Snapshot
7.2.4 Role of the Company in the Market
7.2.5 Sustainability and Social Responsibility
7.2.6 Operating Business Segments
7.2.7 Product Portfolio
7.2.8 Business Performance
7.2.9 Key Strategic Moves and Recent Developments
7.2.10 SWOT Analysis
7.3 EVONIK INDUSTRIES AG (GERMANY)
7.4 GESTAMP AUTOMOCION
7.5 S.A. (SPAIN)
7.6 GF LINAMAR LLC (U.S.)
7.7 HANWHA SOLUTIONS ADVANCED MATERIALS (SOUTH KOREA)
7.8 HITACHI METALS LTD. (JAPAN)
7.9 LANXESS (GERMANY)
7.10 MAGNA INTERNATIONAL INC. (CANADA)
7.11 MINTH GROUP (CHINA)
7.12 NEMAK
7.13 S.A.B. DE C.V. (MEXICO)
7.14 NORSK HYDRO ASA (NORWAY)
7.15 NOVELIS INC. (U.S.)
7.16 SGL CARBON (GERMANY)
7.17 TEIJIN LIMITED (JAPAN)
7.18 THYSSENKRUPP AG (GERMANY)
7.19 TRB LIGHTWEIGHT (U.K.)
7.20 UACJ CORPORATION (JAPAN)
7.21 OTHER KEY PLAYERS
Chapter 8: Global Guar Gum Market By Region
8.1 Overview
8.2. North America Guar Gum Market
8.2.1 Key Market Trends, Growth Factors and Opportunities
8.2.2 Top Key Companies
8.2.3 Historic and Forecasted Market Size by Segments
8.2.4 Historic and Forecasted Market Size by Function
8.2.4.1 Gelling
8.2.4.2 Thickening
8.2.4.3 Binding
8.2.4.4 Friction Reducing
8.2.5 Historic and Forecasted Market Size by Application
8.2.5.1 Oil and Gas
8.2.5.2 Food and Beverages
8.2.5.3 Paper Manufacturing
8.2.5.4 Mining and Explosives
8.2.5.5 Pharmaceuticals and Cosmetics
8.2.6 Historic and Forecasted Market Size by Grade
8.2.6.1 Food grade
8.2.6.2 Industrial grade
8.2.6.3 Pharmaceutical grade
8.2.7 Historic and Forecast Market Size by Country
8.2.7.1 US
8.2.7.2 Canada
8.2.7.3 Mexico
8.3. Eastern Europe Guar Gum Market
8.3.1 Key Market Trends, Growth Factors and Opportunities
8.3.2 Top Key Companies
8.3.3 Historic and Forecasted Market Size by Segments
8.3.4 Historic and Forecasted Market Size by Function
8.3.4.1 Gelling
8.3.4.2 Thickening
8.3.4.3 Binding
8.3.4.4 Friction Reducing
8.3.5 Historic and Forecasted Market Size by Application
8.3.5.1 Oil and Gas
8.3.5.2 Food and Beverages
8.3.5.3 Paper Manufacturing
8.3.5.4 Mining and Explosives
8.3.5.5 Pharmaceuticals and Cosmetics
8.3.6 Historic and Forecasted Market Size by Grade
8.3.6.1 Food grade
8.3.6.2 Industrial grade
8.3.6.3 Pharmaceutical grade
8.3.7 Historic and Forecast Market Size by Country
8.3.7.1 Russia
8.3.7.2 Bulgaria
8.3.7.3 The Czech Republic
8.3.7.4 Hungary
8.3.7.5 Poland
8.3.7.6 Romania
8.3.7.7 Rest of Eastern Europe
8.4. Western Europe Guar Gum Market
8.4.1 Key Market Trends, Growth Factors and Opportunities
8.4.2 Top Key Companies
8.4.3 Historic and Forecasted Market Size by Segments
8.4.4 Historic and Forecasted Market Size by Function
8.4.4.1 Gelling
8.4.4.2 Thickening
8.4.4.3 Binding
8.4.4.4 Friction Reducing
8.4.5 Historic and Forecasted Market Size by Application
8.4.5.1 Oil and Gas
8.4.5.2 Food and Beverages
8.4.5.3 Paper Manufacturing
8.4.5.4 Mining and Explosives
8.4.5.5 Pharmaceuticals and Cosmetics
8.4.6 Historic and Forecasted Market Size by Grade
8.4.6.1 Food grade
8.4.6.2 Industrial grade
8.4.6.3 Pharmaceutical grade
8.4.7 Historic and Forecast Market Size by Country
8.4.7.1 Germany
8.4.7.2 UK
8.4.7.3 France
8.4.7.4 The Netherlands
8.4.7.5 Italy
8.4.7.6 Spain
8.4.7.7 Rest of Western Europe
8.5. Asia Pacific Guar Gum Market
8.5.1 Key Market Trends, Growth Factors and Opportunities
8.5.2 Top Key Companies
8.5.3 Historic and Forecasted Market Size by Segments
8.5.4 Historic and Forecasted Market Size by Function
8.5.4.1 Gelling
8.5.4.2 Thickening
8.5.4.3 Binding
8.5.4.4 Friction Reducing
8.5.5 Historic and Forecasted Market Size by Application
8.5.5.1 Oil and Gas
8.5.5.2 Food and Beverages
8.5.5.3 Paper Manufacturing
8.5.5.4 Mining and Explosives
8.5.5.5 Pharmaceuticals and Cosmetics
8.5.6 Historic and Forecasted Market Size by Grade
8.5.6.1 Food grade
8.5.6.2 Industrial grade
8.5.6.3 Pharmaceutical grade
8.5.7 Historic and Forecast Market Size by Country
8.5.7.1 China
8.5.7.2 India
8.5.7.3 Japan
8.5.7.4 South Korea
8.5.7.5 Malaysia
8.5.7.6 Thailand
8.5.7.7 Vietnam
8.5.7.8 The Philippines
8.5.7.9 Australia
8.5.7.10 New Zealand
8.5.7.11 Rest of APAC
8.6. Middle East & Africa Guar Gum Market
8.6.1 Key Market Trends, Growth Factors and Opportunities
8.6.2 Top Key Companies
8.6.3 Historic and Forecasted Market Size by Segments
8.6.4 Historic and Forecasted Market Size by Function
8.6.4.1 Gelling
8.6.4.2 Thickening
8.6.4.3 Binding
8.6.4.4 Friction Reducing
8.6.5 Historic and Forecasted Market Size by Application
8.6.5.1 Oil and Gas
8.6.5.2 Food and Beverages
8.6.5.3 Paper Manufacturing
8.6.5.4 Mining and Explosives
8.6.5.5 Pharmaceuticals and Cosmetics
8.6.6 Historic and Forecasted Market Size by Grade
8.6.6.1 Food grade
8.6.6.2 Industrial grade
8.6.6.3 Pharmaceutical grade
8.6.7 Historic and Forecast Market Size by Country
8.6.7.1 Turkiye
8.6.7.2 Bahrain
8.6.7.3 Kuwait
8.6.7.4 Saudi Arabia
8.6.7.5 Qatar
8.6.7.6 UAE
8.6.7.7 Israel
8.6.7.8 South Africa
8.7. South America Guar Gum Market
8.7.1 Key Market Trends, Growth Factors and Opportunities
8.7.2 Top Key Companies
8.7.3 Historic and Forecasted Market Size by Segments
8.7.4 Historic and Forecasted Market Size by Function
8.7.4.1 Gelling
8.7.4.2 Thickening
8.7.4.3 Binding
8.7.4.4 Friction Reducing
8.7.5 Historic and Forecasted Market Size by Application
8.7.5.1 Oil and Gas
8.7.5.2 Food and Beverages
8.7.5.3 Paper Manufacturing
8.7.5.4 Mining and Explosives
8.7.5.5 Pharmaceuticals and Cosmetics
8.7.6 Historic and Forecasted Market Size by Grade
8.7.6.1 Food grade
8.7.6.2 Industrial grade
8.7.6.3 Pharmaceutical grade
8.7.7 Historic and Forecast Market Size by Country
8.7.7.1 Brazil
8.7.7.2 Argentina
8.7.7.3 Rest of SA
Chapter 9 Analyst Viewpoint and Conclusion
9.1 Recommendations and Concluding Analysis
9.2 Potential Market Strategies
Chapter 10 Research Methodology
10.1 Research Process
10.2 Primary Research
10.3 Secondary Research
|
Global Guar Gum Market |
|||
|
Base Year: |
2023 |
Forecast Period: |
2024-2032 |
|
Historical Data: |
2017 to 2023 |
Market Size in 2023: |
USD 601.89 Mn. |
|
Forecast Period 2024-32 CAGR: |
3.11% |
Market Size in 2032: |
USD 795.92 Mn. |
|
Segments Covered: |
By Function |
|
|
|
By Application |
|
||
|
By Grade |
|
||
|
By Region |
|
||
|
Key Market Drivers: |
|
||
|
Key Market Restraints: |
|
||
|
Key Opportunities: |
|
||
|
Companies Covered in the report: |
|
||
Frequently Asked Questions :
The forecast period in the Guar Gum Market research report is 2024-2032.
E. I. DuPont de Nemours and Company (US), Cargill (US), Shree Ram Industries (India), Ingredion Incorporated (US), Ashland Inc. (US), and other major players.
The Guar Gum Market is segmented into Function, Application, Grade, and region. By Function, the market is categorized into Gelling, Thickening, Binding, and Friction Reducing. By Application, the market is categorized into Oil & Gas, Food & Beverages, Paper manufacturing, Mining & Explosives, and Pharmaceuticals & Cosmetics. By Grade, the market is categorized into Food grade, Industrial grade, and Pharmaceutical Grade. By region, it is analyzed across North America (U.S.; Canada; Mexico), Europe (Germany; U.K.; France; Italy; Russia; Spain, etc.), Asia-Pacific (China; India; Japan; Southeast Asia, etc.), South America (Brazil; Argentina, etc.), Middle East & Africa (Saudi Arabia; South Africa, etc.).
Guar Gum is highly rich in Guar Gum also called Guaran, which is a free-flowing powder made from the legumes known as guar beans. Guar gum is used primarily in the food manufacturing industry, as they are thick and hold the ability to absorb water, forms a thickening gel, and helps in binding the food products.
Guar Gum Market size is projected to reach USD 792.92 Million by 2032 from an estimated USD 601.89 Million in 2023, growing at a CAGR of 3.11% globally, during the forecast period (2024-2032).


