


Precious Metals Market Synopsis
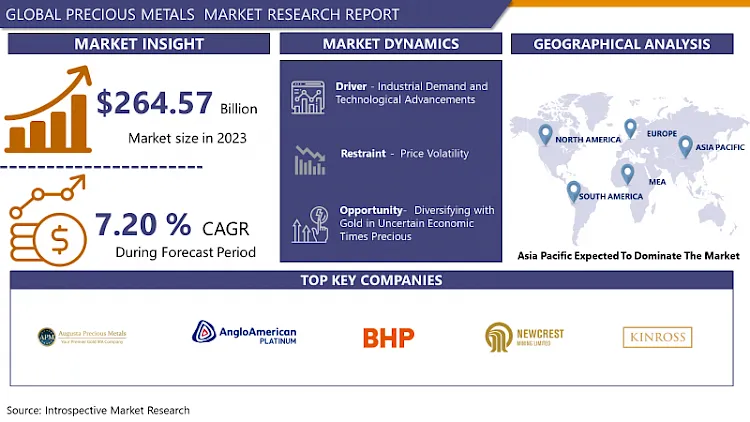
Precious Metals Market Size Was Valued at USD 264.57 Billion in 2024 and is Projected to Reach USD 461.42 Billion by 2032, Growing at a CAGR of 7.20% From 2025 to 2032.
Precious metals, as a subset of valuable metals, are relatively scarce metals which have always been valued, notably for their light weight and resistance to corrosion or decay. For example, we have gold, silver, platinum, and palladium, among several others. Due to their high conductivity, these metals have been coveted by man throughout history as mediums of exchange, ornaments, electrical uses, and stores of value against shocks such as inflation and economic downturns. Their malleability, conductance, and non-corrosive nature depict them as relevant in a number of sectors, from the manufacture of electronics to medical use.
Gold, silver, platinum, palladium and several other metals collectively constitute the precious metals that are involved in one of the most volatile market domains that has been fueled by a number of issues, including economic instabilities, global conflicts and changes in industrial uses. Gold is generally an inflation-hedge or a safe-haven asset whose behaviour is thought to be affected by bad economic conditions, inflation rates, and changes in currency values. In our context, it means that, when the economic conditions are weak, people will turn to gold as a hedge against such conditions, thereby leading to an increase in price. For instance, when financial crises or geopolitical issues in global economies are detectable, gold prices always shoot up. Furthermore, the policies of the central banks and their decisions on interest rates tremendously influence gold prices, as every fall in interest rate increases the appeal of gold, which is a non-interest-bearing asset.
Silver, like gold, can also be valued for its role as a store of value; however, it has significant demand for use in industrial sense in electronics, solar panels and in the biomedical field. Being both an investment asset and industrial product, it has both an investment market determined by demand and supply and industrial market regarding usage for production purposes. The demand of platinum and palladium is mainly influenced by industrial applications, where these metals are used in so-called catalytic converters of automobiles, which lessen the degree of hazardous emissions. These metals are used in the automobile industry, and since the health standards of the world is seeing to it that car emissions reduce, there will always be a demand for these metals. Likewise, a shortage of products from the key producing countries, comprising South Africa and Russia, might restlessly fluctuate prices in these segments.
The future of the precious metal has also been influenced by technological enhancements and the evolution of online trading to the extent that it is now within the reach of retail investors. In the same way, there are several ETFs where people can participate in the precious metals market with increased flexibility compared to owning the actual metal. Also, social awareness of people regarding ethical investment has led to the consideration of the significant effects of mining practices on the procurement of precious metals, and this has in turn affected demand-pull factors.
The subsequent market changes proved the business’s dependence on the international context, particularly the COVID-19 pandemic. In 2020, gold prices reached their peaks due to the effects of the global pandemic and the economic turmoil, leading to increased calls for Gold as a hedge against inflation arising from the implementation of colossal fiscal stimulus packages. On the other hand, productivity disruptions in the industrial sectors that were caused by the same affected the demand for silver and platinum group metals at the beginning of the phases, but the demand later rebounded as the industrial activities returned to normalcy.
The market outlook for precious metals will continue to be more or less unstable depending on the recovery’s continued progression, further inflation considerations, and technology. They both state that legal factors crucial to the management of business and sustainability include legally enforceable actions such as environmental compliance and the process by which legislation influences guidance of corporate responsibilities and actions. So, identifying the complex and various motives behind the precious metals market is indeed important to the target investing groups since the market is constantly changing and dynamic.

Precious Metals Market Trend Analysis
Increasing Demand for Green Technologies Driving Silver Prices Up
- The soaring demand for high-end electronics products, coupled with environmental consciousness of the latest emerging technologies such as renewable energies and electric vehicles, are being attributed for the impressive increase in store levels of precious metals, which include silver. Silver is relatively scarce and has a high demand since it has several notable properties, such as high electrical and thermal conductivity, which makes it suitable be use in the photovoltaic cells of solar panels and other electric features of cars, among other uses. As international trends towards reducing greenhouse gas emissions increase, investments in green technologies will, thus consequentially, boost the demand for silver. The solar industry, perhaps the largest consumer of silver, remains buoyant, with world governments and conglomerates pledging more forces for green energy. Likewise, the electric automobile sector is rapidly evolving with a high demand for growth and production of more items, including batteries and circuits containing silver. This demand is further bolstered by past and present uses of the metal in jewelry, coins and numerous industries where it is essential; these factors have helped cut the supply and pass a signal to the price to rise higher.
- Moreover, the source prospective and established mining activities for silver are unable to spur up to this new demand than before, thus worsening the supply-side factors. Holders, as a result of silver’s importance for the green technology renaissance and its ability for even more price appreciation, are also contributing to the climb with additional investment in silver-related assets. Consequently, increase in green technology that has led to the use of silver technology, plus the utility of silver in its multiple forms in the industrial sector, has been one key driver for the rise of the silver prices in the precious metals market.
Diversifying with Gold in Uncertain Economic Times: Precious
- When it comes to investing in other forms of asset, people often turn to the safe haven of gold and other precious metals as a way to protect their investments and their wealth from any further fluctuations in the economic turmoil. Gold, for example, can be deemed as a safe-haven instrument because it is valuable, rare and has been shown to rise in value during recessionary times. Unlike fiat currencies, which are prone to inflation and devaluation, gold retains its form and has a strong demand in world economy without being controlled by the policies of the government or a central bank. Flavours for investing in precious metals are witnessed when there is an economic crisis, political instability and high inflation, all in an effort to diversify and safeguard against volatile equity markets and sharp fluctuations in currencies.
- Further, the value of gold and other metals like silver, Platinum and palladium is not only for ornamental purposes; they have numerous other uses while acting as industrial aid. Holding these assets as a portion of their portfolio helps diversify the investment, serves as a protective layer for potential market risk and could provide long-term returns.
Precious Metals Market Segment Analysis:
The Metals metals market is segmented based on Type, Application, and Region.
By Type, Gold segment is expected to dominate the market during the forecast period
- Metals are classified as precious based on their properties and trade differences; therefore, the precious metals market contains a vast selection of metals. It is important for its chronological value as history’s oldest known metal, for investment purposes, jewelry and electronic industry. Like gold, which is also often used in investment, it is more widely used in various branches of industry because of its high conductivity and antiseptic properties. Catalytic converters, automobiles, jewelry, and many other uses make platinum precious; thus, it needs to be stored safely.
- Like the precious metal palladium being used in catalytic converters, resulting to much demand and high prices due to the need to reduce vehicle emissions. Other PGMs, for instance, rhodium, iridium, and ruthenium, though less popular, are essential in various industries and technologies, for instance electronics, chemical processes, and high-temperature solitary. Every type of precious metal has its own role within the global environment; this means that every type of precious metal is affected differently by the forces of supply and demand placed on it by the world economy, the various industries which use these precious metals, and increased or decreased technological development.
By application, the jewelry segment held the largest share in 2024
- The global precious metals market is divided based on application in various sectors as follows: Each sector has its own unique features with regard to demand and supply. The accessories type of jewelry is made mostly from precious metals often gold, silver and platinum, which have a natural beauty and are often associated with culture; thus, demand is significant in the India and China type markets. The precious metals, particularly gold and silver, also capture the attention of investment applications, as they are viewed more or less as a refuge where investors can secure their wealth from<|reserved_special_token_256|> or volatile dangers such as inflation and volatile or fluctuating monetary values.
- For industrial usage, metals are precious due to their special parameters, For example, the electrical conductivity of silver makes an essential component in electronics and photovoltaic panels; the use of platinum and palladium in automotive industry helps minimize the emission of gases through catalytic converters. Precious metals are also valued in the pharmaceutical manufacturing industry since they are biocompatible and antimicrobial in nature, which is crucial in designing and producing medical applications and therapeutics. Finally, other applications involve the use of these metals in dental alloys for making bridges and other dental prostheses, electronics, jewelry, automotive, aerospace and even luxury gifts, pointing to the fact that these metals are a never-fading commodity each as per the different uses mentioned above.
Precious Metals Market Regional Insights:
Asia-Pacific is Expected to Dominate the Market Over the Forecast period
- The Asia-Pacific region is likely to account for significantly high demand for precious metals within this forecast period due to various factors. This part of the world, especially the Far East and South Asia, comprising of countries like China and India, has realized faster economic growth and higher levels of industrialization, which are key categories that utilize large quantities of precious metals for use in manufacturing processes as well as for investment purposes. Especially in China, the demand is further strengthened by electronics as well as the auto industry, which uses heavy elements such as platinum and palladium in emission control devices such as catalytic converters and components, respectively.
- Notably, there is a cultural inclination towards the gold metal, particularly within the Indian sub-region for jewellery and as an investment asset; this fuels the market. It is also aiding the rising middle class in these countries to greatly boost the overall demand for such items as quality jewelries and investment metals. Also, Asia Pacific has favorable regulatory environment for many products due to government policies and active trade within this area and has relatively cheaper cost of production compared to some other areas suitable for production of precious metals. The development of appropriate mining operations and technological improvements in extraction procedures remain the market’s driving forces. Thus, Asia-Pacific region has the potential to remain as the largest consumer and producer of precious metals in the world during the forthcoming years.
Active Key Players in the Precious Metals Market
- Anglo American Platinum (USA)
- Augusta Precious Metals (USA)
- BHP Group (Australia)
- Newcrest Mining Limited (Australia)
- Kinross Gold Corporation (Canada)
- Sibanye-Stillwater (South Africa)
- American Hartford Gold (USA)
- Zijin Mining Group Co., Ltd (China)
- Rio Tinto Group (UK)
- Agnico Eagle Mines Ltd (Canada)
- Newmont Corporation (USA)
- Impala Platinum Holdings Ltd (South Africa)
- First Quantum Minerals Ltd (Canada)
- Glencore International AG (Switzerland)
- Freeport-McMoRan Inc (USA) and Other Key Players
Key Industry Developments in the Precious Metals Market
- In July 2023, Barrick Gold disclosed the extension of the mine life for its Tongon gold project in Côte d'Ivoire. This decision comes as a result of the ongoing positive outcomes from gold exploration activities within the Nielle mining permit area. Originally established in 2010 with an expected closure in 2021, the company filed documentation in 2021 to extend the mine’s life until 2026.
- In July 2023, K92 Mining Inc. announced the resumption of underground mining operations at the Kainantu Gold Mine in Papua New Guinea. The restart was conducted by a comprehensive restart plan prioritizing safety following a tragic incident involving an underground vehicle. Notably, the impact on surface activities has been minimal, and surface stockpiles have undergone processing in the designated plant. K92 Mining Inc. affirms that its production and cost guidance for 2023 remain unaffected by these events.
- In June 2023, AnglogoldAshanti introduced a pioneering renewable energy initiative at the Tropicana Gold Mine, signifying a notable achievement in its commitment to carbon emissions reduction. In collaboration with Pacific Energy, AngloGold Ashanti Australia Ltd. is undertaking the construction and operation of an extensive 62MW solar and wind production capacity at the mine. This partnership aims to integrate renewable energy sources into the mine's power supply infrastructure, thereby reducing reliance on gas consumption.
|
Global Precious Metals Market |
|||
|
Base Year: |
2024 |
Forecast Period: |
2025-2032 |
|
Historical Data: |
2018 to 2023 |
Market Size in 2024: |
USD 264.57 Bn. |
|
Forecast Period 2025-32 CAGR: |
7.20% |
Market Size in 2032: |
USD 461.42 Bn. |
|
Segments Covered: |
By Type |
|
|
|
By Application |
|
||
|
By Region |
|
||
|
Key Market Drivers: |
|
||
|
Key Market Restraints: |
|
||
|
Key Opportunities: |
|
||
|
Companies Covered in the report: |
|
||
Chapter 1: Introduction
1.1 Scope and Coverage
Chapter 2:Executive Summary
Chapter 3: Market Landscape
3.1 Market Dynamics
3.1.1 Drivers
3.1.2 Restraints
3.1.3 Opportunities
3.1.4 Challenges
3.2 Market Trend Analysis
3.3 PESTLE Analysis
3.4 Porter's Five Forces Analysis
3.5 Industry Value Chain Analysis
3.6 Ecosystem
3.7 Regulatory Landscape
3.8 Price Trend Analysis
3.9 Patent Analysis
3.10 Technology Evolution
3.11 Investment Pockets
3.12 Import-Export Analysis
Chapter 4: Precious Metals Market by Type (2018-2032)
4.1 Precious Metals Market Snapshot and Growth Engine
4.2 Market Overview
4.3 Gold
4.3.1 Introduction and Market Overview
4.3.2 Historic and Forecasted Market Size in Value USD and Volume Units
4.3.3 Key Market Trends, Growth Factors, and Opportunities
4.3.4 Geographic Segmentation Analysis
4.4 Silver
4.5 Platinum
4.6 Palladium
4.7 Others
Chapter 5: Precious Metals Market by Application (2018-2032)
5.1 Precious Metals Market Snapshot and Growth Engine
5.2 Market Overview
5.3 Jewelry
5.3.1 Introduction and Market Overview
5.3.2 Historic and Forecasted Market Size in Value USD and Volume Units
5.3.3 Key Market Trends, Growth Factors, and Opportunities
5.3.4 Geographic Segmentation Analysis
5.4 Investment
5.5 Industrial
5.6 Pharmaceutical
5.7 Automotive
5.8 Others
Chapter 6: Company Profiles and Competitive Analysis
6.1 Competitive Landscape
6.1.1 Competitive Benchmarking
6.1.2 Precious Metals Market Share by Manufacturer (2024)
6.1.3 Industry BCG Matrix
6.1.4 Heat Map Analysis
6.1.5 Mergers and Acquisitions
6.2 HIDDENBED OF OREGON LLC (US)
6.2.1 Company Overview
6.2.2 Key Executives
6.2.3 Company Snapshot
6.2.4 Role of the Company in the Market
6.2.5 Sustainability and Social Responsibility
6.2.6 Operating Business Segments
6.2.7 Product Portfolio
6.2.8 Business Performance
6.2.9 Key Strategic Moves and Recent Developments
6.2.10 SWOT Analysis
6.3 MURPHY WALL BEDS HARDWARE INC. (US)
6.4 BESTAR INC. (CANADA)
6.5 SICO INC. (US)
6.6 THE WALLBED COMPANY (AUSTRALIA)
6.7 WILDING WALLBEDS (US)
6.8 INOVABED (US)
6.9 OLDHAM WOOD (US)
6.10 SMARTBETT GMBH (GERMANY)
6.11 THE BEDDER WAY COMPANY (US)
6.12 FOSHAN YOUPAI HOME TECHNOLOGY CO. LTD. (CHINA)
6.13 B.O.F.F. WALL BED (CANADA)
6.14 BONBON TRADING LIMITED (UK)
6.15 FLYINGBEDS INTERNATIONAL (US)
6.16 CLICKBED PL (POLAND)
6.17 GUANGDONG NOVA FURNITURE CO. LIMITED (CHINA)
6.18 FOSHAN COOC FURNITURE CO. LTD. (CHINA)
6.19 OTHER KEY PLAYERS
Chapter 7: Global Precious Metals Market By Region
7.1 Overview
7.2. North America Precious Metals Market
7.2.1 Key Market Trends, Growth Factors and Opportunities
7.2.2 Top Key Companies
7.2.3 Historic and Forecasted Market Size by Segments
7.2.4 Historic and Forecasted Market Size by Type
7.2.4.1 Gold
7.2.4.2 Silver
7.2.4.3 Platinum
7.2.4.4 Palladium
7.2.4.5 Others
7.2.5 Historic and Forecasted Market Size by Application
7.2.5.1 Jewelry
7.2.5.2 Investment
7.2.5.3 Industrial
7.2.5.4 Pharmaceutical
7.2.5.5 Automotive
7.2.5.6 Others
7.2.6 Historic and Forecast Market Size by Country
7.2.6.1 US
7.2.6.2 Canada
7.2.6.3 Mexico
7.3. Eastern Europe Precious Metals Market
7.3.1 Key Market Trends, Growth Factors and Opportunities
7.3.2 Top Key Companies
7.3.3 Historic and Forecasted Market Size by Segments
7.3.4 Historic and Forecasted Market Size by Type
7.3.4.1 Gold
7.3.4.2 Silver
7.3.4.3 Platinum
7.3.4.4 Palladium
7.3.4.5 Others
7.3.5 Historic and Forecasted Market Size by Application
7.3.5.1 Jewelry
7.3.5.2 Investment
7.3.5.3 Industrial
7.3.5.4 Pharmaceutical
7.3.5.5 Automotive
7.3.5.6 Others
7.3.6 Historic and Forecast Market Size by Country
7.3.6.1 Russia
7.3.6.2 Bulgaria
7.3.6.3 The Czech Republic
7.3.6.4 Hungary
7.3.6.5 Poland
7.3.6.6 Romania
7.3.6.7 Rest of Eastern Europe
7.4. Western Europe Precious Metals Market
7.4.1 Key Market Trends, Growth Factors and Opportunities
7.4.2 Top Key Companies
7.4.3 Historic and Forecasted Market Size by Segments
7.4.4 Historic and Forecasted Market Size by Type
7.4.4.1 Gold
7.4.4.2 Silver
7.4.4.3 Platinum
7.4.4.4 Palladium
7.4.4.5 Others
7.4.5 Historic and Forecasted Market Size by Application
7.4.5.1 Jewelry
7.4.5.2 Investment
7.4.5.3 Industrial
7.4.5.4 Pharmaceutical
7.4.5.5 Automotive
7.4.5.6 Others
7.4.6 Historic and Forecast Market Size by Country
7.4.6.1 Germany
7.4.6.2 UK
7.4.6.3 France
7.4.6.4 The Netherlands
7.4.6.5 Italy
7.4.6.6 Spain
7.4.6.7 Rest of Western Europe
7.5. Asia Pacific Precious Metals Market
7.5.1 Key Market Trends, Growth Factors and Opportunities
7.5.2 Top Key Companies
7.5.3 Historic and Forecasted Market Size by Segments
7.5.4 Historic and Forecasted Market Size by Type
7.5.4.1 Gold
7.5.4.2 Silver
7.5.4.3 Platinum
7.5.4.4 Palladium
7.5.4.5 Others
7.5.5 Historic and Forecasted Market Size by Application
7.5.5.1 Jewelry
7.5.5.2 Investment
7.5.5.3 Industrial
7.5.5.4 Pharmaceutical
7.5.5.5 Automotive
7.5.5.6 Others
7.5.6 Historic and Forecast Market Size by Country
7.5.6.1 China
7.5.6.2 India
7.5.6.3 Japan
7.5.6.4 South Korea
7.5.6.5 Malaysia
7.5.6.6 Thailand
7.5.6.7 Vietnam
7.5.6.8 The Philippines
7.5.6.9 Australia
7.5.6.10 New Zealand
7.5.6.11 Rest of APAC
7.6. Middle East & Africa Precious Metals Market
7.6.1 Key Market Trends, Growth Factors and Opportunities
7.6.2 Top Key Companies
7.6.3 Historic and Forecasted Market Size by Segments
7.6.4 Historic and Forecasted Market Size by Type
7.6.4.1 Gold
7.6.4.2 Silver
7.6.4.3 Platinum
7.6.4.4 Palladium
7.6.4.5 Others
7.6.5 Historic and Forecasted Market Size by Application
7.6.5.1 Jewelry
7.6.5.2 Investment
7.6.5.3 Industrial
7.6.5.4 Pharmaceutical
7.6.5.5 Automotive
7.6.5.6 Others
7.6.6 Historic and Forecast Market Size by Country
7.6.6.1 Turkiye
7.6.6.2 Bahrain
7.6.6.3 Kuwait
7.6.6.4 Saudi Arabia
7.6.6.5 Qatar
7.6.6.6 UAE
7.6.6.7 Israel
7.6.6.8 South Africa
7.7. South America Precious Metals Market
7.7.1 Key Market Trends, Growth Factors and Opportunities
7.7.2 Top Key Companies
7.7.3 Historic and Forecasted Market Size by Segments
7.7.4 Historic and Forecasted Market Size by Type
7.7.4.1 Gold
7.7.4.2 Silver
7.7.4.3 Platinum
7.7.4.4 Palladium
7.7.4.5 Others
7.7.5 Historic and Forecasted Market Size by Application
7.7.5.1 Jewelry
7.7.5.2 Investment
7.7.5.3 Industrial
7.7.5.4 Pharmaceutical
7.7.5.5 Automotive
7.7.5.6 Others
7.7.6 Historic and Forecast Market Size by Country
7.7.6.1 Brazil
7.7.6.2 Argentina
7.7.6.3 Rest of SA
Chapter 8 Analyst Viewpoint and Conclusion
8.1 Recommendations and Concluding Analysis
8.2 Potential Market Strategies
Chapter 9 Research Methodology
9.1 Research Process
9.2 Primary Research
9.3 Secondary Research
|
Global Precious Metals Market |
|||
|
Base Year: |
2024 |
Forecast Period: |
2025-2032 |
|
Historical Data: |
2018 to 2023 |
Market Size in 2024: |
USD 264.57 Bn. |
|
Forecast Period 2025-32 CAGR: |
7.20% |
Market Size in 2032: |
USD 461.42 Bn. |
|
Segments Covered: |
By Type |
|
|
|
By Application |
|
||
|
By Region |
|
||
|
Key Market Drivers: |
|
||
|
Key Market Restraints: |
|
||
|
Key Opportunities: |
|
||
|
Companies Covered in the report: |
|
||


