


Formulation Development Outsourcing Market Synopsis
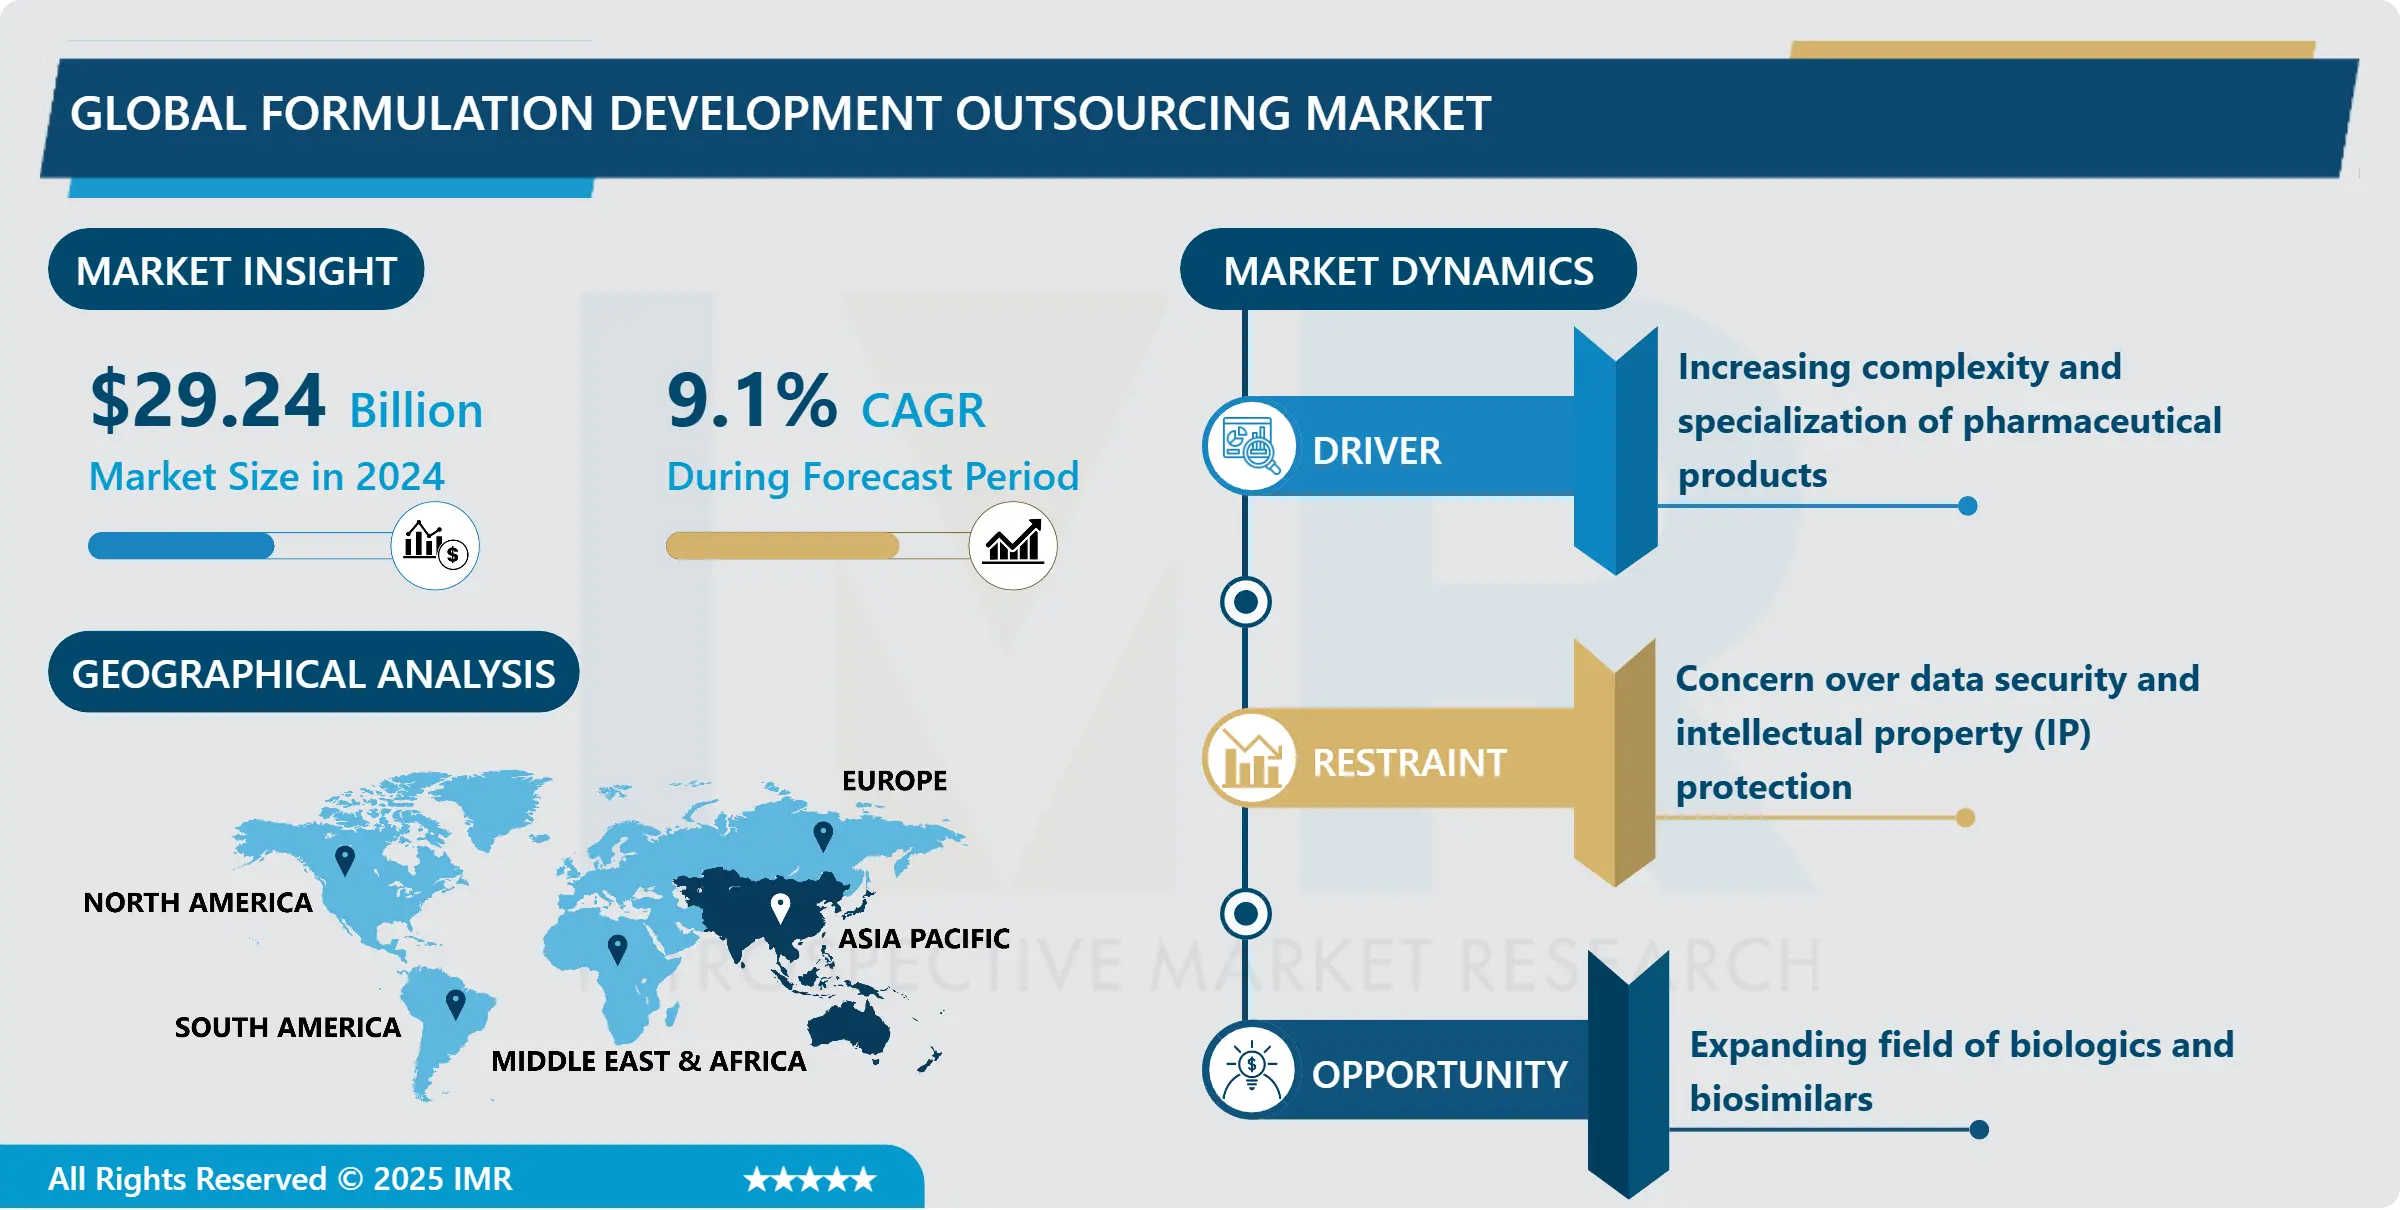
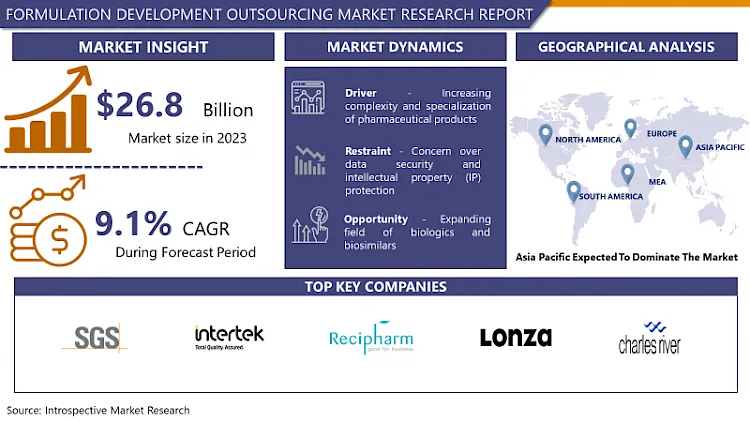
Formulation Development Outsourcing Market Size was valued at USD 29.24 Billion in 2024, and is Projected to Reach USD 58.6 Billion by 2032, Growing at a CAGR of 9.1% From 2025-2032.
Outsourcing of formulation development means that those jobs are handed over to third parties, in this case service providers, to formulate and enhance pharmaceutical formulations on behalf of the contracting party. To be specific, Dr. Poc Wisniak specified that the process involves developing the drug product and identifying suitable excipients as well as identifying the manufacturing method to achieve safety, efficacy, and stability. Vendor resources introduced better technology, domain know-how, or improved, legal comprehension that can help in getting new solutions to marketplace quicker and at lower cost. Firms choose to outsource as they gain the ability to focus on business processes that are unique to their organization, capture the best talent from across the world, and utilize existing service provider expertise in manage external regulatory frameworks and ensure product launch success.
The formulation development outsourcing market has continuously expanded over the past few years with the increased pressure on the complexity of drug development, continuously rising research and development costs, as well as the requirement of specialty in the drug production. This trend has seen Pharm and Biosciences outsourcing partners come in to supplement their product portfolios in an attempt to quicken their presence in the markets while at the same time trying to cut down their expenses. Some of the major services an A sponsor can seek in this market include preclinical and clinical formulation services, drug delivery systems development, solid dosage form development, bioanalytical methods development, and stability engineering services as well as scale-up services. The market primarily comprises CDMOs, CROs, and formulation development companies that provide a diverse range of services due to the variation offered in the market.
Several key drivers can be attributed to the growth of the market: the increasing rates of chronic disorders, the consistent development of biologic as well as special products, and the trend of employing more individualized medicines. Apart from that, several other reasons may force firms to seek external consulting; these include the authority pressures that compel operating units to pursue compliance with high quality standards. Regionally, North America and Europe stand out as the largest markets primarily due to their large and sophisticated pharmaceutical industries, focus on research and development, and good regulatory conditions. Yet, the Asia-Pacific new generation markets are gradually appearing as a competitive force that provides better costs and developing proficiencies. In all, the formulation development outsourcing market is one that shall continue growing for more and more firms and companies in the pharmaceutical sector aim at trying out the best, and go for the best.
Formulation Development Outsourcing Market Trend Analysis
Increasing adoption of advanced technologies and digital solutions
- Such strategic areas as artificial intelligence, machine learning, and big data have being applied to improve formulation design and process as well as to accurately predict the stabilities and efficacies. These technologies help personal, effectiveness in handling large amounts of data, sound decisions and shorter development time scales. Also, while traditional technologies in drug production have been transformed by continuous manufacturing and 3D printing in formulation are getting more popular, they open the possibility to reach higher efficacy, personalization, and a larger scale of production. It not only enhances the productivity and cost-optima of the formulation development process but also sets a good pace for a more patient-centric approach embraced by the industry lately.
Expanding field of biologics and biosimilars
- The accelerated development of these multifaceted and highly specialized drugs in the marketplace can present major formulation challenges to pharmaceutical firms mainly due to intrinsic characteristics of troublesome and sensitive biological medicine that often need enhanced systems, techniques and methods for stabilization, delivery and manufacturing. Outsourcing contractors with knowledge in formulation development of biologics can be of great help in addressing these issues, giving industry specific solutions when it comes to stabilization, solubility, and delivery options.
- In addition, with the advancement in technology and the concept of personalized medicine stands another great opportunity that is too hard to pass. Personalized medicine, in turn, concerns the development of individualized treatment strategies which necessitates fine and highly specialized formulation strategies. Outsourcing firms that place funds within themes highlighting favorable growth, like nanotechnology and advanced drug delivery system, will be able to benefit from this trend. Given their ability to provide formulation development services that are tailored for individual patients as well as using data analytics for precision medicine, these companies can expect to secure a continually increasing number of pharmaceutical and biotech clients interested in the provision of next-generation therapies. This specialization helps outsourcing partners, in turn, see themselves as indispensable stakeholders in the unfolding of the field of individualized medicine as well as to foster further growth in the formulation development outsourcing market.
Formulation Development Outsourcing Market Segment Analysis:
Formulation Development Outsourcing Market is segmented on the basis of Services type, Route of Formulation, and End-user.
By Services Type, Pre-Formulation segment is expected to dominate the market during the forecast period
- In the FDO market, Pre-Formulation will maintain its position as a primary segment in terms of demand over the forecast period. Pre-formulation services play an important role in the development process as they encompass a detailed examination of several parameters of the drug substance in its solid and liquid states, including physical, chemical, and mechanical properties. This step is the first one in the drug formulation process aimed at selecting the right formulation strategy for the drug to be stable, soluble and bioavailable.
- The Pre-Formulation segment will remain the largest segment of the PPA because of the following reasons. Firstly, the complexity of new chemical entities (NCEs) and biologics which are now developed require additional pre-formulation characterization attempts to ensure optimal understanding of their profile. Second, pharma and biotech organisations face pressure to speed up their development cycles but reduce risks which makes early outsourcing of tasks a business-critical decision to gain additional competencies and technologies in the form of effective analytics providers. Further, the rising interest in manufacturing precise and selective drugs and therapies including through post-genomic science necessitates comprehensive pre-formulation studies before designing formulations for individual requirements.
- Outsourcing of pre-formulation services is quite useful to the actualization of Cutting-Edge facilities and scientific knowledge, which indicates that fewer investments have to be made internally. It not only allows the efficient use of resources at the company’s disposal but also increases the likelihood of successful development of at least one formulation and subsequent regulatory approval. Hence, the Pre-Formulation segment shall remain dominant in the overall OSI market due to a constant need and search for effective and new solutions in creating drugs.
By Route of Formulation, Injectable segment is expected to held the largest share in 2024
- The injectable formulation segment is likely to be the largest out of all the formulation routes of formulation in the global formulation development outsourcing market. This domination comes with several factors such as; ever rising trends of chronic as well as acute diseases that call for parenteral method of delivering medication due to the effectiveness of the method. Along with solids and liquids, injectables are necessary for biologic, vaccine, and other treatments that contain molecules that cannot be consumed orally because of stability and bioavailability limitations.
- These are in part due to increasing biologics and biosimilars demand, which are mostly used in injected formulations, thus boosting this segment. A number of outsourcing partners focused on injectable formulation development will be able to provide value added services in terms of solving problems that may be associated with stability and sterility, as well as in the delivery systems which are so essential to the purpose of such formulations. Similarly, self- administration and home care signify the advantages associated with injectable systems such as pre-filled syringes and auto- injectors to increase the popularity of the injectable segment in the formulation development outsourcing market. Therefore the injectable route is still viewed as one vital sector for the pharmaceutical industries that needs to outsource formulation for development to enhance the scientific treatment fronts that meet the modern therapy needs.
Formulation Development Outsourcing Market Regional Insights:
Asia Pacific is Expected to Dominate the Market Over the Forecast period
- This segment is also expected to experience a high demand in formulation development outsourcing services based on the specific formulation route. This has been as a result of a number of factors, one of which being the continuing advancement in chronic and acute diseases necessitating parenteral administration so as to enhance the accomplishment of the treatment. The injectables play an indispensable role in treating the diseases by means of biosimilars and the vaccines or the other complex molecules that can’t be orally administered because of the considerations to stability and bioavailability.
- Moreover, the increase in the usage of biologic and biosimilar products, which are mostly in the injectable form, certainly propels this segment. Potential outsourcing partners with rendering formulation development especially for injectable formulation should possess specialist know-how that would address some issues of stability, sterility as well as delivery systems that are vital in the injectable products. The burn to self-management and home cure also complement the development of pre-filled syringes as well as auto-injectors, making injectable segment more attractive for the formulation developing outsourcing marketplace.
- As such, the injectable route present a notable interest field for pharmaceutical organizations which is keen on outsourcing formulation development to address the emerging product types in modern therapy.
Active Key Players in the Formulation Development Outsourcing Market
- SGS S.A. (Switzerland)
- Intertek Group plc (UK)
- Recipharm (Sweden)
- Lonza (Switzerland)
- Charles River Laboratories International, Inc. (USA)
- Eurofins Scientific SE (Luxembourg)
- Element (UK)
- Labcorp (USA)
- Thermo Fisher Scientific, Inc. (Patheon) (USA)
- Catalent Inc. (USA)
- Other Active Players
|
Global Formulation Development Outsourcing Market |
|||
|
Base Year: |
2024 |
Forecast Period: |
2025-2032 |
|
Historical Data: |
2018 to 2023 |
Market Size in 2024: |
USD 29.24 Bn. |
|
Forecast Period 2024-32 CAGR: |
9.1 % |
Market Size in 2032: |
USD 58.6 Bn. |
|
Segments Covered: |
By Service Type |
|
|
|
By Route of Formulation |
|
||
|
By End User |
|
||
|
By Region |
|
||
|
Key Market Drivers: |
|
||
|
Key Market Restraints: |
|
||
|
Key Opportunities: |
|
||
|
Companies Covered in the report: |
|
||
Chapter 1: Introduction
1.1 Scope and Coverage
Chapter 2:Executive Summary
Chapter 3: Market Landscape
3.1 Market Dynamics
3.1.1 Drivers
3.1.2 Restraints
3.1.3 Opportunities
3.1.4 Challenges
3.2 Market Trend Analysis
3.3 PESTLE Analysis
3.4 Porter's Five Forces Analysis
3.5 Industry Value Chain Analysis
3.6 Ecosystem
3.7 Regulatory Landscape
3.8 Price Trend Analysis
3.9 Patent Analysis
3.10 Technology Evolution
3.11 Investment Pockets
3.12 Import-Export Analysis
Chapter 4: Formulation Development Outsourcing Market by Service Type (2018-2032)
4.1 Formulation Development Outsourcing Market Snapshot and Growth Engine
4.2 Market Overview
4.3 Pre-Formulation
4.3.1 Introduction and Market Overview
4.3.2 Historic and Forecasted Market Size in Value USD and Volume Units
4.3.3 Key Market Trends, Growth Factors, and Opportunities
4.3.4 Geographic Segmentation Analysis
4.4 Formulation Development
Chapter 5: Formulation Development Outsourcing Market by Route of Formulation (2018-2032)
5.1 Formulation Development Outsourcing Market Snapshot and Growth Engine
5.2 Market Overview
5.3 Oral
5.3.1 Introduction and Market Overview
5.3.2 Historic and Forecasted Market Size in Value USD and Volume Units
5.3.3 Key Market Trends, Growth Factors, and Opportunities
5.3.4 Geographic Segmentation Analysis
5.4 Injectable
5.5 Others
Chapter 6: Formulation Development Outsourcing Market by End User (2018-2032)
6.1 Formulation Development Outsourcing Market Snapshot and Growth Engine
6.2 Market Overview
6.3 Pharmaceutical Industries
6.3.1 Introduction and Market Overview
6.3.2 Historic and Forecasted Market Size in Value USD and Volume Units
6.3.3 Key Market Trends, Growth Factors, and Opportunities
6.3.4 Geographic Segmentation Analysis
6.4 Research and Academic Institutes
Chapter 7: Company Profiles and Competitive Analysis
7.1 Competitive Landscape
7.1.1 Competitive Benchmarking
7.1.2 Formulation Development Outsourcing Market Share by Manufacturer (2024)
7.1.3 Industry BCG Matrix
7.1.4 Heat Map Analysis
7.1.5 Mergers and Acquisitions
7.2 ABB LTD. (SWITZERLAND)
7.2.1 Company Overview
7.2.2 Key Executives
7.2.3 Company Snapshot
7.2.4 Role of the Company in the Market
7.2.5 Sustainability and Social Responsibility
7.2.6 Operating Business Segments
7.2.7 Product Portfolio
7.2.8 Business Performance
7.2.9 Key Strategic Moves and Recent Developments
7.2.10 SWOT Analysis
7.3 EMERSON ELECTRIC CORPORATION (USA)
7.4 EM-TEC GMBH (GERMANY)
7.5 ENDRESS+HAUSAR AG (SWITZERLAND)
7.6 GENERAL ELECTRIC (USA)
7.7 HITACHI HIGH-TECH CORPORATION (JAPAN)
7.8 HONEYWELL INTERNATIONAL INC. (USA)
7.9 HÖNTZSCH GMBH & CO. KG (GERMANY)
7.10 KROHNE MESSTECHNIK GMBH (GERMANY)
7.11 SIEMENS (GERMANY)
7.12 YOKOGAWA ELECTRIC CORPORATION (JAPAN)
7.13 OTHER KEY PLAYERS
Chapter 8: Global Formulation Development Outsourcing Market By Region
8.1 Overview
8.2. North America Formulation Development Outsourcing Market
8.2.1 Key Market Trends, Growth Factors and Opportunities
8.2.2 Top Key Companies
8.2.3 Historic and Forecasted Market Size by Segments
8.2.4 Historic and Forecasted Market Size by Service Type
8.2.4.1 Pre-Formulation
8.2.4.2 Formulation Development
8.2.5 Historic and Forecasted Market Size by Route of Formulation
8.2.5.1 Oral
8.2.5.2 Injectable
8.2.5.3 Others
8.2.6 Historic and Forecasted Market Size by End User
8.2.6.1 Pharmaceutical Industries
8.2.6.2 Research and Academic Institutes
8.2.7 Historic and Forecast Market Size by Country
8.2.7.1 US
8.2.7.2 Canada
8.2.7.3 Mexico
8.3. Eastern Europe Formulation Development Outsourcing Market
8.3.1 Key Market Trends, Growth Factors and Opportunities
8.3.2 Top Key Companies
8.3.3 Historic and Forecasted Market Size by Segments
8.3.4 Historic and Forecasted Market Size by Service Type
8.3.4.1 Pre-Formulation
8.3.4.2 Formulation Development
8.3.5 Historic and Forecasted Market Size by Route of Formulation
8.3.5.1 Oral
8.3.5.2 Injectable
8.3.5.3 Others
8.3.6 Historic and Forecasted Market Size by End User
8.3.6.1 Pharmaceutical Industries
8.3.6.2 Research and Academic Institutes
8.3.7 Historic and Forecast Market Size by Country
8.3.7.1 Russia
8.3.7.2 Bulgaria
8.3.7.3 The Czech Republic
8.3.7.4 Hungary
8.3.7.5 Poland
8.3.7.6 Romania
8.3.7.7 Rest of Eastern Europe
8.4. Western Europe Formulation Development Outsourcing Market
8.4.1 Key Market Trends, Growth Factors and Opportunities
8.4.2 Top Key Companies
8.4.3 Historic and Forecasted Market Size by Segments
8.4.4 Historic and Forecasted Market Size by Service Type
8.4.4.1 Pre-Formulation
8.4.4.2 Formulation Development
8.4.5 Historic and Forecasted Market Size by Route of Formulation
8.4.5.1 Oral
8.4.5.2 Injectable
8.4.5.3 Others
8.4.6 Historic and Forecasted Market Size by End User
8.4.6.1 Pharmaceutical Industries
8.4.6.2 Research and Academic Institutes
8.4.7 Historic and Forecast Market Size by Country
8.4.7.1 Germany
8.4.7.2 UK
8.4.7.3 France
8.4.7.4 The Netherlands
8.4.7.5 Italy
8.4.7.6 Spain
8.4.7.7 Rest of Western Europe
8.5. Asia Pacific Formulation Development Outsourcing Market
8.5.1 Key Market Trends, Growth Factors and Opportunities
8.5.2 Top Key Companies
8.5.3 Historic and Forecasted Market Size by Segments
8.5.4 Historic and Forecasted Market Size by Service Type
8.5.4.1 Pre-Formulation
8.5.4.2 Formulation Development
8.5.5 Historic and Forecasted Market Size by Route of Formulation
8.5.5.1 Oral
8.5.5.2 Injectable
8.5.5.3 Others
8.5.6 Historic and Forecasted Market Size by End User
8.5.6.1 Pharmaceutical Industries
8.5.6.2 Research and Academic Institutes
8.5.7 Historic and Forecast Market Size by Country
8.5.7.1 China
8.5.7.2 India
8.5.7.3 Japan
8.5.7.4 South Korea
8.5.7.5 Malaysia
8.5.7.6 Thailand
8.5.7.7 Vietnam
8.5.7.8 The Philippines
8.5.7.9 Australia
8.5.7.10 New Zealand
8.5.7.11 Rest of APAC
8.6. Middle East & Africa Formulation Development Outsourcing Market
8.6.1 Key Market Trends, Growth Factors and Opportunities
8.6.2 Top Key Companies
8.6.3 Historic and Forecasted Market Size by Segments
8.6.4 Historic and Forecasted Market Size by Service Type
8.6.4.1 Pre-Formulation
8.6.4.2 Formulation Development
8.6.5 Historic and Forecasted Market Size by Route of Formulation
8.6.5.1 Oral
8.6.5.2 Injectable
8.6.5.3 Others
8.6.6 Historic and Forecasted Market Size by End User
8.6.6.1 Pharmaceutical Industries
8.6.6.2 Research and Academic Institutes
8.6.7 Historic and Forecast Market Size by Country
8.6.7.1 Turkiye
8.6.7.2 Bahrain
8.6.7.3 Kuwait
8.6.7.4 Saudi Arabia
8.6.7.5 Qatar
8.6.7.6 UAE
8.6.7.7 Israel
8.6.7.8 South Africa
8.7. South America Formulation Development Outsourcing Market
8.7.1 Key Market Trends, Growth Factors and Opportunities
8.7.2 Top Key Companies
8.7.3 Historic and Forecasted Market Size by Segments
8.7.4 Historic and Forecasted Market Size by Service Type
8.7.4.1 Pre-Formulation
8.7.4.2 Formulation Development
8.7.5 Historic and Forecasted Market Size by Route of Formulation
8.7.5.1 Oral
8.7.5.2 Injectable
8.7.5.3 Others
8.7.6 Historic and Forecasted Market Size by End User
8.7.6.1 Pharmaceutical Industries
8.7.6.2 Research and Academic Institutes
8.7.7 Historic and Forecast Market Size by Country
8.7.7.1 Brazil
8.7.7.2 Argentina
8.7.7.3 Rest of SA
Chapter 9 Analyst Viewpoint and Conclusion
9.1 Recommendations and Concluding Analysis
9.2 Potential Market Strategies
Chapter 10 Research Methodology
10.1 Research Process
10.2 Primary Research
10.3 Secondary Research
|
Global Formulation Development Outsourcing Market |
|||
|
Base Year: |
2024 |
Forecast Period: |
2025-2032 |
|
Historical Data: |
2018 to 2023 |
Market Size in 2024: |
USD 29.24 Bn. |
|
Forecast Period 2024-32 CAGR: |
9.1 % |
Market Size in 2032: |
USD 58.6 Bn. |
|
Segments Covered: |
By Service Type |
|
|
|
By Route of Formulation |
|
||
|
By End User |
|
||
|
By Region |
|
||
|
Key Market Drivers: |
|
||
|
Key Market Restraints: |
|
||
|
Key Opportunities: |
|
||
|
Companies Covered in the report: |
|
||


